Article Text

Abstract
At least 1 in 1000 males lacks part of the long arm of the Y chromosome. This chromosomal aberration is often associated with short stature and infertility. Deletion mapping and genotype-phenotype analysis have previously defined two non-overlapping critical regions for growth controlling gene(s), GCY(s), on the euchromatic portion of the Y chromosome long arm. These initial mapping assignments were based on the analysis of patients carrying a pure 46,XYq− karyotype as defined by classical cytogenetic karyotyping. Four genes have been assigned to the distal one of the two critical regions. To determine whether one or both of these two critical regions harbours GCY and whether one of the four genes assigned to the distal region is involved in determination of stature, nine adult patients with Yq chromosomal abnormalities were studied in detail. By PCR and FISH analysis, we showed that all patients with a previously defined pure 46,XYq− karyotype are actually mosaics with cells containing an idic(Y) or ring(Y) chromosome in association with 45,X0 cells. This leads us to conclude that (1) FISH is an absolute prerequisite for the correct identification of Y chromosomal rearrangements and (2) only patients with interstitial Y deletions are reliable predictors for the physical location of stature gene(s) on Yq. Our molecular analyses of chromosomes from patients with interstitial Yq deletions finally establishes the proximal interval between markers DYZ3 and DYS11 as the only GCY critical interval. No functional gene has so far been identified in this region adjacent to the centromere.
- FISH
- deletion mapping
- Y chromosome stature gene
- GCY
Statistics from Altmetric.com
Human linear growth is a dynamic process regulated by a multitude of different molecular events that collectively determine the adult height of a given person. As a consequence of this complex regulatory network, growth defects are common and various clinical disorders have been associated with growth impairment. Environmental factors also complicate this situation, and it is difficult to consider genetic and external aspects of growth control separately. Despite the fact that height is a multifactorial trait, adult males are generally taller than their female counterparts.1 This observation has led to the assumption that the Y chromosome harbours genes that affect height. This hypothesis is also supported by the observations that XY females are, on average, taller than XX females, that XY males are taller than XX males, and that XYY males are taller than XY males.2 In addition, patients with pure XX or XY gonadal dysgenesis show height differences despite having gonadal steroid deficiency, with final height related directly to the difference in sex chromosome complement.3 4
Patients with a 46,XYq− karyotype often present with short stature and infertility, suggesting the presence of stature and fertility determinants on the Y chromosome long arm.5-18 The “short stature” genetic locus has been termedGCY (growth control gene(s) on the Y chromosome). Detailed mapping of the human Y chromosome19made it possible to delineate precisely the structures of Y chromosomes in patients with naturally occurring deletions. Correlations between breakpoints on Yq and the height of respective patients assigned theGCY locus to the pericentromeric region of Yq11,16 a region comprising roughly 4.5 Mb of DNA.20 Further attempts to refine this localisation led to the definition of two non-overlapping critical intervals, one between sY78 (DYZ3) and sY79 (DYS270), termed GCYinterval I,17 and the other between sY83 (DYS11) and sY165 (DYS246), termed GCY interval II15 18 (fig 1). Four genes21 are contained within GCY interval II.

The purpose of our study was to verify that one or bothGCY regions have an effect on growth, thereby evaluating potential roles of the four known genes in interval II in determining growth. To this end, we reinvestigated the karyotypes of nine adult GCY patients. Detailed FISH and high density STS analyses were used to determine any Y chromosomal aberrations in this patient group. In contrast to previous studies, our results clearly exclude GCY interval II and confirm GCY interval I as the growth controlling region on Yq.
Materials and methods
PATIENTS
Patients HG235, ITA1, SANSCH, JOLAR, and SAYER have been described clinically in detail elsewhere.18 22-25 Patients 1068 and 1069 correspond to cases 11 and 12, respectively, in the study of Ogata et al.15 Patient TOMU is the mother of the boy reported in Muroya et al.26 Patient WL87-6 is a phenotypically normal male with azoospermia. Except for patients SANSCH and TOMU, all patients are males. The heights of the patients and relatives are given in table 1.
Adult patients with partial Y chromosomes. Height is given in centimetres and standard deviations (SD) with reference to national population standards. WL87-6 and SANSCH are German; HG235 is American of German descent; 1069, TOMU, and 1068 are Japanese; JOLAR and SAYER are British
PCR ANALYSIS
The Y specific STSs, loci, and PCR conditions used in this study are described elsewhere.19 27 Genomic DNA for STS analysis was extracted from peripheral blood leucocytes (SANSCH, ITA1, 1068) or from lymphoblastoid cell lines (WL87-6, HG235, 1069, TOMU, JOLAR, SAYER). In each PCR reaction, genomic DNA extracted from peripheral blood leucocytes of normal males and females served as an internal control. Amplification products smaller than 1 kb were resolved on 3% NuSieve agarose/1%SeaKem GTG agarose (FMC) in 1 × TBE (0.089 mol/l Tris-borate/0.089 mol/l boric acid/20 mmol/l EDTA, pH 8.0). For amplification products larger than 1 kb, 1.5% SeaKem GTG agarose gels in 1 × TBE were used for separation.
Reactions were carried out in a total volume of 50 μl (75 mmol/l Tris/HCl, pH 9.0, 20 mmol/l (NH4)2SO4, 0.1% (w/v) Tween20, 1.5 mmol/l MgCl2) containing 1.0 mmol/l of each oligonucleotide primer, 100 ng genomic DNA as template, 5 units of Taq DNA polymerase (Eurogentec), and each dNTP at 1 mmol/l. All PCR reactions were carried out according to the cycling protocol published by the original investigators.
The presence or absence of DFFRY,DBY, UTY, andTB4Y was scored by PCR with primer pairs designed from the cDNA sequences submitted to Genbank. All PCR assays were carried out as described above. The primer pairs are as follows.DFFRY 5′: Left primer (L) GGCCTTTCACAGATTCTCCTG, right primer (R) GAACCTGGCCCTGGCTGTCG;DFFRY 3′ end (L) GAGCCCATCTTTGTCAGTTTAC, (R) CTGCCAATTTTCCACATCAACC; DBY 5′ end (L) TTCCGCTATTCGGTCTCACA, (R) TGGTCCAGTTCAGGGTCATTT;DBY 3′ end (L) CATTCGGTTTTACCAGCCAG, (R) CAGTGACTCGAGGTTCAATG; UTY 5′ end (L) GGTTGGGTATCGTCGTGGGAC, (R) CCTCTTC ACTCTCGCGGCTCGC;UTY 3′ end (L) GCCCATAAATAATTGCTGGAA, (R) TCACCCCAAACCATGTTGTA; TB4Y (L) CTCCGCTAAGTCTTTCACC, (R) TGTCCTCTTTGGTC CCCTGCG.
FLUORESCENCE IN SITU HYBRIDISATION
Metaphase spreads were obtained either from primary blood samples or immortalised cell lines. Preparations were made according to standard protocols.28 Cosmid and plasmid DNA was labelled by nick translation with biotin-16-dUTP (La Roche). Slides for FISH were kept for one week at 4°C in 70% ethanol. A total of 500-1000 ng of plasmid or cosmid probe, 10-20 μg of human Cot-1 DNA (GIBCO BRL), and hybridisation buffer (50% formamide, 10% dextran sulphate, and 2 × SSC, pH 7.0) were mixed, denatured for five minutes, and preannealed for 30 minutes at 37°C. The slides were denatured for two minutes in 70% formamide and 2 × SSC, pH 7.0, at 42°C.29 The preannealed probe was then added and allowed to hybridise overnight in a humidifying chamber at 37°C. The following day, slides were washed and stained with avidin conjugated fluorescein isothiocyanate (FITC). The signal was amplified with biotinylated anti-avidin followed by staining with avidin-FITC once again. Chromosomes were counterstained with 4′,6-diamidino-2-phenylindol dihydrochloride (DAPI). Images of FITC and DAPI stained chromosomes were taken separately by using a cooled charge coupled device camera system (Photometrics, Tucson, AZ, USA). A Macintosh Quadra 900 was used for camera control and digital image acquisition in the “TIF” format using the software package Nu200 2.0 (Photometrics). Separate grey scale fluorescence images were recorded for each fluorochrome. Images were overlaid electronically and further processed using the Adobe Photoshop software.
Results
MOLECULAR DELETION MAPPING
Y chromosomal breakpoints were determined by DNA analysis using Y specific STSs (sequence tagged sites) spanning intervals 4B to 5F. The data are summarised in fig 2. The order of Y specific STSs in this region is drawn from a gapless PAC/BAC contig, which includes the loci sY79 through sY165. Each STS specific PCR reaction was compared to the presence/absence in male versus female controls.

Summary of STS and EST analysis in patients with Y chromosomal rearrangements. In all cases where previously published data of the patients were reinvestigated, the identical DNA sample used for the primary analysis was studied. Patients were grouped into three classes: A, B, and C. Present loci are indicated by black segments and absent loci by white segments. Marker GY8 is indicated by a shaded box in SANSCH, as it was not present in all patients' Y chromosomes (see text for detail). *The breakpoint of 1068 is not located, as originally stated, in GCY interval II (see text for detail).
Deletion mapping of patients 1068 and 1069 by Southern blot hybridisation as well as by STS analysis has been described previously.15 Owing to the higher density of STSs used in this study and their known order determined by physical mapping, we can now specify and precisely locate the breakpoint of patient 1069 between markers sY83 and sY86. STS analysis of a DNA sample of patient 1068 showed that the distal marker sY149 is negative (data not shown), but all other STSs from the 4B to 5F interval were shown to be present. We therefore conclude that the breakpoint of this patient resides considerably more distally and not, as originally stated, within the pericentromeric Yq11 region. The distal breakpoint of patient HG235, previously mapped by Southern blot hybridisation to a region between markers sY78 and sY83 (Ellis and German, unpublished data), can now be narrowed down to the region between sY83 and sY86 (note that marker sY79 is deleted in this patient). The breakpoint of patient ITA1, described by De Rosa et al 18 as residing between sY83 and sY165, was precisely mapped between GY6 and sY88. STS analysis of a DNA sample of patient WL87-6, whose breakpoint was previously mapped between 50f2/D (DYS7/D) in interval 4A on Yp and 50f2/E (DYS7/E) in interval 6A on Yq distal to sY165 (Zöllner and Müller-Reible, unpublished data), has now been refined to the region between markers sY79 and sY81. STS analysis of two female patients with X;Y translocations, SANSCH and TOMU, indicated that their breakpoints reside between sY83 and sY86, a region which also harbours the breakpoints of HG235 and 1069. With regard to SANSCH, one marker, GY8, can be amplified from genomic DNA, but the amplification product is always far less intense than in the control reactions. Hybridising the Y specific amplification product of GY8 toEcoRI digested DNA from patient SANSCH, however, fails to show the expected fragment. We therefore assume that SANSCH belongs to the group of patients with mosaicism for two different partial Y chromosomes. This group may constitute up to ∼14% of patients with terminal deletions of the Y chromosome long arm.30
The Y chromosomes of JOLAR and SAYER were shown to carry large interstitial deletions. Their proximal breakpoints are located in the interval between markers sY82 and sY83 (JOLAR) and sY83 and sY86 (SAYER), while the distal breakpoints are located in the interval between markers GY6 and sY88 (JOLAR) and sY87 and GY6 (SAYER), confirming recent results.31
FLUORESCENCE IN SITU HYBRIDISATION
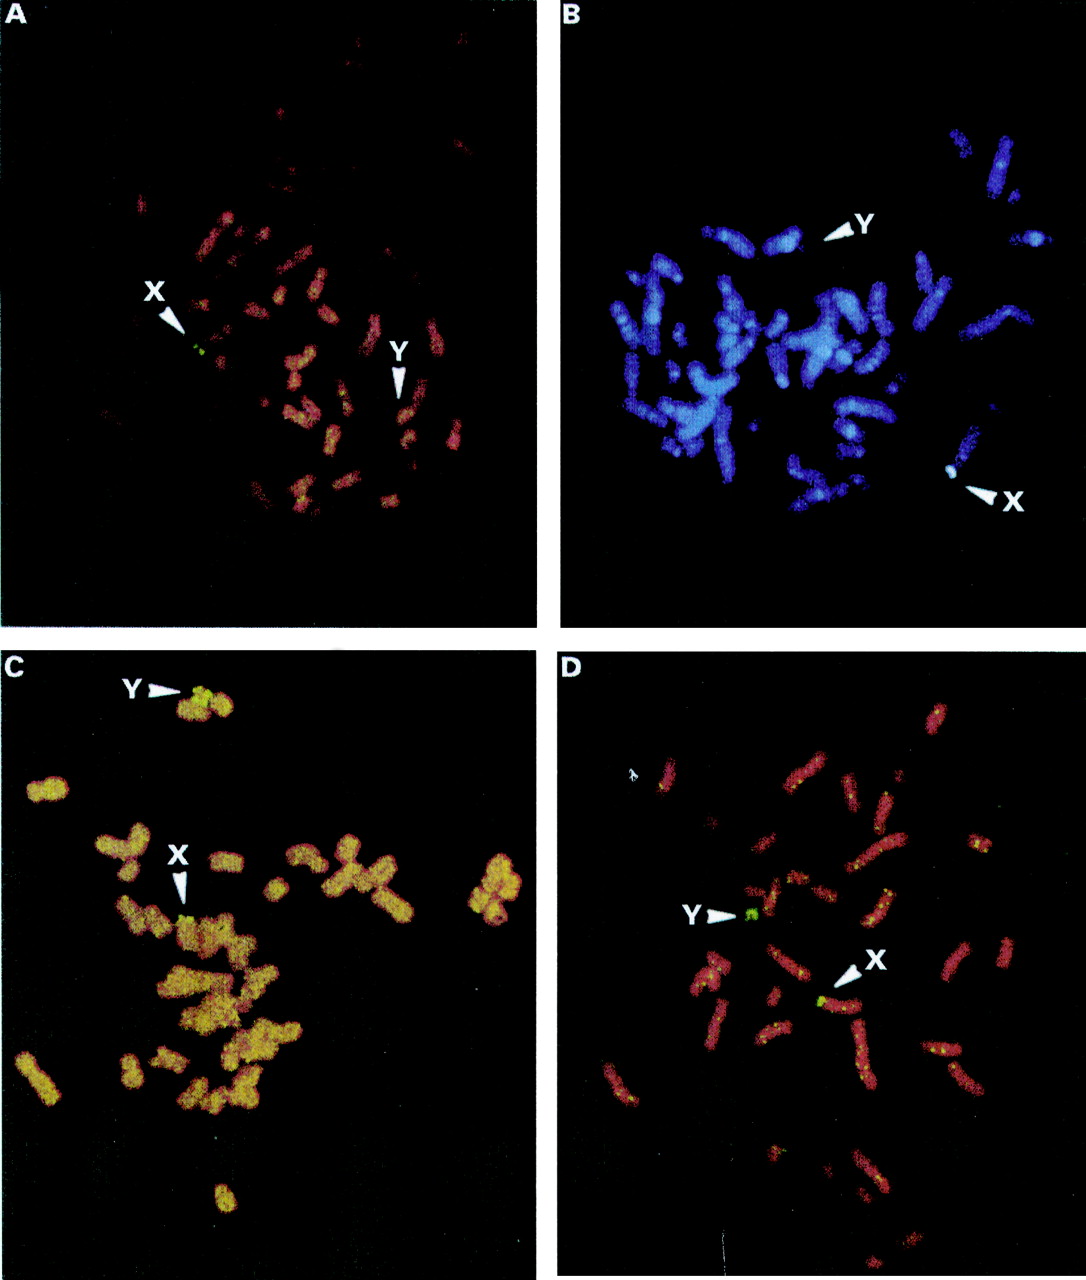
All patients with terminal deletions of Yq11 were scored for the presence of the SHOX containing cosmid LLOYNC03"M"34F05 of the pseudoautosomal region PAR1.32The data are summarised in table 2. Each fluorescent in situ hybridisation (FISH) experiment was carried out simultaneously on metaphase spreads from normal female and male controls. Patients WL87-6 and 1069 showed two signals on the Y chromosome indicating the presence of iso(Yp11) chromosomes (fig 3C, D). Patients HG235 and ITA1 did not show a SHOX derived hybridisation signal suggesting terminal deletions of Yp11 possibly indicating a ring(Y) chromosome (fig 3A, B). In the original report, a ring Y chromosome was proposed for HG235.22 FISH analysis on metaphases derived from blood from patient ITA1 with the Y specific centromere repeat probe Y-97 (sY78) showed the presence of 45,X0 cells in 18% (33 of 182) of the cells studied (table 1). Performing FISH on metaphase spreads from immortal cell lines of patients HG235, WL87-6, and 1069, 6%, 16%, and 33% of cells were shown to be 45,XO, respectively. The karyotypic classification of the four patients HG235, WL87-6, 1069, and ITA1 therefore must be redefined as follows: HG235: 46,Xr(Y) (94% 46,XY; 6% X0); WL87-6: 46,Xdic(Y) (84% 46,XY; 16% X0); 1069: 46,Xdic(Y) (67% 46,XY; 33% X0), and ITA1 46,Xr(Y) (82% 46,XY; 18% X0). The Xp breakpoint in patients TOMU and SANSCH was studied with FISH by using cosmids from the pseudoautosomal region. The presence of LLNLc110A1224 and the absence of ICRFc104I116 indicates a breakpoint residing between 2250 and 2600 kb from the telomere in both TOMU and SANSCH (data not shown).
Comparison of the karyotypes of patients carrying Yq11 terminal deletions detected by cytogenetic (published data) and fluorescence in situ hybridisation analysis (our data). In patient ITA1, metaphase spreads were prepared from peripheral blood leucocytes, in patients WL87-6, HG235, and 1069 metaphase spreads were prepared from EBV transformed cell lines
Characterisation of partial Y chromosomes by FISH with the SHOX containing cosmid LLOYNC03"M"34F05.32 (A, B) Metaphase spreads of patients HG235 and ITA1 showing one X chromosome and a Y chromosome (arrow) with a terminal deletion of Yp11 (presumably a ring Y chromosome). (C, D) Metaphase spreads of patients WL87-6 and 1069 showing one X chromosome and an isodicentric Y chromosome (arrow), iso(Yp).
In summary, FISH analysis using the SHOXcontaining cosmid LLOYNC03"M"34F05 and the Y centromere specific marker Y-97 (DYZ3) as hybridisation probes showed iso(Yp) and ring(Y) chromosomes as well as X0 mosaicism in group A patients (fig 2), which was not detectable by classical Giemsa banding. Three copies ofSHOX were detected in patients WL87-6 and 1069, which may compensate for the loss ofGCY. On the other hand, only oneSHOX copy was detected in HG235 and ITA1 rendering it impossible to predict if these patients have also lostGCY. Furthermore, the presence of X0 cells in all analysed patients with terminal deletions further complicates the situation as it has been shown in studies of Turner syndrome patients that the loss of an X chromosome results in short stature. We therefore conclude that only patients JOLAR, SAYER, SANSCH, and TOMU can be considered when narrowing down the critical interval forGCY.
MOLECULAR MAPPING OF GCY AND ASSESSMENT OF DFFRY,DBY, UTY, ANDTB4Y ASGCY CANDIDATE GENES
We have shown above that patients with terminal deletions are not helpful in predicting the GCY interval. We therefore focused on patients with translocations and interstitial deletions within the critical region (fig 2). To evaluate the relevance of DFFRY, DBY,UTY, and TB4Y as candidate genes for GCY, we used gene specific primer pairs and tested them on patients JOLAR, SAYER, SANSCH, and TOMU. All four genes reside within GCYinterval II.21 31 This region is partly overlapping with the AZFa region (deleted in patients with azoospermia) and recently the entire AZFa region has been sequenced (Whitehead Institute for Biomedical Research). We have shown that the entireDFFRY gene is deleted in SAYER and JOLAR. In addition, the entire DBY gene, as well as part of the 3′ region of the UTY gene, is deleted in patient JOLAR. As both SAYER and JOLAR are of normal stature, DFFRY,DBY, and UTY can be excluded as GCY candidate genes.TB4Y, however, is present in SAYER, JOLAR, SANSCH, and TOMU. As TOMU is of short stature this also excludesTB4Y as a candidate gene forGCY. In summary, we show that theGCY interval II does not harbour stature gene(s).
Discussion
Subjects with terminal deletions of the Y chromosome long arm often present with short stature and infertility. Several attempts to determine more precisely the localisation of the stature locus led to the identification of two non-overlapping critical intervals within the proximal part of Yq11. As a first step towards positional cloning of candidate genes, it was necessary to determine if one or both of these regions harbour a GCY locus. Therefore, we reinvestigated the DNA of patients with a monocentric Yq− chromosome to clarify the karyotypes further and refine deletion intervals. The breakpoints of all patients were precisely determined by high density STS analysis. For patient 1068, all markers between sY78 and sY165 were shown to be positive. In contrast to previous publications, fluorescence in situ hybridisation analysis also showed the presence of iso(Yp) chromosomes in patients 1069 and WL87-6 and presumably a ring(Y) chromosome in HG235 and ITA1. Furthermore, we show that all patients with a terminal deletion of Yq are mosaics with 45,X0 cells. It is possible, however, that these mosaicisms may not reflect the in vivo situation. Nevertheless these data stress the importance of FISH analysis in evaluating Y chromosomal aberrations.
At least three genetic parameters influence the final height of subjects with Y chromosomal alterations: theSHOX copy number, mosaicism with 45,X0 cells, and the presence or absence of Yq11 derived DNA. Iso(Yp) and dic(Y) chromosomes with a small proportion of Yq and twoSHOX copies on the Y usually cannot be distinguished from partial Yq deletions by classical Giemsa banding (patient 1069). Furthermore, small terminal or interstitial deletions within PAR1 harbouring the SHOX gene would be well below the resolving power of Giemsa banding (patient ITA1). Patients with interstitial deletions of Yq11 are much better suited to circumvent these problems. We have studied female patients with a karyotype 46,X,der(X)(Xp22;Yq11) and predict that the presence ofGCY on Yq should, at least in part, compensate for the loss of SHOX on Xp22. Since the spreading of X inactivation on the translocation chromosome may affect the Y chromosomal stature gene, we compared our data to published reports on female patients with similar chromosomal aberrations.26 33-46 Sixteen of the 19 patients studied with short stature fall into three classes: three patients with random X inactivation, eight with preferential inactivation of the der(X), and five of the normal X. The preferential inactivation of the der(X) in three patients with normal stature provides evidence that the expression of GCY is probably not affected by X inactivation. Consequently, the height of a female with the karyotype 46,X,der(X)(Xp22;Yq11) is dependent on the amount of translocated Yq material. As TOMU is of short stature,GCY must be located proximal to sY86. EST analysis mapped the genes DFFRY,DBY, UTY, andTB4Y distal to the breakpoint of patient TOMU. As DFFRY,DBY, and part ofUTY also reside within the interstitial deletion of JOLAR, who has normal stature, this definitely excludes them as GCY candidate genes. These data are in accordance with the FISH results mapping theGCY locus proximal to sY83.
In summary, our data have excluded the region between markers sY83 and sY165 as the critical interval for GCY and define the region between sY78 and sY83 as the onlyGCY interval on Yq. This region is approximately 2 Mb in size and does not contain any known functional genes to date.
Acknowledgments
We thank A Mertz, B Wogatzky, and M-C Meffert for technical help, Michael Burnett for critical comments, and the following clinicians for providing immortalised cell lines and genomic DNA extracted from blood: H Cooke, N Ellis, J German, T Hargreave, C Müller-Reible, K Muroya, Y Nakahori, S Spranger, and S Zöllner. The Y chromosome specific cosmid library used in this work was constructed at the HGC, LLNL, Livermore, CA 94550 under the auspices of the National Laboratory Gene Library Project sponsored by US DOE. We thank G Zehetner, H Lehrach, and the resource centre team in Berlin for providing the X chromosome specific cosmid library. This work was supported by a grant from the Deutsche Forschungsgesellschaft (Ra 380/10-1).