Article Text

Statistics from Altmetric.com
- APOE, apolipoprotein E
- BMI, body mass index
- DXA, dual energy X-ray absorptiometry
- IBD, identity by descent
- LD, linkage disequilibrium
- LDL, low density lipoprotein
- PCR, polymerase chain reaction
- PFM, percentage fat mass
- QTDT, quantitative transmission disequilibrium test
- SNP, single nucleotide polymorphism
- TGF-β1, transforming growth factor beta 1
Obesity, defined as a body mass index (BMI) of greater than 30 kg/m2, has become a worldwide public health problem.1 About 250 million adults, roughly 7% of the world adult population, are considered obese and two or three times as many may be overweight with BMI of 25–30 kg/m2.2 A recent analysis shows that the health care cost of obesity is probably between 0.89% and 4.32% of the national expenditure in the United States.3 Obesity is associated with many diseases such as type 2 diabetes mellitus, hypertension, coronary heart disease, and certain forms of cancer.1 As a complex disease, obesity is determined by multiple genetic and environmental factors, including physiological, behavioural, and sociocultural factors.4–7 Numerous molecular genetics studies have been launched to search for the genes underlying the variations of obesity phenotypes, resulting in a host of candidate genes and potentially important genomic regions.8
Apolipoprotein E (APOE), coding a glycoprotein that plays a central role in lipid metabolism, is considered as a prominent candidate gene for obesity. APOE binds with high affinity to the low density lipoprotein (LDL) receptor and facilitates endocytosis of the associated lipoprotein particle.9 In addition, APOE mediates lipoprotein interactions with the LDL receptor related protein, very low-density lipoprotein receptor, and other lipoprotein receptors.9,10 Some studies have reported positive associations between APOE genotypes and some obesity phenotypes,11–14 whereas negative results were observed for the other obesity phenotypes.13–15 The transforming growth factor beta 1 (TGF-β1) gene codes a multifunctional cytokine that controls proliferation, differentiation, and other functions in many cell types, including adipocyte precursor cells.16 Increased TGF-β1 expression was associated with BMI and abdominal adipose tissue in morbid obesity.17 A recent study suggested an association between TGF-β1 polymorphism and both BMI and abdominal obesity in Swedish men.18
The relevance of these two genes to obesity has been suggested by evidence from linkage studies. Several studies have supported linkage to obesity phenotypes at chromosome 19q13, where the two genes are located. Saar et al19 got a peak LOD score on 19q12, a region very close to 19q13, for obesity in German children and adolescents. Recently, a whole genome linkage study conducted by our group has provided some suggestive evidence of linkage for obesity phenotypes on chromosomal 19q13 (Liu et al to be submitted). In mouse models, a number of QTLs for obesity phenotypes have been found with the homologous location for human chromosome 19q13, further highlighting the importance of this region to obesity.8
In the present study, using the tests implemented in the statistical software package QTDT, quantitative transmission disequilibrium test,20 we tested the linkage and association of these two genes with obesity phenotypes by investigating single nucleotide polymorphisms (SNPs). Our study sample contains 405 white nuclear families comprising 1873 subjects.
Key points
-
Apolipoprotein E (APOE) and transforming growth factor beta 1 (TGF-β1) are involved in lipid metabolism and adipocyte differentiation.
-
The purpose of this study was to test the linkage or association between APOE and TGF-β1 genes and obesity phenotypes. The quantitative transmission disequilibrium test (QTDT), was used in a large sample of 1,873 subjects from 405 white nuclear families.
-
Obesity phenotypes tested included body mass index (BMI), fat mass, percentage fat mass (PFM), and lean mass, with the latter three being measured by dual energy X ray absorptiometry (DXA). Four single nucleotide polymorphisms (SNPs) in the APOE gene and three SNPs in the TGF-β1 gene were analysed.
-
Significant linkage disequilibrium (0.155 ⩽|D’|⩽ 0.907, p<0.01) was observed between pairs of SNPs within each gene except between SNP5 and SNP6 (p>0.1) in the TGF-β1 gene.
-
For the APOE gene, within family association was found between SNP1 and PFM (p = 0.001), between haplotype CGTC and both fat mass (p = 0.012) and PFM (p = 0.006). For the TGF-β1 gene, evidence of within family association was observed between lean mass and SNP5 (p = 0.003), haplotype C+C (p = 0.012), and haplotype T+C (p = 0.012).
-
Both APOE and TGF-β1 genes are associated with obesity phenotypes in our study white population.
MATERIALS AND METHODS
Subjects
The study subjects came from an expanding database being created for studies to search for genes underlying the risk to osteoporosis and obesity at the Osteoporosis Research Center of Creighton University. The study was approved by the Creighton University institutional review board. All subjects were white Europeans. Only healthy people were included with the exclusion criteria that were detailed elsewhere.21 For each study subject, information on age, sex, medical history and family history was acquired. A total of 405 nuclear families were recruited with 1873 subjects, including 740 parents, 744 daughters and 389 sons. Among these, 341 families were composed of both parents and at least one offspring. In the remaining 64 families, there were at least two children with either one or no parent. The average family size was 4.62 (1.78) (mean (SD)), ranging from 3 to 12, and there were 1512 sibling pairs in total.
Measurement
Fat mass and lean mass were measured by dual energy X-ray absorptiometry (DXA) with a Hologic 2000+ or 4500 scanner (Hologic Inc., Bedford, MA, USA). Measurements of BMD on the two types of machines agreed within 1%, but the body mass measurements differed in an unsystematic way. Both machines were calibrated daily. The body composition bar was used on every whole body scan on the Hologic 2000+ scanner. On the Hologic 4500 scanner, the bar was not needed for the body scans; instead, it was scanned every week. Percentage fat mass (PFM) is the ratio of fat mass to body weight (the sum of fat mass plus lean mass plus bone mineral content). Weight was measured in light indoor clothing, using a calibrated balance beam scale, and height was measured using a calibrated stadiometer at the same visit as for the body scan. The measurement precision of BMI as reflected by the coefficient of variation was 0.2%. The coefficients of variation for fat mass, PFM, and lean mass were 2.2%, 2.2%, and 1.0%, respectively, for measurements obtained on the Hologic 2000+ scanner, and were 1.2%, 1.1%, and 0.7%, respectively, for measurements on the Hologic 4500 scanner. Members of the same nuclear family were usually measured on the same type of machine.
Genotyping
After searching SNP databases, including dbSNP (www.ncbi.nlm.nih.gov/SNP), JSNP (http://snp.ims.u-tokyo.ac.jp), HGVbase (http://hgvbase.cgb.ki.se), and OMIM (www.ncbi.nlm.nih.gov/omim), as well as reviewing previously published studies, four SNPs in each gene were selected. Our selection criteria were as follows: a) functional relevance and importance; b) degree of heterozygosity—that is, allele frequencies; c) position in or around the gene; and d) their use in previous genetic epidemiology studies. For presentational conveniences, the selected SNPs were coded as SNP1–8 as indicated in table 1. Among these eight SNPs, SNP6 is an insertion/deletion (+/−) polymorphism of pyrimidine C and the others are nucleotide substitution.
Information and the primer sequences for the studied SNPs in the APOE and TGF-β1 genes
DNA was extracted from whole blood using a commercial isolation kit (Gentra Systems, Minneapolis, MN, USA) following the procedure detailed in the kit. The genotyping procedure for all SNPs was similar, involving polymerase chain reaction (PCR) and invader assay reaction (Third Wave Technology, Madison, WI, USA). PCR was performed in a 10 μl reaction volume with 30 cycles. After amplification, an invader reaction was performed in a 7.5 μl reaction volume and the fluorescence intensity for both colours was read using a Cytofluor 4000 multiwell plate reader (Applied Biosystems, Foster City, CA, USA). The genotype for every sample was called according to the ratio of the fluorescence intensity of the two dyes. PedCheck software22 was used to verify Mendelian inheritance of the alleles within each family.
We first genotyped all eight SNPs in a random sample of 190 subjects, and found that the frequency of the rare allele (T) of SNP7 in the TGF-β1 gene was very low (0.8%). Therefore, we continued to genotype the other three SNPs of the TGF-β1 gene and four SNPs of the APOE gene in all of the remaining samples.
Statistical analyses
Single locus analyses
The allele frequencies of each SNP were estimated in all the subjects of the nuclear families using a maximum likelihood method implemented in the program SOLAR (available at www.sfbr.org/sfbr/public/software/solar).
The quantitative transmission disequilibrium test (QTDT) is a family based linkage disequilibrium (LD) test that is applicable to the analysis of quantitative traits in nuclear families of any size.20 Under the flexible variance component framework, tests of population stratification, linkage, total association, and within family association between each of the SNPs and obesity phenotypes were implemented in the statistical software package QTDT (www.sph.umich.edu/csg/abecasis/QTDT/). The orthogonal model of Abecasis et al20 was adopted in the QTDT analyses, where the genotype score is decomposed into orthogonal between family (βb) and within family (βw) components. Population stratification is tested according to whether βb = βw as proposed by Fulker et al.23 Linkage tests are based on the standard variance component methods and the identity by descent (IBD) among relatives. Program Simwalk 2 (available at www.genetics.ucla.edu/home/software.htm) was used to calculate IBD probabilities. Total association tests use all information including within and between family components, and may yield false positive or negative results due to population stratification or admixture. Within family association (using TDT), however, is significant only if there is linkage disequilibrium, and is robust to population stratification/admixture. In this study, 1000 permutations were performed to assess the reliability of the within family association results. When the within family association is observed, the approximate phenotypic variation due to the detected marker is calculated as 2p(1-p)a2/Vp, where Vp is the total phenotypic variance, p is the allele frequency of the marker and a is the estimate of additive effect—that is, E(βw) = a.20 When both linkage and association are detected in separate analyses, Fulker et al23 suggested testing linkage while simultaneously modelling association to evaluate whether the candidate marker is the functional mutation underlying the trait.
Haplotype analyses
Haplotype reconstruction in our nuclear families was performed using the program Genehunter version 2.1 (www.hgmp.mrc.ac.uk/Registered/Option/genehunter.html). Genehunter extracts complete multipoint inheritance information to infer maximum likelihood haplotypes for all individuals in nuclear families.24 The SNPs for haplotypes were arranged in the order SNP1, SNP2, SNP3, SNP4 and SNP5, SNP6, SNP8 in the APOE and TGF-β1 genes, respectively. Haplotype frequencies were estimated from the unrelated sample (parents from each nuclear family). Pairwise linkage disequilibrium between the SNPs in each candidate gene was calculated by the normalised measure, D’.25 The statistical significance of the observed LD was examined by Monte Carlo approximation of Fisher’s exact test.26 Quadratic polynomial regression was used to fit the relationship between the physical distance and the LD (SigmaPlot 2000, SPSS Inc., Chicago, IL). Like single locus analyses, QTDT was conducted for the haplotypes in APOE and TGF-β1. Using the sequential tests within QTDT, χ2 and p values were computed for those haplotypes present in at least 30 informative offspring. Seven and six such haplotypes were found in the APOE and TGF-β1 genes, respectively. In the previous association studies on the relationships between the APOE gene and obesity phenotypes,11,13,15 APOE haplotypes were defined by SNP3 and SNP4. For comparison with the previous results, we performed additional QTDT analyses for the haplotypes formed by the two SNPs in the APOE gene.
Data transformation
Variance component methods (such as those implemented in the QTDT) make the critical assumption that the quantitative trait data within a family either follow, or can be transformed to follow, a multivariate normal distribution. Serious violation of the multivariate normality assumption may lead to biased parameter estimates27 and an inflation of type I error rate,28 while Williams et al29 found that the variance component analyses were robust to reasonable violations of the normality of the data. In the present study, all the four obesity phenotypes showed marked departure from normal distribution (p<0.01) using the Anderson-Darling test, and therefore, were transformed to approach normality using the Box-Cox procedure. Both procedures were implemented in the statistical software MINITAB (Minitab Inc., State College, PA, USA). All the statistical analyses were performed on the transformed data with age and sex as covariates, both of which significantly affected the study obesity phenotypes.30
Correction for multiple testing
In the present study, we tested seven SNPs and 13 haplotypes in the two candidate genes, and analysed four obesity phenotypes to uncover significant marker trait associations. These tests resulted in a multiple testing problem. As an adjustment for multiple testing, Bonferroni correction is likely to be too conservative and may erase some statistical significance in association studies,31,32 because these statistical tests are expected to be highly correlated. The correlation can be illustrated by the following evidences: a) the genetic distance between the two candidate genes is ∼3.5 cM on chromosome 19q13; b) SNPs in each gene are in significant LD (shown in the results below); and c) four studied phenotypes are significantly correlated.33 To this end, 1000 lots of Monte Carlo permutations tests34 were performed to establish an empirical threshold, which was p⩽0.005 for an individual test to achieve a global significance level of 0.05 for our analyses in the present study.
RESULTS
Frequencies of the alleles and haplotypes and the pairwise LD
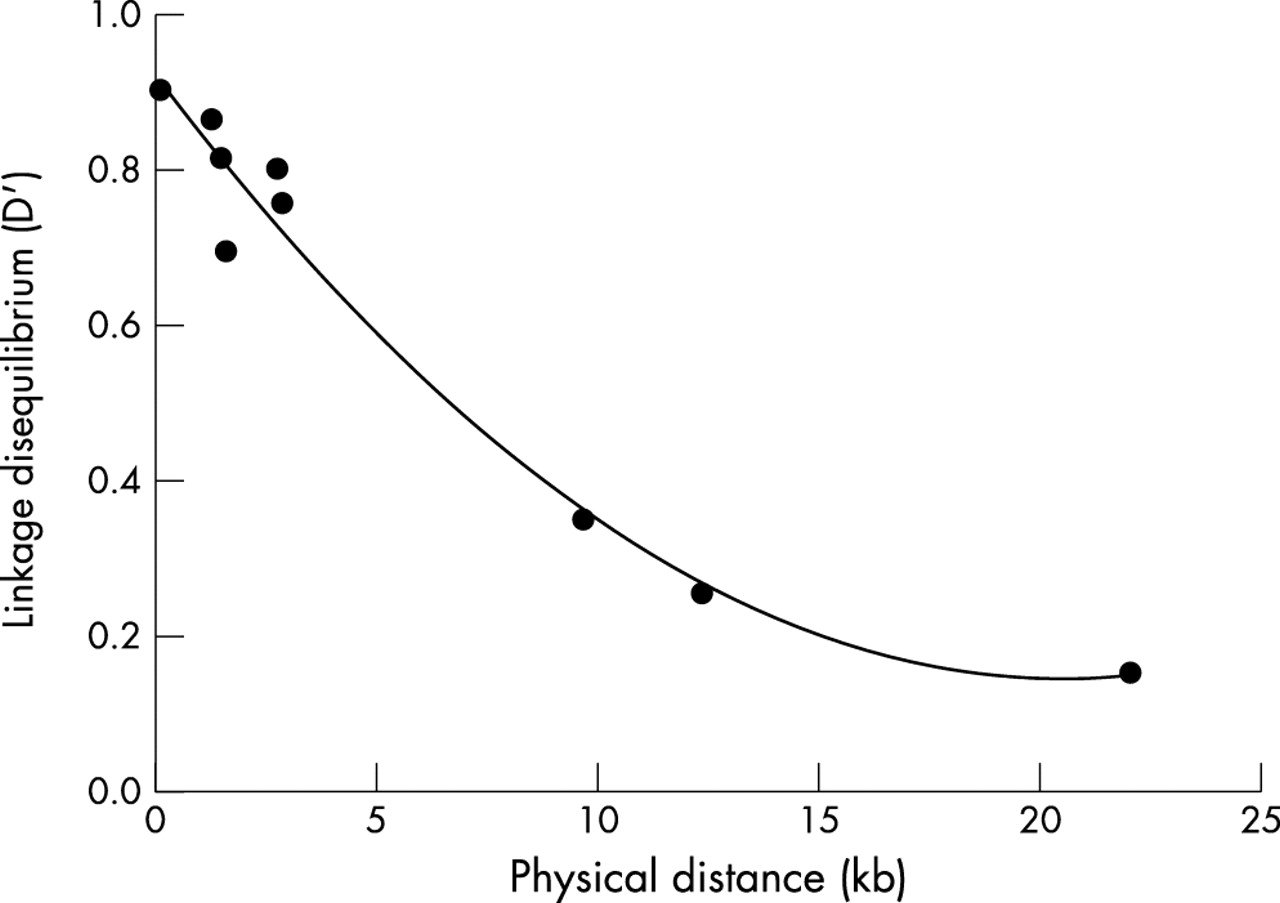
The frequencies of the alleles and haplotypes for the two genes are presented in table 2. For the APOE gene, the minor allele frequencies were 35.7%, 39.9%, 14.9% and 8.7% for SNP1, SNP2, SNP3, and SNP4, respectively. When the APOE haplotype was reconstructed by SNP3 and SNP4, all four possible haplotypes were observed. The most common one was haplotype TC with a frequency of 68.1%, a little lower than 74% in the Palauans13 and 79% in the Rancho Bernardo Heart and Chronic Disease Study cohort,12 while the least frequent was haplotype CT with a frequency of only 0.4%. When the APOE haplotype was defined according to all of the four studied SNPs, 13 haplotypes were detected, and the other three theoretically possible haplotypes, CGCT, CACT, and GACT, were not observed. Five major haplotypes with frequency >5% accounted for 95.8%, the other eight rare haplotypes only amounted to 4.2%. For the TGF-β1 gene, the allele frequencies were similar to the results reported by Langdahl et al35, with minor allele frequencies of 31.1%, 2.1% and 27.3% for SNP5, SNP6, SNP8, respectively. All the eight possible haplotypes were observed with the four most common ones accounting for 97.8%. Strong LD (0.155⩽|D’|⩽0.907) existed between pairs of SNPs in each gene (p<0.01) except between SNP5 and SNP6 in the TGF-β1 gene (see the figure). There is a general trend that LD decays with increasing distances between two SNPs. However, within the same gene, LD is highly variable between pairs of SNPs.
Frequencies of the minor alleles and haplotypes in the seven SNPs in the two genes*
Association or linkage between individual SNPs and obesity phenotypes
Table 3 presents a summary of the linkage and association analyses for the two genes. We did not find any evidence of population stratification and total association at each SNP marker for each phenotype. For within family association, strong or suggestive results were found for lean mass in relation to SNP5 (p = 0.005), and PFM in relation to SNP1 (p = 0.012). Such possible within family associations were confirmed with permutation tests (p = 0.003 and 0.001 for SNP5 and SNP1, respectively). SNP1 accounted for 1.31% of PFM variation, and subjects with allele G had an average of 3.57% higher PFM than those without this allele. About 1.25% of lean mass variation was explained by SNP5, and persons carrying allele C had, on average, 4.77% lower lean mass than non-carriers. In this study, no evidence was observed for linkage between any of the SNPs with the studied phenotypes, and as expected, we did not find any significant results for the tests of linkage modelling association.
p values of tests of population stratification and association between the APOE and the TGF-β1 with the phenotypes and the phenotypic variation due to the marker (%)
Association or linkage between haplotypes and obesity phenotypes
Haplotype analyses yielded interesting and compatible results (table 3). In the APOE gene, significant total associations were detected between the haplotype CGTC and fat mass (p = 0.002), lean mass (p = 0.003), and PFM (p = 0.004). For within family association, the significance for this haplotype with lean mass was not observed, but some evidence was found for fat mass (p = 0.023) and PFM (p = 0.012). In the subsequent permutation, increased significance was detected with p values of 0.012 and 0.006 for fat mass and PFM, respectively. The contribution of this haplotype to the phenotypic variation of fat mass and PFM was 1.17% and 1.41%, respectively. Subjects carrying haplotype CGTC had, on average, 5.63% lower fat mass and 3.55% lower PFM than those without it. Significant population stratification and within family association were detected (p = 0.005 and 0.001, respectively) between haplotype GGTC and lean mass. After permutation tests, only some evidence was found for within-family association (p = 0.016). For the TGF-β1 gene, strong or suggestive evidence of total association was found for lean mass in relation to haplotype C+C and haplotype T+C (p = 0.002 and 0.008, respectively), where “+” denotes insertion of nucleotide C at SNP6. Similar results were detected for within family association with p = 0.013 for haplotype C+C and p = 0.008 for haplotype T+C. In the subsequent permutation tests, the results for within family association were confirmed with the p values of 0.012 for both of the two haplotypes. Haplotype C+C explained 0.98% of lean mass variation and subjects with this haplotype had an average of 4.71% lower lean mass than those without it. Haplotype T+C contributed to 1.14% phenotypic variation of lean mass, and persons carrying this haplotype had a slightly higher lean mass (2.13%) than non-carriers. In the present study, no evidence was found for the linkage of the haplotypes to the studied phenotypes. For unmentioned haplotypes, either no significant results were observed, or they were not tested because there were not enough informative offspring. When APOE haplotypes were reconstructed only according to SNP3 and SNP4, we did not get any evidence of linkage or association between the haplotypes with each phenotype in any test.
DISCUSSION
Extensive molecular genetics studies have been performed, usually by traditional linkage or association approaches, to search for genes or genomic regions contributing to the variation of obesity phenotypes.8 The population based association approach, although valuable, may yield spurious results partly due to population stratification or admixture.36 The linkage approach, which may reveal genomic regions harbouring QTLs without a prior knowledge for underlying traits, is often of limited statistical power.37–40 The transmission disequilibrium test (TDT), a family based approach, is robust to population stratification or admixture.41 TDT may be much more powerful compared with the traditional linkage approach in testing linkage of specific candidate genes to complex traits.38 In recent years, the TDT has gained more attention and is becoming popular in molecular genetic studies of complex traits.42 However, the use of this approach in candidate gene studies for obesity is still relatively rare but see the studies of Klannemark et al43 and Li et al.44 The present study represents our effort to test the linkage or association of the APOE and TGF-β1 genes with obesity phenotypes using TDT in a large sample of white nuclear families.
Various phenotypes have been employed in obesity research. To date, most of the molecular genetic studies on obesity have focused on BMI, with a few on fat mass and PFM and even fewer on lean mass. As a convenient measurement of body fat storage at low cost for large samples, BMI has been widely used.4 However, BMI can not distinguish fat mass from lean mass,45 and the utility of BMI as an index of obesity remains controversial.46 For example, athletes often have a BMI >25 kg/m2, along with only 10%–15% body fat.45 Two alternative measurements, body fat mass and PFM, are considered phenotypically more homogeneous and more appropriate for obesity research.47 At the same BMI level, PFM differed between ethnic groups after some covariates were controlled.48 Since excess body weight consists of not only fat mass but also lean mass, it may also be important to study lean mass.49 In the present study, body composition measurements, including fat mass, PFM and lean mass were assessed by DXA, a relatively more accurate method than those previously used, such as bioelectrical impedance and underwater weighing.50 Thus, our study employing different phenotypes may offer advantages in searching for obesity genes.
Several studies have addressed the relationship between the APOE gene and obesity, largely focusing on the haplotypes defined from SNP3 and SNP4, both of which are located in exon 4. SNP3 is a nucleotide substitution of T to C causing cysteine to arginine at amino acid position 112; while SNP4 involves a nucleotide substitution of C to T causing arginine to cysteine at amino acid position 158. For the haplotypes defined by these two SNPs, positive associations have been found with plasma leptin level in Palauans,13 waist circumference as well as cholesterol levels in white women.12 and dietary induced changes in high density lipoprotein cholesterol in obese postmenopausal women.14 However, negative results were also reported for PFM in Palauans,13 dietary induced changes in body weight and low density lipoprotein cholesterol in obese postmenopausal women,14 and body fat mass in Portuguese children.15 It is notable that most of the studies mentioned above were based on the traditional population association approach. In this study, we did not find significant association for SNP3 or SNP4, nor did we find significant association for haplotypes defined by them. Compared with other association studies, ours is more powerful considering the large sample size and the robust analytical approach we adopted. Apart from SNP3 and SNP4, two additional SNPs, SNP1 and SNP2, were investigated, both individually and for haplotypes defined by all of the four SNPs. Within family associations were found for SNP1 with PFM, haplotype CGTC with both PFM and lean mass. A plausible explanation lies in the fact that SNP1, which is located in the first exon (5′ untranslated region), may influence the APOE gene transcription or translation and thus may have potential effects on the gene function.51 The within family associations obtained in this study were confirmed in subsequent permutations. However, for the haplotype GGTC, after permutation, the significance of association with lean mass decreased with the p value increased from 0.001 to 0.016. Therefore, whether the haplotype GGTC is associated with body lean mass variation or not may await further studies. Given the strong LD among the four SNPs, we would have expected the significant association for SNP3 and SNP4 in the present study. However, this is not the case, even if the SNP3 and SNP4 are both missense mutations. There are several possible reasons for this observation. First, compared with SNP1, the minor allele frequencies of the SNP3 and SNP4 are fairly low, being 14.9% and 8.7%, respectively. This may result in a relatively low power in detecting association with underlying traits for those two markers. Second, the contributions of the alleles to the population variation are only around 1%. With the low allelic effects, it is not unexpected that a QTL might be missed in the analyses, even with the TDT, a powerful approach for testing linkage in case of association. However, the haplotypes may significantly increase the information for statistical analyses. This can be reflected in our results for haplotype analyses defined by all the four SNPs, which showed within family association with PFM and fat mass.
TGF-β1, a multifunctional cytokine that regulates cell growth, differentiation, and matrix production, has been related to many diseases.52 In a number of studies, positive associations have been observed between this gene and osteoporosis35 as well as breast cancer.53 A recent study has investigated the possible effects of the TGF-β1 gene on obesity phenotypes.18 In that study, the T29-C polymorphism in the region encoding the signal peptide sequence was genotyped in 284 unrelated non-diabetic Swedish men. Significant association was observed between the T29-C polymorphism and BMI, abdominal obesity, insulin and glucose levels. In our study, we investigated three individual SNPs, SNP5, SNP6, and SNP8, and the haplotypes reconstructed by them in the TGF-β1 gene. Within family associations were found between lean mass and SNP5, haplotype C+C and haplotype T+C. Although the exact molecular mechanism underlying the observed associations remains to be determined, the following may serve as possible clues. SNP5 was associated with the plasma concentration of TGF-β1, explaining 8.2% of the additive genetic variance of TGF-β1 concentration.54 Myostatin, a member of the TGF-β family, negatively regulates skeletal muscle development. Myostatin transgenic mice had a 17–30% increase in body weight, and extreme muscling was present.55
In this study, we did not find significant linkage to obesity phenotypes for both genes, though such linkage has been shown in other studies.19,33 There are several possible reasons for this. First, the linkage approach for complex traits is usually of limited statistical power in detecting or confirming QTLs with currently employed sample sizes.37–40 Second, the statistical power may be compromised substantially in the case of small QTL effects—that is, QTLs with small effects on underlying traits may be difficult to detect. In this study, around 1% of phenotypic variation can be attributable to the polymorphisms, which may partially explain the negative linkage results. Using the Genetic Power Calculator (available at http://statgen.iop.kcl.ac.uk/gpc), we computed the power of linkage analysis in our study sample. Assuming heritability (h2) is 0.6 for the obesity phenotypes and the proportion of the phenotypic variation due to the QTL is 1%, the power of linkage analysis is about 10%. In contrast to the relatively low power to detect linkage, the power to detect association by TDT in our study sample is about 80%.
In summary, we have examined the association or linkage using SNPs and haplotypes within the genes of APOE and TGF-β1 in a large sample of white population. Our data provide the evidence of positive associations between the APOE and TGF-β1 genes and obesity phenotype variation, suggesting their possible effects on obesity.

Relationship between LD (D’) and physical distance fitted by a quadratic polynomial regression.
REFERENCES
Footnotes
-
The study was partially supported by grants from Health Future Foundation of the USA, grants from the National Institute of Health (K01 AR02170–01, R01 GM60402–01 A1, P01 DC01813–07), grants from the State of Nebraska Cancer and Smoking Related Disease Research Program (LB595) and the State of Nebraska Tobacco Settlement Fund (LB692), and a US Department of Energy grant (DE-FG03–00ER63000/A00).