Article Text

Statistics from Altmetric.com
- array CGH, micro-array CGH
- DOP PCR, degenerate oligonucleotide primed PCR
- FISH, fluorescence in situ hybridisation
- LETM1, a calcium channel gene
- log2 IR, log2 of the intensity ratio
- ORGC, olfactory receptor gene cluster
- WHSC1, Wolf-Hirschhorn Syndrome Candidate gene 1
- WHSC2, Wolf-Hirschhorn Syndrome Candidate gene 2
- WHSCR1, Wolf-Hirschhorn critical region 1
- WHSCR2, Wolf-Hirschhorn critical region 2
Wolf-Hirschhorn syndrome is a multiple malformation syndrome with distinct abnormal craniofacial features, prenatal onset growth retardation, failure to thrive, microcephaly, usually severe mental retardation, seizures, and congenital heart malformations. Large variations are observed in phenotypic expression of these features, with mental retardation ranging from severe to mild. There is a one third mortality in the first two years of life.
Most patients with Wolf-Hirschhorn syndrome carry 4p terminal deletions. However, the size of these deletions is variable and several phenotypic features have been tentatively mapped within the 4pter region.1–4 Further fine mapping of the different phenotypic features will ultimately lead to a functional understanding of the genes that cause these abnormal phenotypes. The minimal ‘Wolf-Hirschhorn syndrome’ phenotype was defined as the typical facial appearance, congenital hypotonia, mental retardation, growth delay, and seizures.2,4 The Wolf-Hirschhorn syndrome critical region was originally confined to a region of 165 kb and nine transcripts within this region were described.5 A patient with a small intrachromosomal 4p deletion and a partial Wolf-Hirschhorn syndrome phenotype further refined the critical region (WHSCR1).6 Two genes, the Wolf-Hirschhorn Syndrome Candidate genes 1 (WHSC1) and 2 (WHSC2), are located in the region. The expression pattern of WHSC1 colocalises spatially and temporarily with the major Wolf-Hirschhorn syndrome malformations and the gene is homologous with a Drosophila dysmorphology gene.7 WHSC2 is a nuclear protein with a helix-loop-helix motif that is ubiquitously expressed throughout development.8,9
The identification of a Wolf-Hirschhorn syndrome patient with a terminal 1.9 Mb deletion not including this Wolf-Hirschhorn syndrome critical region led Zollino et al4 to postulate a novel critical region distal to the previously defined critical region, which was termed the Wolf-Hirschhorn critical region 2 (WHSCR2). The distal boundary of this region is located within the WHSCR1 and at least one other gene LETM1, a calcium channel gene, is located within WHSCR2. The main argument to assign a novel WHSCR was the questionable presence of the Wolf-Hirschhorn syndrome facial gestalt that delineated the distal boundary of the WHSCR1.
In this report, we present six additional patients with small atypical deletions in the 4pter region, five presenting with a mild Wolf-Hirschhorn syndrome phenotype. Two of these patients had small intrachromosomal deletions and three had small terminal deletions. We defined the size of the deletion using micro-array CGH (array CGH), which enabled rapid identification of the deletion breakpoints and facilitated the genotype-phenotype correlation.
Key points
-
We present six patients with small 4p deletions covering or flanking the Wolf-Hirschhorn syndrome critical region, five of them presenting with mild phenotypical features of Wolf-Hirschhorn syndrome.
-
The sizes and breakpoints of the deletions were physically mapped by array CGH on a contiguous 4pter BAC array.
-
Two patients with small interstitial deletions allowed us to further refine the phenotypic map of the region. These analyses pinpoint hemizygosity of WHSC1 as the cause of the typical Wolf-Hirschhorn syndrome facial appearance. Our results indicate that the other key features—microcephaly, cleft palate, and mental retardation—probably result from haplo-insufficiency of more than one gene in the region and are thus true contiguous gene syndrome phenotypes.
-
The breakpoints in the three terminal deletions identified in this study coincide with gaps in the current human genome draft sequence. We demonstrate that one of these gaps contains an olfactory receptor gene cluster, suggesting that low copy repeats not only mediate ectopic meiotic recombinations but are also susceptibility sites for terminal deletions.
MATERIALS AND METHODS
Clinical examination
Personal and family history was obtained from all patients. The patients were all clinically examined. Some patients were monitored over several years and follow up data were recorded.
Cytogenetic analysis
Karyotyping was performed on metaphase spreads prepared from peripheral blood lymphocytes by conventional methods.
Arrays
Construction of micro-arrays
A high resolution chromosome 4p16 array was constructed using degenerate oligonucleotide primed PCR products from 56 BAC clones, covering the 5 Mb subtelomeric region with all clones represented in the November 2002 release of the Golden Path and a subsequent 5–20 Mb region with an average spacing of one clone per 600 kb. The identities of the 26 most telomeric 4 Mb clones used in the array are represented in fig 1. Between 4 and 20 Mb, 10 clones derived from the 1 Mb clone set from the Wellcome Trust Sanger are present10. Additional clones were obtained from CHORI (Oakland, CA), RP11 derived BACs 265B16, 323F5, 274B16, 544B5, 69D13, 586D19, 1406H17, 29H20, 367J11, 565I3, 1156I21, 117J13, 1258F18, 637J21, 264E23, 665G4, 576E20, 3J1, 84N19, and 408C24. In addition, the array contained 10 clones derived from the X chromosome and 12 clones derived from different autosomes.

Genotypes and phenotypes of the patients analysed in this study. The top part shows the clones represented on the array from the telomeric 4 Mb together with the DNA contig representation of Ensembl (01/2004). Clones in italics are not represented in the Golden Path sequence. The Wolf-Hirschhorn critical regions WHSCR1 and WHSCR2 are indicated with the lines under the Ensembl contig representation. The bottom shows a summary of the genotypes of all the patients analysed in this study. The lines indicate the sizes of the 4p deletions. On the right, the main phenotypic features discussed in the text are presented.
BAC DNA clones were isolated from 1 ml bacterial culture using Millipore genomic DNA purification kit following the manufacturer’s instructions (Millipore, Billerica, MA). BAC DNA obtained after purification was reconstituted in storage buffer supplied by the manufacturer. The BAC DNA was amplified by degenerate oligo nucleotide primed PCR (DOP PCR).10 Total DOP PCR product was reconstituted in 20 μl of 80% DMSO solution containing nitrocellulose (0.37 μg/ml) at an average concentration of 250 ng/μl. The products were arrayed on type VII star silane coated slides (Amersham Pharmacia Biotech, Bucks, UK) using a Molecular Dynamics Generation III printer (Amersham Pharmacia Biotech, Piscataway, NJ). The clones were printed in six replicates. Before hybridisation, the slides were humidified and dried and target DNA was cross linked using UV-Stratalinker at 50 mJ (Stratagene, Amsterdam, The Netherlands).
Probe preparation
Genomic DNA was extracted from lymphocytes with the Qiagen DNA extraction kit (Qiagen NV, Venlo, The Netherlands) followed by a phenol and chloroform extraction. Test and reference DNA was labelled by a random prime labelling method modified in our laboratory (Bioprime DNA Labelling System, Invitrogen, Carlsbad, CA) using Cy3/Cy5-dCTP (Amersham Pharmacia Biotech). Six hundred nanograms of DNA were mixed with random primer solution supplied by the manufacturer and heat denatured for 10 min at 100°C. Subsequently, the mixture was incubated overnight with 0.2 mM dATP, 0.2 mM dGTP, 0.2 mM dTTP, 0.05 mM dCTP, 0.04 mM Cy3-dCTP, or Cy5-dCTP and 80 U Klenow fragment at 37°C. The probes were then purified by Qiaquick columns (Qiagen). The labelled DNA was mixed with 200 μg Human Cot-1 DNA (Roche) and 400 μg yeast tRNA (Invitrogen) and precipitated with ethanol. The precipitated DNA was reconstituted in 5.4 μl 20% SDS, 6.6 μl water, 28 μl master hybridisation mix (70% formamide, 2.8×SSC, 7% dextran sulphate), and denatured at 70°C for 15 min, followed immediately by incubation at 37°C for 60 min to block repetitive DNA sequences.
Pretreatment of the slides
Before hybridisation, slides were humidified, air dried, and UV cross linked with 50 mJ. Prehybridisation was done for 10 min in BSA blocking solution (3.5×SSC, 0.2% SDS, 1% BSA) at 60°C. Slides were rinsed in water and air dried by centrifugation.
Hybridisation
The probe was placed on the slide under a glass cover slip (24×50 mm) and sealed with rubber cement. The slides were incubated for 40 hours at 37°C under humidified conditions. Post hybridisation washing was performed once with 50% formamide 2×SSC at 45°C for 15 min, twice in 0.1 M sodium phosphate with 0.1% NP40, pH 8.0 at room temperature for 10 min, once in PBS and once in water. The slides were dried by centrifugation for 1 min at 1000 rpm.
Scanning
Arrays were scanned at 532 nm and 635 nm using Generation III scanner (Amersham Pharmacia Biotech). Images were analysed using Array Vision (Imaging Research Inc, St Catharines, Ontario, Canada). Spot intensities were background corrected.
Calculations
For each clone, the average ratio and standard deviation was calculated over six replicas. The fluorescence intensities measured were first background subtracted. Background values were obtained by the averaging four loci surrounding each spot (Arrayvision). Consistent BAC/PAC clones, for which standard deviation was larger than 20%, were excluded from data analysis. Normalisation was determined based on mean values of the clone set mapping 5.08 Mb to 20 Mb from the telomere. Clones with a log2 ratio between 0.2 and −0.2 were expected to be normally present, whereas clones with a log2 ratio below −0.2 were assumed to be deleted in the patient samples. This assumption was based on previous experiments where copy number differences were measured using DNA from cell lines with respective karyotypes 46,XX, 47,XXX, and 46,XY. In each experiment, female DNA was hybridised against male DNA such that the intensity ratios of the X derived spots functioned as internal controls determining the quality of the hybridisation. Normal to normal hybridisations were initially performed to filter out clones with non-specific behaviour and to validate the location of the 4p clones. For example, the log2 of the intensity ratios for two clones within the deletion region was reproducibly zero in all deletion patients (purported clones 869J1 and 193G15). On fluorescence in situ hybridisation (FISH) analysis these clones were shown to be located elsewhere in the genome (data not shown). The chromosome 4pter copy number profile of all patients as seen in fig 2 was established by averaging the normalised intensity ratio of the hybridisation of Cy3 labelled patient derived DNA combined with Cy5 labelled control derived DNA and the inverse normalised intensity ratios of the dye swap experiments.

Results of the array CGH analysis of patients 1–4. The y axis represents the log2 of the intensity ratios of the combined dye swap experiments of patient/control DNA. In the x axis the distance from the 4p telomere of the BAC clones is indicated. The arrows indicate the location of the breakpoints and the clones flanking the breakpoints used to FISH verify the array data are represented.
Fluorescence in situ hybridisation analysis
A commercial Wolf-Hirschhorn syndrome probe was used following the manufacturer’s instructions (Vysis, Abbott laboratories, IL). Subtelomeric screening was performed using the second generation subtelomeric clones described by Knight et al.11 DOP PCR products were labelled by the nick translation system using a slightly modified labelling protocol (Invitrogen). One microgram of BAC/PAC DNA was mixed with 10×buffer (0.2 mM dCTP, 0.2 mM dGTP, 0.2 mM dATP, 0.1 mM dTTP), 0.5 mM dUTP spectrum orange and 5 μl enzyme mix (Bio-Nick Translation kit, Invitrogen). The reaction was maintained at 16°C for one hour. Unincorporated nucleotides were removed with the Qiaquick Nucleotide removal kit. Fluorescence in situ hybridisation was performed as described.12
Long range PCR
Long range PCR was performed with the Elongase Enzyme Mix (Invitrogen). The primer pair was designed from the genomic contig AL1328658. The primer pair amplifies 10274 nt, which encompasses intron 1–5 of the WHSC1 coding sequence: forward 5′ AGTAGTGCAATCATAGCTCACTGC and reverse 5′ TCCCACAATAATTCCTAGAGAAGC. PCR was performed following the manufacturer’s instructions. PCR conditions were: 94°C for 30 s followed by 30 cycles of 30 s at 94°C, 30 s at 58°C, and 8 min 25 s at 68°C. Ten nanograms of clone 262P20 were used as a template.
Molecular analysis
CA repeats spaced along the short arm of chromosome 4 were amplified by PCR, using fluorescein isothiocyanate labels on one of the primers. The fragments were separated on an ALF DNA sequencer (Amersham Pharmacia Biotech) and sized using Allelinks software. Primer sequences were as published.13
RESULTS
Clinical reports and cytogenetic analysis
Patient 1
The female patient was the second child of healthy non-consanguineous parents. Her sibling was healthy. Intra-uterine growth retardation was noted during pregnancy. She was born at 42 weeks of gestation. Her birth weight was 1900 g, length was 45 cm, and head circumference was 30 cm. She had a left sided diaphragmatic hernia, which was surgically repaired on the first day of life, pulmonary stenosis, and a cleft palate. At the age of 1 year, clinical suspicion of Wolf-Hirschhorn syndrome was confirmed by prometaphase studies. Because all growth parameters were below the third centile, growth hormone therapy was started at the age of 4 years for two years. Extremities were thin and there was acrocyanosis. At the age of 8 years 8 months, she had microcephaly (occipital frontal circumference was 46.5 cm (below the third centile)), a dysmorphic face, and an ectomorphic habitus. There were dimples on the elbows and presacral region. Her voice was fine and she could speak words. At the age of 11 she was still microcephalic, had a broad nose and crowding of the teeth (fig 3A). When she started puberty, hormone therapy was restarted.

Clinical phenotypes of: (A) patient 1 at the age of 2 (top) and 6 years (bottom), (B) patient 3, and (C) patient 4. (Photographs reproduced with parents’ permission)
Cytogenetic investigation showed a small 4p terminal deletion with karyotype 46,XX, del(4)(p16.3). A deletion of the Wolf-Hirschhorn critical region was confirmed using a commercial Wolf-Hirschhorn syndrome FISH probe.
Patient 2
This child was the first child of healthy non-consanguineous parents. Prenatally there was growth retardation. She was born at 37 weeks of gestation. Her weight was 2050 g, length was 44 cm, and head circumference was 29 cm; these parameters were all below the third centile. Postnatal growth retardation was present. At the age of 11 months, Wolf-Hirschhorn syndrome was suspected but chromosomal studies were normal 46,XX. At the age of 16 months she developed seizures and she was treated with valproate. At the age of 13 years and 4 months all parameters were below the third centile. There was proptosis. She had dimples on the presacral region and shoulders.
Clinical diagnosis of the Wolf-Hirschhorn syndrome was confirmed by the detection of a signal on only a single chromosome 4 using a commercial Wolf-Hirschhorn syndrome FISH probe.
Patient 3
The patient was the first child of healthy unrelated parents. Family history was uncomplicated. During pregnancy there was intra-uterine growth retardation. He was born at 38 weeks pregnancy. His birth weight was 2330 g and length was 44 cm. He could sit at the age of 14 months. At that age, his length was between the 10th and 25th centiles but his weight and occipital frontal circumference were below the third centile. Brain magnetic resonance imaging showed delayed myelinisation. Examination at the age of 2 years 7 months showed a height between the 50th and 75th centile, weight between the third and 25th centiles but occipital frontal circumference of 46.5 cm (<3rd centile). He had thin scalp hair, a small forehead, low set ears, and a high nasal bridge. There were dimples on the elbows and over the sacro-iliac joints and there was a presacral sinus. He had glandular hypospadias. Cognitive functioning was at 20 months (on the Bayley scales). At the age of 5 years 7 months, his facial features were changing and a clinical diagnosis of Wolf-Hirschhorn syndrome was suspected and confirmed by molecular cytogenetics. Cardiac ultrasound was normal. At the age of 8 years 6 months, his occipital frontal circumference was at the third centile. He was tall and had slender extremities and hyperkyphosis (fig 3B). He had a short sternum but there were no internal malformations. His hoarse voice was high pitched. Cognitive functioning included a total IQ of 68, a verbal IQ of 80, and a performance IQ of 65 (revised Wechsler Intelligence Scale for Children). There was limited social contact because of his extreme shyness.
The G-banded karyotype of this patient was normal 46,XY. Clinical diagnosis of the Wolf-Hirschhorn syndrome was confirmed by the detection of a signal on only a single chromosome 4 using a commercial Wolf-Hirschhorn syndrome FISH probe.
Patient 4
This boy was 11 years 8 months old. His birth weight was 3250 g, length was 50 cm, and occipital frontal circumference was 36.2 cm. There was postnatal growth retardation. The G-banded karyotype was normal 46,XY. At the age of 9 months, his mental level corresponded to 5 or 6 months and at the age of 18 months his mental level was 15 months (Bayley Developmental scales). At 12 months, his weight and length were below the third centile. Craniofacial features included a small mouth and chin, almond shaped eyes, a short philtrum, and a hooked nose. His hands and feet were small. At the age of 2 years, clinical examination showed a high pitched voice, mild velopharyngeal incompetence, and presacral and sacro-iliac dimples. At 3 years 5 months of age, his growth parameters were all on the 50th centile. Brushfield spots were noted on the iris. He had nasal speech. He had surgery for a left inguinal hernia. There was no subcutaneous fat. At 9 years, his length was on the third centile, his weight was between the 25th and 50th centiles and his occipital frontal circumference was on the 25th centile. His speech was well developed but his voice remained high pitched. There was hyperkyphosis, and because of his changing facial features, Wolf-Hirschhorn syndrome was suspected and confirmed by molecular cytogenetics (fig 3C). He attended a special school for the mildly mentally retarded. Cognitive functioning showed a total IQ of 67, a verbal IQ of 70, and a performance IQ of 67 (revised Wechsler Intelligence Scale for Children). He was extremely shy.
Patient 5
The clinical report of this patient has been described before.14 At birth, severe failure to thrive with poor sucking was evident. She was severely retarded and had recurrent generalised epileptic seizures from the age of one year. She presented with distinct craniofacial Wolf-Hirschhorn syndrome dysmorphism with a Greek helmet profile. The G-banded karyotype of this patient was analysed as normal 46,XX and only after FISH studies was the suspected 4p16.3 deletion confirmed. FISH studies in the mother showed that she was a carrier of a balanced/unbalanced mosaicism with a 4p/16p translocation in 60% of the cells and 4p16.3 deletion in 40% of the cells.
Patient 6
This clinically normal patient was further investigated because of multiple miscarriages. The G-banded karyotype was normal, 46,XX. Subsequently, a subtelomeric screen was performed to search for cryptic translocations as a possible cause for the multiple miscarriages. This screen revealed a deletion of the 4pter region. Analysis of the chromosomes of her parents revealed the presence of the same terminal cryptic deletion in the mother. The father’s chromosomes were normal.
Array CGH
In all six patients, copy number losses involving part of the p arm were identified (fig 2; for overview of the results see fig 1). Four terminal deletions (patients 1, 2, 5, and 6) and two interstitial deletions (patients 3 and 4) were detected. The largest terminal deletions were 3.45 Mb (BAC 529E10) and 3.81 Mb (BAC 489M13) in length, respectively and the smaller terminal deletions were maximally 2.13 Mb (BAC 503N8) and 0.4 Mb (BAC 1263C18). The sizes of the interstitial deletions cover 1.55 Mb (between BAC 20I20 (1.09 Mb) and PAC 474M20 (2.64 Mb)) and 1.7 Mb (between clone BAC 1197E19 (1.77 Mb) and BAC 529E10 (3.45 Mb)).
Characterisation of the breakpoints
Since the array contained an almost contiguous tiling path of clones, intermediate Cy3/Cy5 ratios were measured at the breakpoint spanning clones (see fig 2, patients 3 and 4). This was confirmed by FISH analysis using BACs spanning the purported breakpoints defined by the array CGH analysis. For patient 2, the log2 of the intensity ratio (log2 IR) at the spot of BAC 503N18 (2.31 Mb) was intermediate between deleted and normal. FISH using this BAC 503N18 and the flanking BAC 478C1 as a probe did confirm that 478C1 is deleted and 503N18 is present in this patient, suggesting that the breakpoint is located within BAC 503N18. Similarly, in patients 3 and 4, intermediate log2 IR values were observed in the BACs spanning the purported breakpoints (fig 2). In patient 3, the array data suggested the proximal breakpoint to be between 474M20 and 478A6. BACs 478A6 and 448F2, with log2 IR values of −0.22 and −0.33, showed FISH signals on both chromosomes 4 in all and half of the metaphases analysed, respectively, confirming that these BACs span the deletion breakpoint. For patient 4, FISH with BAC 1197E19 (1.77 Mb) and BAC 262P20 (1.84 Mb) flanking the distal candidate breakpoint, and BAC 357G3 (3.17 Mb) and BAC 529E10 (3.29 Mb) at the proximal candidate breakpoint confirmed that 1197E19 and 529E10 were still present while BACs 262P20 and 357G3 were deleted in the patient. To refine the localisation of the distal breakpoint, approximately 10 kb fragments covering the 5′ end of WHSC1 were generated by long range PCR, fluorescently labelled and hybridised on metaphases of this patient. The WHSC1 probe is deleted suggesting that the break occurs between WHSC1 and LETM1 (localised in BAC 1197E19).
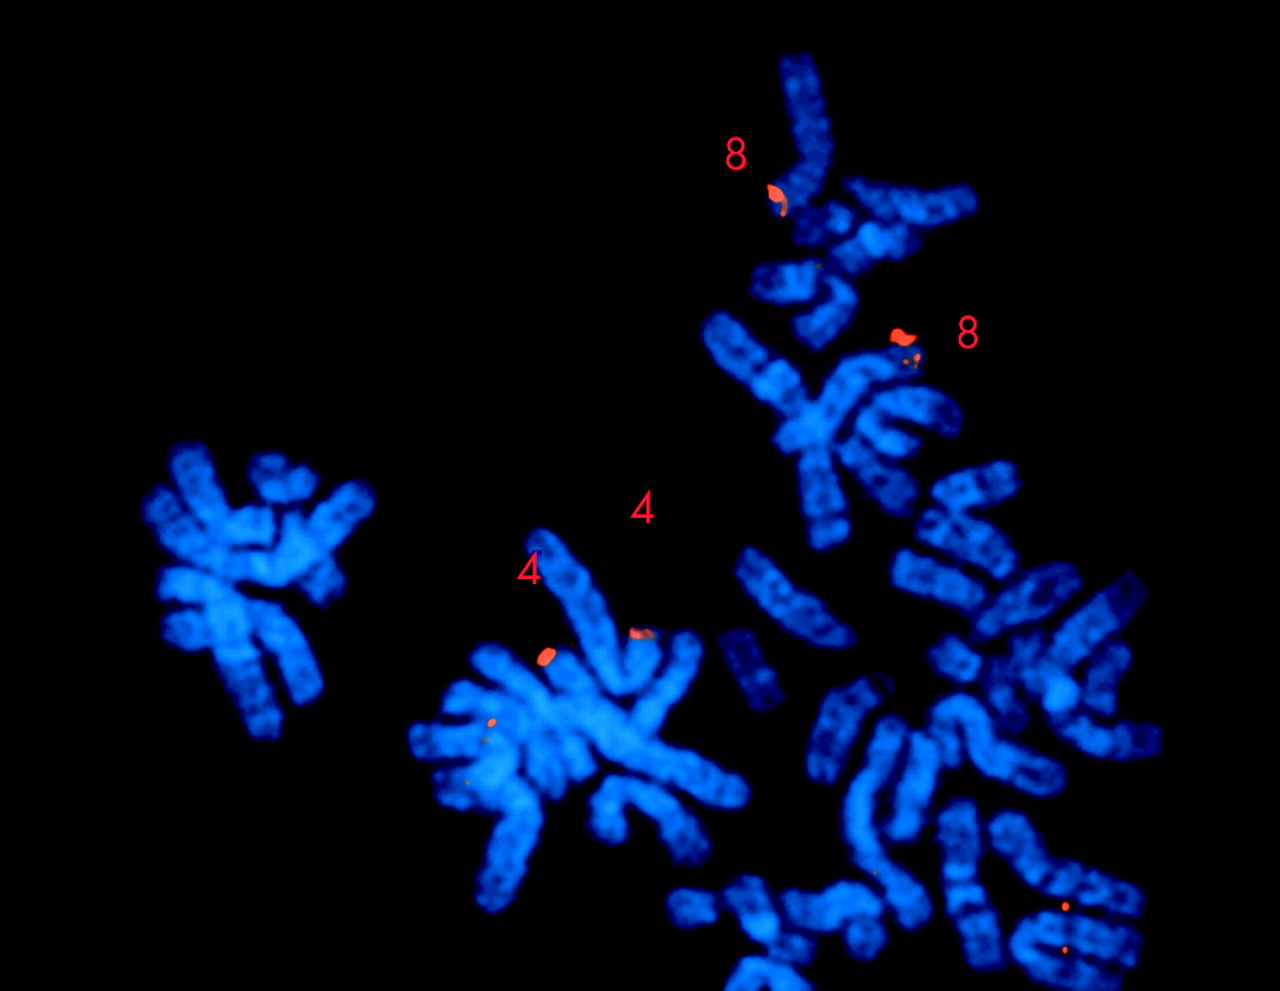
However, for four out of eight breakpoints no intermediate signals were observed. These locations represented gaps in the current human genome draft sequence and hence also gaps in the tiling path represented on the array (fig 1). FISH using the flanking BACs confirmed the array results. Interestingly, for the breakpoints in the two patients with terminal deletions, patients 1 and 5, the flanking clone (BAC 513G18 and 489M13) was shown to contain an olfactory receptor low copy repeat sequence (fig 4).

FISH analysis with BAC 489M13 (red signal), indicating that the terminal deletion breakpoint is located within or flanking the olfactory receptor gene cluster.
Since the olfactory receptor gene cluster (ORGC) was recently shown to mediate ectopic recombination between chromosome 4p and 8p ORGC causing the recurrent translocation t(4;8),15 we wondered whether the apparent terminal deletion of patient 1 could actually be a cryptic unbalanced translocation. To exclude the presence of a cryptic balanced translocation t(4;8) in one of the parents of patient 1, FISH was performed on chromosomes of both parents using the 4p and 8p subtelomeric probes. No such translocation was detected. To exclude the occurrence of a cryptic translocation of the 4p ORGC with another chromosome, we performed a subtelomeric screen on patient 1 by consecutively hybridising probes for all subtelomeres and a cryptic unbalanced translocation was excluded.11
To investigate whether low copy repeat sequences or segmental duplications on chromosome 4p could be involved in generating the interstitial chromosomal deletions, a chromosomal analysis was performed using GenAlyzer program (an improved version of Reputer software), performed according to the authors’ instructions16 (www.genomes.de) on a masked sequence, downloaded from the UCSC FTP site. The sequences contained in BACs flanking or containing the deletion breakpoints in patients 3 and 4, clones 20I20, 386I15, 1197E19, 262P20, 478C1, 357G3, and 529E10, were screened. No segmental duplications were detected.
The parental origin of four deletions
DNA polymorphism studies were performed to determine the origin of the deletions. The analysis was carried out on the DNA of each patient and both parents. The results of the marker analysis are shown in table 1.
Results of the polymorphic marker analysis
The terminal deletion in patient two is of maternal origin. The terminal deletions in patient one and both interstitial deletion carriers, patients 3 and 4, are of paternal origin.
DISCUSSION
Based on the analysis of patients with variable sizes of terminal 4p deletions, several clinical features have been tentatively mapped.1,2,4 So far, only a few Wolf-Hirschhorn syndrome patients with interstitial chromosome deletions have been described and these were instrumental in delineating the Wolf-Hirschhorn syndrome critical region.5,6,17 Here, we present two more patients with small interstitial deletions and a very mild Wolf-Hirschhorn syndrome phenotype, three patients with small terminal deletions and a mild Wolf-Hirschhorn syndrome phenotype, and a patient without the Wolf-Hirschhorn syndrome hallmarks with a small terminal deletion. The five Wolf-Hirschhorn syndrome patients all presented with rather mild features, which became more pronounced with advancing age. Characteristic features included mild to moderate mental retardation, specific communication skills, shyness, sacral and shoulder dimples, small fragile habitus, thin extremities, high pitched voice, and kyphosis. The proposed minimal criteria for Wolf-Hirschhorn syndrome were the typical facial appearance, congenital hypotonia, mental retardation, growth delay, and seizures.4 However, none of the present patients had congenital hypotonia, the two patients with interstitial deletions did not present with milder postnatal growth delay and had a milder mental retardation and three patients had no seizures despite the deletion of both Wolf-Hirschhorn candidate critical regions, WHSCR1 and WHSCR2. Therefore, rather than a well delineated entity, mild Wolf-Hirschhorn syndrome encompasses a spectrum of phenotypes having in common the typical facial gestalt and mild to moderate mental retardation. In addition, the behavioural features can be helpful for making the diagnosis.
The main reason for assigning the WHSCR2 was the ambiguous clinical assignment of the Wolf-Hirschhorn syndrome facial dysmorphism in the patients delineating the WHSCR1. Here we describe another patient harbouring a small interstitial deletion with one deletion boundary between WHSC1 and LETM1. The deletion overlaps with the WHSCR2, but only for the 3′ end of the WHSC1 gene. This patient has the typical Wolf-Hirschhorn syndrome facial phenotype. Therefore, since a (partial) deletion of WHSC1 is the only common deletion in all patients with the clinical Wolf-Hirschhorn syndrome phenotype, this observation may be considered as further evidence that WHSC1 hemizygosity is essential in the development of the typical facial appearance.
Microcephaly is present in 26/26 (100%) of Wolf-Hirschhorn syndrome patients with terminal deletions extending to 2.2 Mb.3,4 Since two Wolf-Hirschhorn syndrome patients without microcephaly had terminal deletions smaller than 2.2 Mb, hemizygosity for genes within the 2.2–2.5 Mb interval was believed to cause microcephaly.3 However, our patient 4, with an interstitial deletion encompassing the region between 2.2 and 2.5 Mb, had no microcephaly. While this observation could be explained by variable phenotypic expression, the 100% association of microcephaly in Wolf-Hirschhorn syndrome patients with terminal deletions larger than 2.2 Mb makes us believe that microcephaly in the regular Wolf-Hirschhorn syndrome patients is caused by haplo-insufficiency of at least two different 4p regions. These regions may be delineated by the region 2.2–2.38 Mb, the region identified previously, and a second region from 1.9–1.28 Mb. More patients with interstitial deletions need to be analysed to confirm this hypothesis. In addition, we present a second patient, patient 2, with a terminal deletion of approximately 2.2 Mb and microcephaly. It will be interesting to compare the exact breakpoints of this patient with the patients described by Zollino et al,4 who have no microcephaly. This may narrow the region harbouring genes involved in brain development.
Seizures, occurring in 26/27 Wolf-Hirschhorn syndrome patients, were suggested to be caused by haplo-insufficiency for LETM1, a calcium channel gene located at 1.77 Mb.4 The assignment of a second Wolf-Hirschhorn critical region was partly based on the observation that the patients reported with interstitial deletions5,6 had no seizures and hence did not fully comply with the Wolf-Hirschhorn syndrome phenotype. Patient 4 supports this hypothesis since he has no seizures and LETM1 is not deleted. In contrast, two patients (patients 1 and 3) had deletions of LETM1 without seizures. This observation probably indicates that hemizygosity for LETM1 leads to a variable phenotype in Wolf-Hirschhorn syndrome patients.
Both patients with interstitial deletions had no or only marginal growth retardation. Equally, the patient described by Rauch et al6 did not present with growth retardation. All Wolf-Hirschhorn syndrome patients with terminal deletions described so far have growth retardation. These data suggest that growth retardation can be mapped to a region between 0.4 Mb and 1.3 Mb, the distal breakpoint of patient 3 or is, just like microcephaly, a true contiguous gene syndrome phenotype.
One patient with a 4pter deletion but without any physical anomalies was diagnosed by subtelomeric screening because of recurrent miscarriages. The 4p deletion covered about 0.4 Mb. This region can therefore be excluded as harbouring genes causing the major anomalies commonly observed in Wolf-Hirschhorn syndrome phenotype patients. Interestingly, no patients with terminal deletions smaller than 1.9 Mb have been described so far. Probably, this is due to a lack of specific symptoms and to the fact that Wolf-Hirschhorn syndrome patients are accurately identified based on the typical facial appearance. It is probable that patients with haplo-insufficiency of this region do exist and that they may have mild forms of mental retardation. Genomic screening using array CGH10 could be a powerful tool in discovering such rearrangements. Another possibility is that 4p terminal deletions are induced by sequence specific secondary structures, which may not be present in the region between 0.3 and 1.9 Mb.
Four out of eight breakpoint sites appear to colocalise with gaps in the current genome draft sequence (Ensembl, October 2003 (www.ensembl.org)). At least part of the gaps in the current human sequence draft are thought to contain low copy repeats.18 Low copy repeats are paralogous sites in the genome, and therefore sequencing efforts and other mapping strategies are unable to identify unequivocally the location of certain clones. These low copy repeats appear to be susceptibility factors for ectopic meiotic recombination. Several genomic disorders are caused by intrachromosomal ectopic meiotic recombinations (for review see Lupski and Tsue19 and Devriendt and Vermeesch20). At this 4pter region, at least one of these gaps colocalises with an olfactory receptor gene cluster (ORGC).15 The breakpoints of two terminal deletions (patients 1 and 5) coincide or flank this ORGC. We show that a BAC flanking the breakpoint contains the ORGC. This specific ORGC was shown to be the cause of the recurrent t(4,8).15 To exclude the possibility that the apparent terminal deletion in our case could actually be due to a cryptic translocation, a subtelomeric screening was performed. This screen failed to detect the presence of another subtelomere and therefore excludes the possibility that these terminal deletions are actually cryptic unbalanced translocations. Ectopic recombination at the ORGC is also the main cause for 8pter rearrangements such as the inv dup(8p), the del(8p) and the interstitial deletion 8p23.21–23 Our findings suggests that the ORGC may not only be a susceptibility factor for ectopic translocations but also for causing terminal deletions. Further mapping of the other breakpoints is ongoing to determine the sequences present at these sites.
Genotype-phenotype correlations have regularly been performed by FISH or molecular analysis. The power of array CGH in genotype-phenotype correlations was demonstrated previously by the analysis on a series of patients with 18q terminal deletions and 1p terminal deletions.24,25 This study is the second to use a contiguous BAC tiling path to delineate the breakpoints in patients with a deletion in a chromosomal region and the first to generate such a high resolution genotype-phenotype correlation. We show that the technique is not only able to identify the size of chromosomal anomalies rapidly but also to pinpoint the BAC clones spanning the breakpoints. These observations make array CGH an excellent tool in the analysis of constitutional chromosomal anomalies.
Acknowledgments
We thank the Mapping Core and Map Finishing groups of the Wellcome Trust Sanger Institute for supplying most of the BAC clones used in this study. We thank Dr M Rocchi for the GenAlyzer analysis in the search for low copy repeats in the breakpoint spanning clones. We thank Dr F Speleman and Dr S Vermeulen for the collaborative effort in developing array CGH.
REFERENCES
Footnotes
-
↵* These two authors contributed equally to this work.
-
This work has been made possible by FWO (grant G.0200.03) and Bijzonder Onderzoeksfonds KU Leuven (BOF) (grant OT/02/40). KD is a senior clinical investigator of the FWO Vlaanderen.
-
Conflicts of interest: none declared.