Article Text

Abstract
Background: Uniparental disomy (UPD), the inheritance of both copies of a chromosome from a single parent, has been identified as the cause for congenital disorders such as Silver-Russell, Prader-Willi, and Angelman syndromes. Detection of UPD has largely been performed through labour intensive screening of DNA from patients and their parents, using microsatellite markers.
Methods: We applied high density single nucleotide polymorphism (SNP) microarrays to diagnose whole chromosome and segmental UPD and to study the occurrence of continuous or interspersed heterodisomic and isodisomic regions in six patients with Silver-Russell syndrome patients who had maternal UPD for chromosome 7 (matUPD7).
Results: We have devised a new high precision and high-throughput computational method to confirm UPD and to localise segments where transitions of UPD status occur. Our method reliably confirmed and mapped the matUPD7 regions in all patients in our study.
Conclusion: Our results suggest that high density SNP arrays can be reliably used for rapid and efficient diagnosis of both segmental and whole chromosome UPD across the entire genome.
- HMA10K, human mapping 10K array
- SNP, single nucleotide polymorphism
- SRS, Silver-Russell syndrome
- UPD, uniparental disomy
- UPD
- SNP
- genome-wide
- meiosis
- Silver-Russell syndrome
Statistics from Altmetric.com
- HMA10K, human mapping 10K array
- SNP, single nucleotide polymorphism
- SRS, Silver-Russell syndrome
- UPD, uniparental disomy
Uniparental disomy (UPD) occurs when a child receives both copies of a particular chromosome (or part of a chromosome) from only one parent, thus distorting the fundamental concept of biparental inheritance.1 UPD may involve two copies of the same chromosome (isodisomy) or one copy of the contributing parent’s pair of chromosomes (heterodisomy). Meiotic recombination events can result in a mixed UPD with interspersed regions of heterodisomy and isodisomy along the chromosome. UPD can result from the fertilisation of aneuploid gametes, with either gametic complementation or trisomic rescue as the mechanism. A non-disjunction event occurring during meiosis I or II is likely to be the original error in these instances. In addition, somatic events such as mitotic recombination (causing segmental UPDs) or duplication of a viable chromosome to compensate for an inherited dysfunctional chromosome can also result in UPD.2,3 Imprinting is defined as the bias in the expression of certain genes depending on the parent of origin, and is generally associated with parent specific methylation patterns of DNA established in the germline.4 If imprinted genes reside on the UPD chromosome, distortion of their expression patterns will occur and may cause specific phenotypes or syndromes,3 as is the case with patUPD11 and Beckwith-Wiedemann syndrome (MIM #130650), matUPD15 and Prader-Willi syndrome (MIM #176270), and patUPD15 and Angelman syndrome (MIM #105830).5,6 Furthermore, recessive, normally non-penetrant alleles in isodisomic regions may cause recessive diseases.7
Maternal UPD of chromosome 7 (matUPD7) is found in around 10% of patients with Silver-Russell syndrome (SRS; MIM #180860), suggesting that imprinted genes play a role in its aetiology.8 SRS is a congenital syndrome manifested by intrauterine and postnatal growth retardation and typical dysmorphic features.8 A segmental matUPD reported for 7q31-qter and cytogenetic abnormalities for the 7p11-p14 region found in SRS patients delineate two potential regions for imprinted candidate genes for SRS.9,10 A recessive allele explaining the association between matUPD7 and SRS is unlikely, as a common isodisomic region in matUPD7s has not been found.11
Detection of UPD has largely been performed through labour intensive screening with microsatellite markers of DNA from patients and their parents.12 Other means of identifying UPD are methylation specific PCR or bisulphite sequencing of known imprinted genes on the chromosome of interest.13,14 In this study, we set out to explore the new generation of hybridisation based single nucleotide polymorphism (SNP) genotyping methods, such as the Affymetrix GeneChip human mapping 10K array (HMA10K), as a simple tool for studying UPD.15 We present statistical means for diagnosing UPD, including a new multipoint mapping method that can be used to identify isodisomic and heterodisomic regions on the autosomal chromosomes of the genome. The regions are identified by calculating binomial probabilities with 95% confidence intervals (CI) against genomic background, under the assumption that only parts of the genotyped regions are affected by UPD. We specifically studied previously diagnosed SRS patients with matUPD7 and one patient with suspected matUPD7, and found that segments of isodisomy and heterodisomy can be mapped with great precision and certainty. We also provide further evidence for the involvement of imprinted genes in the SRS phenotype of matUPD7 patients.
MATERIALS AND METHODS
Study subjects
Patients and/or parents provided written informed consent, after which blood samples were obtained. The study was approved by the ethics review board of the Hospital for Children and Adolescents, University of Helsinki, Finland.
Six parent–offspring trios were included in the study, of which five had previously been reported to have matUPD7 and one was a suspected case based on analysis of 12 chromosome 7 microsatellite markers, which had shown paternal alleles missing for eight markers (patient designated matUPD7 VII) (table 1).9,16 This patient was born after induced labour for intrauterine growth retardation at 34 gestational weeks to a 30 year old mother and 31 year old father of average height. Her birth length was 39 cm (−3.7 SD) and weight 1425 g (−3.1 SD). During the pregnancy, slightly elevated alpha fetoprotein levels were followed up by amniocentesis, which gave a normal female karyotype. Otherwise, the pregnancy was uneventful. The child has two siblings with normal growth and development.
Patients included in the study and the intervals of recombination on chromosome 7
At 4 months of age, the patient was suspected to have SRS because of her severe growth retardation (−5.2 SD) and typical dysmorphic features, including leanness (weight in proportion to height −16%), relative macrocephaly (head circumference −2 SD), prominent ears, a large fontanelle, and clinodactyly. As she grew older, she continued to show slight dysmorphic SRS-like features, and similar speech and feeding difficulties to the other matUPD7 patients in this study.9,16 In addition, she had delayed bone age and lumbar scoliosis, but did not show classical SRS features such as asymmetry or hemihypertrophy, a triangular face, micrognathia, or downturned mouth corners. Her motor and neuropsychological development was slightly delayed and she had premature puberty at 9 years of age. She has normal growth hormone and thyroid functions. Her height proceeded at −5 SD throughout her childhood and at her last evaluation at 12 years of age, her height was −3.0 SD.
Genotyping
We used the Affymetrix Mapping10K_Xba142 assay, which enables the simultaneous genotyping of over 10,000 SNPs using only 250 ng of genomic DNA (Affymetrix Inc., Santa Clara, CA, USA).15 The genotyping was carried out according to the GeneChip mapping 10K assay protocol, using the column cleanup option, available on the Affymetrix website (www.affymetrix.com). The chips were scanned with the GeneChip Scanner 3000 (Affymetrix Inc.) and genotypes were analysed using GDAS software version 3.0 (Affymetrix Inc.).
Data analysis
The genotype calls for the matUPD7 trios were analysed with PedCheck 1.1 to identify inconsistencies of mendelian inheritance.17 A strategy to explore regions of isodisomy and heterodisomy on the autosomal chromosomes of the genome was applied to all parent offspring trios. Isodisomy was defined as long stretches of homozygous genotypes gi, and heterodisomy was defined as long stretches of identical genotypes gh between child and parent. Only markers with a successful genotype for all individuals of the trio were included in the analysis. In our test, the trial was successful if an SNP had the genotype gh or gi with the constant genomic probabilities of success fh or fi, respectively. We required all trials in the heterodisomic and isodisomic regions to be successful and the binomial probabilities

and

could be expressed simply as fhn and fin. P values were Bonferroni corrected by dividing fhn and fin by the total number of putatively isodisomic and heterodisomic regions, respectively. The 95% confidence interval was defined by excluding c/2 SNPs from both ends of the UPD regions, where c satisfies the condition fhc<0.05|max(c) and fic<0.05|max(c), respectively (that is, a two tailed p value of <0.05). We used the statistics software R for binomial probability calculation and for the creation of the graphs.18
Power estimation
We estimated the power of our method by calculating the minimum number of SNPs for the UPD regions to be detected using HMA10K with 95% power at p = 0.05. Firstly, we calculated the minimum number of mendelian errors (e) in chromosomes without uniparental disomy, for the cumulative binomial probability of observing at least e mendelian errors to be <0.05. This was performed using the mendelian error frequency fn calculated from the number of mendelian errors in chromosomes 1–6 and 8–22 in the matUPD7 I, II, III, IV, and VII trios. Secondly, we calculated the minimum number of SNPs in the UPD regions to give rise to at least e mendelian errors with 95% probability, using the mendelian error frequency fu calculated from the number of mendelian errors in chromosome 7 in the matUPD7 I, II, III, IV, and VII trios. The minimum genetic length of the UPD regions was calculated by multiplying the minimum number of SNPs minus 1 by the average distance between the SNPs on each chromosome. As the significance of a UPD region is dependent on the number of SNPs it contains, an increased marker density is likely to improve the power of detection substantially. Therefore, the same estimation was performed for the reported average distance between the SNPs on the HMA100K array.
RESULTS
Genotyping and mendelian inheritance analysis
We genotyped 18 individuals, including three parent offspring trios of matUPD7 SRS cases with a suggested occurrence of interspersed heterodisomic and isodisomic regions (matUPD7 II, matUPD7 III, and matUPD7 IV),16 one trio with the patient having isodisomy covering the whole chromosome 7 (matUPD7 I),16 one trio with a matUPD7 case with reported segmental isodisomy for 7q31-qter,9 and one trio where matUPD7 was suspected (matUPD7 VII, unpublished) (table 1). The SNP genotype call rate and detection rate were 91.5% and 95.2%, respectively. The concordance rate of 99.9% (4 discordant genotypes out of 10204) was estimated by genotyping Affymetrix reference DNA, and comparing the generated genotype calls with the reference genotype calls downloaded from the Affymetrix website. The PedCheck analysis identified 461 mendelian errors (out of 166611 genotypes), of which 77% occurred on chromosome 7, strongly suggesting the presence of UPD. To test the significance of this finding, a p value was calculated for each patient as a cumulative binomial probability of seeing at least the observed number of mendelian errors on each autosomal chromosome by chance, under the assumption that all markers are equally likely to give rise to mendelian errors. A significant deviation from the expected number of mendelian errors with a p value <10−10 was observed on chromosome 7 for all matUPD7 I, matUPD7 II, matUPD7 III, matUPD7 IV, matUPD7 VII, and matUPD7q31-qter.
Multipoint UPD mapping
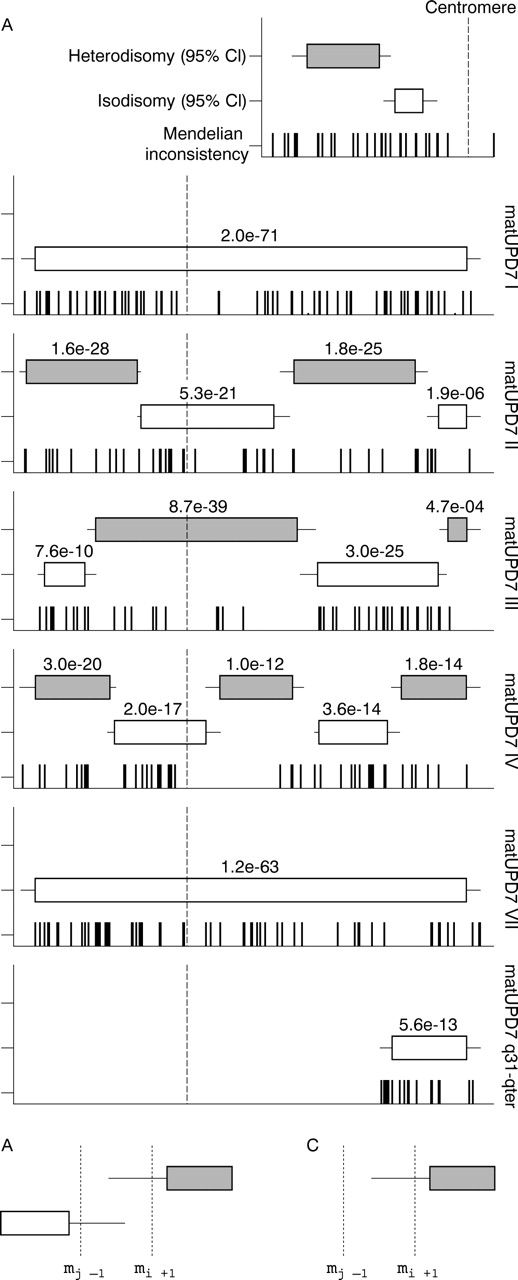
Our generated genotype data were subsequently analysed using a strategy to explore regions of isodisomy, defined as long stretches of homozygous genotypes, and heterodisomy, defined as long stretches of genotypes that are identical between child and parent. Using this approach, we could confirm the reported and suspected matUPD7 regions for all six tested patients with UPD, using highly significant, Bonferroni corrected p values and the number of coinciding mendelian errors in these regions (fig 1A). Furthermore, for the patients matUPD7 II, III, and IV we could delineate the isodisomic and heterodisomic regions along chromosome 7 with high confidence. No region of isodisomy common for all the matUPD7 cases studied at this high resolution could be identified, supporting the notion that imprinted gene(s) and not a recessive disease allele contribute to the SRS phenotype in these patients (fig 1A). Isodisomy in the centromeric region of matUPD7 II and IV suggested that the UPD had arisen from a meiosis II error, whereas heterodisomy in the centromeric region of matUPD7 III suggested a meiosis I error. Isodisomy throughout the whole chromosome 7 in matUPD7 I and VII indicated a postfertilisation rather than a meiotic error. Although there was no full chromosomal coverage by the 95% confidence interval regions, the predicted regions outside the confidence intervals still support UPD, but there is uncertainty in determining the exact recombination sites.

Isodisomy and heterodisomy regions in matUPD7. (A) Location of the interspersed regions of isodisomy and heterodisomy on chromosome 7. Patients (from top to bottom): matUPD7 I, matUPD7 II, matUPD7 III, matUPD7 IV, matUPD7 VII, and matUPD7q31-qter. The Bonferroni corrected p values are shown above the 95% CIs (boxes) for each region. The distributions of the mendelian errors on chromosome 7 are indicated for each individual, where each bar represents one error. The dashed vertical line indicates the centromeric position. (B) The delineation of recombination regions in overlapping regions of isodisomy and heterodisomy. The recombination is defined as occurring between mj−1 and mi+1, where mi corresponds to the end of the isodisomic region and mj corresponds to the start of the heterodisomic region. (C) The delineation of recombination regions in segmental UPDs, where mj denotes the start of the isodisomic region and me denotes the most proximal mendelian error supporting the UPD region. The recombination is defined as occurring between mj−1 and me.
Three observations are critical for detailed interpretation of the results. Firstly, if the UPD region resides at the end of the chromosome, it is likely to extend all the way to the telomeric repeat. Secondly, in the case of overlapping isodisomic and heterodisomic regions, if the first region ends at marker mi and the second region starts at marker mj, then the meiotic recombination must have occurred between markers mj−1 and mi+1 (fig 1B). Using this approach, we established the recombination regions for matUPD7 II, III, and IV (table 1). The average meiotic recombination region length was 3.5 Mb and the variance 4.3 Mb. Thirdly, if a segmental UPD region starts at marker mj and the most adjacent marker with a mendelian error is me, then the recombination must occur in the region between markers mj−1 and me (fig 1C).
In the case of matUPD7q31-qter, the first marker of the UPD region coincided with the first mendelian error (rs1419702) and thus the somatic recombination could be mapped to a distinct region of 783 kb between the markers rs727505 (mj−1) and rs1419702 (me|mj) (at position 124–125 Mb on 7q31.33). Our estimate improves the precision 10 fold compared with the previously reported 8.7 Mb recombination region between microsatellite markers D7S633 and D7S686 (at position 117–125 Mb), further narrowing down the potential SRS candidate gene region to 7q31.33-qter.9 This region includes 419 genes, according to the NCBI Map Viewer human build 35.1. In particular, the candidate genes discussed by Hannula et al9 are still present within the segment, including the 7q32 imprinting cluster.
No evidence for UPD in other parts of the genome was found in our analysis, supporting the hypothesis of the matUPD7 as the cause of the SRS phenotype in these patients. The only instance where a genomic region turned up as a possible UPD, defined using the Bonferroni corrected p value, was a putative heterodisomic region on chromosome 2 for matUPD7 III, presented as 71 consecutive identical genotypes (48.8–65.9 Mb, average inter-SNP distance 190 kb +/− 572 kb) shared between father and child. However, the complete lack of mendelian errors in this 17 Mb region argues strongly against this region being UPD. The SNPs on HMA10K have been shown to have an average heterozygosity of 0.38 and correspond to a genome scan resolution of 0.31 cM, making it very unlikely that existing mendelian errors would not be detected.15
Estimating power of detection
We estimated the power of our method by calculating the probability to detect UPD regions, given the frequency of mendelian errors fu in the UPD regions, and fn in the non-UPD regions. Based on the number of mendelian errors in matUPD7 I, II, III, IV and VII trios, the fu and fn frequencies are 0.12 and 0.001, respectively. We calculated the minimum number of SNPs and the minimum physical length of UPD regions that can be detected in HMA10K and HMA100K with 95% power and at a significance level of 0.05 (table 2). For HMA10K, the minimum physical length varied from 9.1 Mb on chromosome 18 to 24.4 Mb on chromosome 22, indicating that HMA10K has sufficient power to detect whole chromosome UPD for all chromosomes. Notably, for the most relevant chromosomes to screen systematically for UPD (6, 7, 11, 14, and 15), our method can detect all UPD regions extending at least 15% of the chromosome length.12 For HMA100K, the minimum physical distance varied from 1.8 Mb on chromosome 21 to 4.7 Mb on chromosome 1 (table 2). By using HMA100K, our method can detect UPD regions on chromosomes 6, 7, 11, 14, and 15 if they extend at least 5% of the chromosome length.
The minimum physical length of UPD regions detectable by HMA10K and HMA100K
DISCUSSION
In this study, we show that UPD can be statistically confirmed with SNP data from high density microarrays by making sensible assumptions about its multipoint genotypic appearance. This was exemplified by diagnosing both chromosome wide and segmental UPD, and by localising interspersed regions of heterodisomy and isodisomy in patients with matUPD7. The proposed UPD analysis approach has an advantage over the currently used methods such as microsatellite genotyping, methylation specific PCRs, and bisulphite sequencing, as it is rapid and reliable, and the genomewide result means it has wide application.
The significance of the UPD regions is determined by the number of consecutive SNPs meeting the UPD criteria. Consequently, shorter regions of UPD appear less significant than longer, and regions with a lower SNP density appear less significant than those with higher density. In this study, all UPD regions had very low p values, but if many recombinations have occurred or if the marker density is low, the UPD regions may lack significant Bonferroni corrected p values. This underlines the importance of using mendelian errors to detect chromosomes affected by UPD. If non-significant isodisomic and heterodisomic regions are strongly supported by mendelian errors, or are adjacent to other UPD regions, they are excellent candidates to represent real UPD. Furthermore, our method is based on the assumption that all cells have UPD, which is not always the case. Beckwith-Wiedemann patients with high levels of mosaicism for patUPD11p would be more difficult to detect with the automated genotype calling of HMA10K.6 However, the discrepancy between call rate and detection rate, which has been described as the consequence of mixing DNA, should, when it occurs in a specific chromosomal region, alert the investigator to consider the possibility of mosaic UPD.15
It should be noted that the regions we define as isodisomic cannot be distinguished from putative deletions at the genotype level. Isolated isodisomic regions should therefore be confirmed by other methods such as karyotyping or signal intensity analyses. Recently, it has been reported that the HMA10K array can be used for molecular karyotyping based on signal intensity.21 Several of the congenital syndromes associated with UPD are similarly associated with chromosomal defects, such as deletions of the 15q11-q13 region in Prader-Willi and Angelman syndromes,5 and duplications of 7p11-p14 in SRS.10 This underlines the potential for using the HMA10K array when investigating developmental defects on a genomewide level, where both a copy number assessment on the hybridisation signal level and a UPD analysis on the genotype level can be performed using the same technique. Our power estimation suggests that this approach would be even more powerful using the new HMA100K array, enabling a very good coverage of the genome, and thus opening the possibility of discovering new functional aberrations associated with congenital syndromes.
Previous algorithms for multipoint UPD mapping were generated for microsatellite data from the chromosome of interest and are based on calculating genetic maps or calculating the probability distribution of recombination events based on parent–offspring genotype patterns.19 These algorithms have been implemented in studies of recombination patterns contributing to UPD in more general attempts to understand the mechanisms leading to non-disjunction, as has been done for matUPD15.20 We believe that our method will also serve well in such studies, as the transition between heterodisomy and isodisomy pinpoints the recombination loci with high accuracy.
We strongly encourage using our proposed three step approach for exploring UPD: (a) considering the mendelian error statistics, (b) considering the result from the novel UPD algorithm and (c) if it is of relevance for the study, using the output from this algorithm to define the regions where recombinations have occurred.
CONCLUSION
We have shown that high density SNP marker arrays with whole genome coverage are useful for studying UPD in both clinical and biological settings.
Acknowledgments
We thank M Rönnholm at the Affymetrix core facility Novum, Karolinska Institutet for expert technical help. This work was supported by the Sigrid Jusélius Foundation, Academy of Finland, the Ulla & Gustaf af Ugglas Foundation, the Alex & Eva Wallströms Foundation, and the Swedish Research Council. We are grateful to the Wallenberg Consortium North for supporting the Affymetrix core facility at NOVUM.
REFERENCES
Footnotes
-
The first two authors contributed equally to this work.
-
Competing interests: none declared