Article Text

Abstract
Background: Osteoporosis is a major public health problem, mainly quantified by low bone mineral density (BMD). The majority of BMD variation is determined by genetic effects. A pilot whole genome linkage scan (WGS) was previously reported in 53 white pedigrees with 630 subjects. Several genomic regions were suggested to be linked to BMD variation.
Objective: To substantiate these previous findings and detect new genomic regions.
Methods: A WGS was conducted on an extended sample where the size was almost tripled (1816 subjects from 79 pedigrees). All the subjects were genotyped with 451 microsatellite markers spaced ∼8.1 cM apart across the human genome. Two point and multipoint linkage analyses were carried out using the variance component method.
Results: The strongest linkage signal was obtained on Xq27 with two point LOD scores of 4.30 for wrist BMD, and 2.57 for hip BMD, respectively. Another important region was 11q23, which achieved a maximum LOD score of 3.13 for spine BMD in multipoint analyses, confirming the results on this region in two earlier independent studies. Suggestive linkage evidence was also found on 7p14 and 20p12.
Conclusions: Together with the findings from other studies, the current study has further delineated the genetic basis of bone mass and highlights the importance of increasing sample size to confirm linkage findings and to identify new regions of linkage.
- BMD, bone mineral density
- DXA, dual energy x ray absorptiometry
- IBD, identity by descent
- LOD, logarithmic odds
- MLS, maximum LOD score
- QTL, quantitative trait locus
- WGS, whole genome linkage scan
- osteoporosis
- bone mineral density
- whole genome linkage scan
Statistics from Altmetric.com
- BMD, bone mineral density
- DXA, dual energy x ray absorptiometry
- IBD, identity by descent
- LOD, logarithmic odds
- MLS, maximum LOD score
- QTL, quantitative trait locus
- WGS, whole genome linkage scan
Osteoporosis is a systemic skeletal disease, largely characterised by low bone mineral density (BMD).1 It is a major public health problem and results in more than 1.3 million fractures a year. It incurred an estimated direct cost of 17.5 billion dollars in the USA alone in 1995.2,3
Extensive studies have established high degree (>60%) of heritability (h2) for BMD. Several whole genome scan (WGS) studies have been carried out to search for quantitative trait loci (QTL) underlying BMD variation.4–12 The genomic regions revealed are largely inconsistent,13 which may reflect the complexity of the genetic inheritance of BMD. Other possible reasons may lie in the diversity of study designs, ethnic heterogeneity, samples with insufficient power, various ascertainment schemes, and the statistical analyses used. As a result, significant or suggestive linkage claims should be subjected to extension or replication studies with large samples to test their validity.14 From a statistical genetics point of view, the statistical power issues involved are of critical importance in interpreting the inconsistency across different studies.
We recently reported a pilot WGS for BMD variation with 630 subjects from 53 pedigrees.5 Several potentially important genomic regions were suggested. The present study was designed to confirm our previous findings as well as to identify new genomic regions for BMD variation by employing denser markers (in the regions suggested earlier) and with nearly triple the sample size.
METHODS
Subjects
The study was approved by the Creighton University institutional review board. All the study subjects signed informed consent documents before entering the project. The subjects were all whites of European origin. Only healthy subjects with no apparent non-genetic cause for low or high BMD were included in the analyses. The sampling scheme and exclusion criteria have been detailed in our initial genome scan study.5 Briefly, subjects with chronic diseases and conditions which could affect bone mass were excluded. The exclusion criteria were assessed by nurse administered questionnaires or medical records, or both.
We included 1816 subjects from 79 pedigrees in the present WGS. These subjects can be divided into three groups:
-
the sample for our previous WGS (that is, the 53 pedigrees containing 630 individuals);
-
128 individuals who were newly recruited but still belonged to the original 53 pedigrees;
-
26 newly recruited pedigrees containing 1058 subjects.
These 79 extended pedigrees varied in size from 4 to 416 individuals, with a mean (SD) of 31.9 (48.9) (table 1).
Pedigree structures of the sample sets
Among the 53 pedigrees used in our previous WGS study, 50 were ascertained through probands with low BMD (ZBMD ⩽−1.28 at the hip or spine, belonging to the bottom 10% in the age matched population) and three were recruited without regard to BMD. Among the 26 new pedigrees, 25 were recruited through probands having high BMD (ZBMD ⩾+1.28 at the hip or spine, belonging to top 10% in the age matched population) and one was recruited without regard to BMD values.
Measurement
BMDs (g/cm2) for the lumbar spine (L1–4), total hip (femoral neck, trochanter, and intertrochanteric region), and wrist (ultra distal region of the forearm) were measured by Hologic 1000, 2000+, or 4500 dual energy x ray absorptiometry (DXA) scanners (Hologic Corporation, Waltham, Massachusetts, USA). Data obtained from different machines were transformed to a compatible measurement using the transformation formula described by Genant et al.15 This transformation was based on linear regression rules and has been shown to be a reliable and efficient method of calibrating BMD measurements made on different DXA machines.16 Members of the same pedigree were usually measured on the same type of machine. The measurement precision—as reflected by coefficients of variation for spine BMD, hip BMD, and wrist BMD—was 0.9%, 1.4%, and 2.3%, respectively. Weight (kg) and height (m) were measured at the same visit of the BMD measurement.
Genotyping
For each subject, DNA was extracted by employing the Puregene DNA isolation kit (Gentra Systems Inc, Minneapolis, Minnesota, USA). All the subjects were genotyped with 451 microsatellite markers, including 432 from autosomes and 19 from chromosome X. These markers are from ABI Prism® linkage mapping sets, version 2.5 (Applied Biosystems, Norwalk, Connecticut, USA). Generally, these markers are ∼10 cM apart. However, denser markers (∼5 cM apart) were genotyped around five genomic regions (4q31, 7p22, 9p24, 10q26, 12q24, and 13q33) that were shown to be of potential importance for BMD in our pilot WGS.5
Polymerase chain reactions (PCRs) were carried out on PE 9700 thermocyclers (Applied Biosystems, Foster City, California, USA) with cycling conditions suggested in the manual of ABI Prism® linkage mapping sets, version 2.5. Marker allele identification and sizing were undertaken using an ABI Prism® 3700 DNA analyser (Applied Biosystems), with Genescan™ version 4.0 and Genotyper™ version 4.0 software. Our genotyping system was upgraded from ABI Prism® 377 DNA analyser (used in our earlier WGS5) to the ABI Prism® 3700 DNA analyser used in the present study. To obtain cohesive genotype data, we retyped the initial 630 subjects in order to avoid the potentially serious problem introduced by binning adjustment because of the change in genotyping systems.
A genetic database management system (GenoDB)17 was employed to manage the genotype data. PedCheck18 was used for checking the Mendelian inheritance pattern at all the marker loci and for confirming the alleged relationships of family members within pedigrees. After three rounds of data checking and regenotyping, the data that could still not pass the PedCheck or were missing were counted as genotype missing and error data; the rate was ∼0.3%. All the 451 markers were successfully genotyped. These markers have an average population heterozygosity of ∼0.79.
Statistical analyses
Age, sex, height, weight, and sex×age interaction were tested for importance on BMD variation and significant factors (p⩽0.05) were adjusted as covariates for raw BMD values. Two samples which significantly deviated from the distribution of spine BMD of the rest sample were excluded as outliers. The BMD data of the rest sample conform to normality as tested by graphical methods.19 In the total of 79 pedigrees, the skewness values of BMD at the spine, hip, and wrist were −0.02, −0.12, and 0.05, respectively, and the kurtosis values were 0.88, 0.45, and 0.32. These values are quite similar to those in the initial 53 pedigrees and the 26 new pedigrees (data not shown).
A variance component linkage analysis for quantitative traits20–22 was carried out. The program employed was SOLAR (sequential oligogenic linkage analysis routines),20 which is available online (http://www.sfbr.org/sfbr/public/software/solar/solar.html). Two point and multipoint linkage analyses were done in all 79 pedigrees, in the expanded 53 pedigrees, and in the 26 new pedigrees. Linkage analyses on different subsets of the sample may decompose the linkage signals detected in the combined 79 pedigrees, providing information on the relative contribution of the different subsets to the total linkage signals. In addition, the 26 new pedigrees are independent of the sample for our previous WGS. Linkage analyses on these 26 independent pedigrees provides an independent assessment of our previous linkage findings.
The ascertainment scheme was accounted for in the analyses by the built-in modules of the Solar program, using conditional likelihood in the LOD score computation. For loci showing potential linkage with BMD variation (maximum LOD scores (MLS) >3.0) in 79 pedigrees, we also examined genetic heterogeneity by using the program HOMO23 which was integrated in SOLAR. Pointwise empirical probability (p) values were estimated using the procedure “lodadj” implemented in SOLAR. This procedure samples the null distribution (the distribution of LOD scores obtained under the no linkage hypothesis), so that a sorted array of LOD scores is obtained; the proportion of LOD scores greater than the observed LOD score is the latter’s empirical p value. In all, 10 000 replicates were generated. For each replicate, a fully informative marker, unlinked to BMD, was simulated. For this marker, IBDs (identity by descent) were calculated and a LOD score computed.
For the X chromosome, SOLAR can only handle two point analyses. Other software, such as Genehunter and Merlin,24 which can perform multipoint linkage analysis on chromosome X, unfortunately are not good at handling large pedigrees which make up most of our study sample. We therefore applied the program FASTER (family smart eliminator, available at http://www.hoschl.cz/faster/) to break down those large pedigrees into smaller ones, by splitting families or deleting family members while keeping as many members with genotypes as possible. All pedigrees which would be employed in multipoint analyses must have met the criteria 2N-F ⩽ 20, in which N is number of non-founders (individuals with at least one parent) and F is number of founders (individuals without parents). Eventually, multipoint linkage analyses on chromosome X were carried out in 121 “derivative” pedigrees (including 60 intact pedigrees and 61 “new” pedigrees) with 920 subjects using the variance component method implemented in Merlin.
RESULTS
The informative relationships for linkage analyses contained in the 53 original pedigrees, the 26 new pedigrees, and the combined 79 pedigrees are listed in table 2. It is notable that the number of informative relative pairs for linkage analyses in the combined 79 pedigrees was much larger than in the initial 53 pedigrees. For instance, the number of sibling pairs in the 79 pedigrees was more than triple that in the initial 53 pedigrees. This mainly reflected the larger sample size and the incorporation of some large families in the newly recruited 26 pedigrees. The basic characteristics of study subjects in different sample sets are summarised in table 3.
The informative relationships contained in the sample sets
Basic characteristics of the study subjects
Figure 1 summarises the linkage signals (multipoint LOD scores) for autosomes in the combined 79 pedigrees. For comparison, this figure also shows the linkage results found in our previous WGS in the 53 pedigrees with 630 subjects5 as well as in the 26 new pedigrees. Two point (from SOLAR) and multipoint (from Merlin) LOD scores of the markers on chromosome X are shown in fig 2. The genomic regions that had MLS >1.5 in the combined 79 pedigrees or in the 26 new pedigrees at any one of the three skeletal sites are summarised in table 4. For chromosomes showing at least suggestive linkage evidence (MLS >1.9) in the combined 79 pedigrees or in the 26 new pedigrees, we also plotted the results of multipoint linkage analyses in different sample sets in fig 3.
Genomic regions with LOD scores >1.5 detected in the 26 new pedigrees or in the 79 combined pedigrees
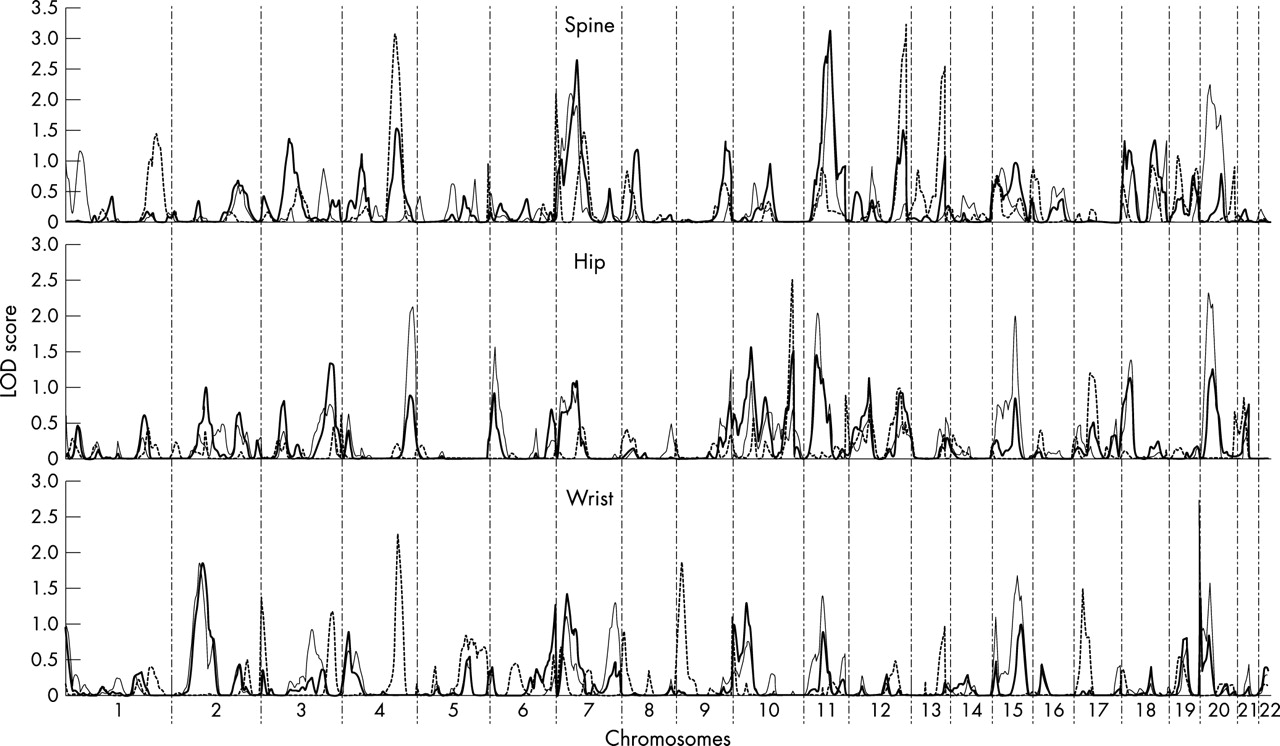
Linkage signals for autosomes in the 53 pedigrees with 630 subjects (dashed line) (published earlier by Deng et al5), 26 new pedigrees (thin solid line), and the combined 79 pedigrees (thich solid line).

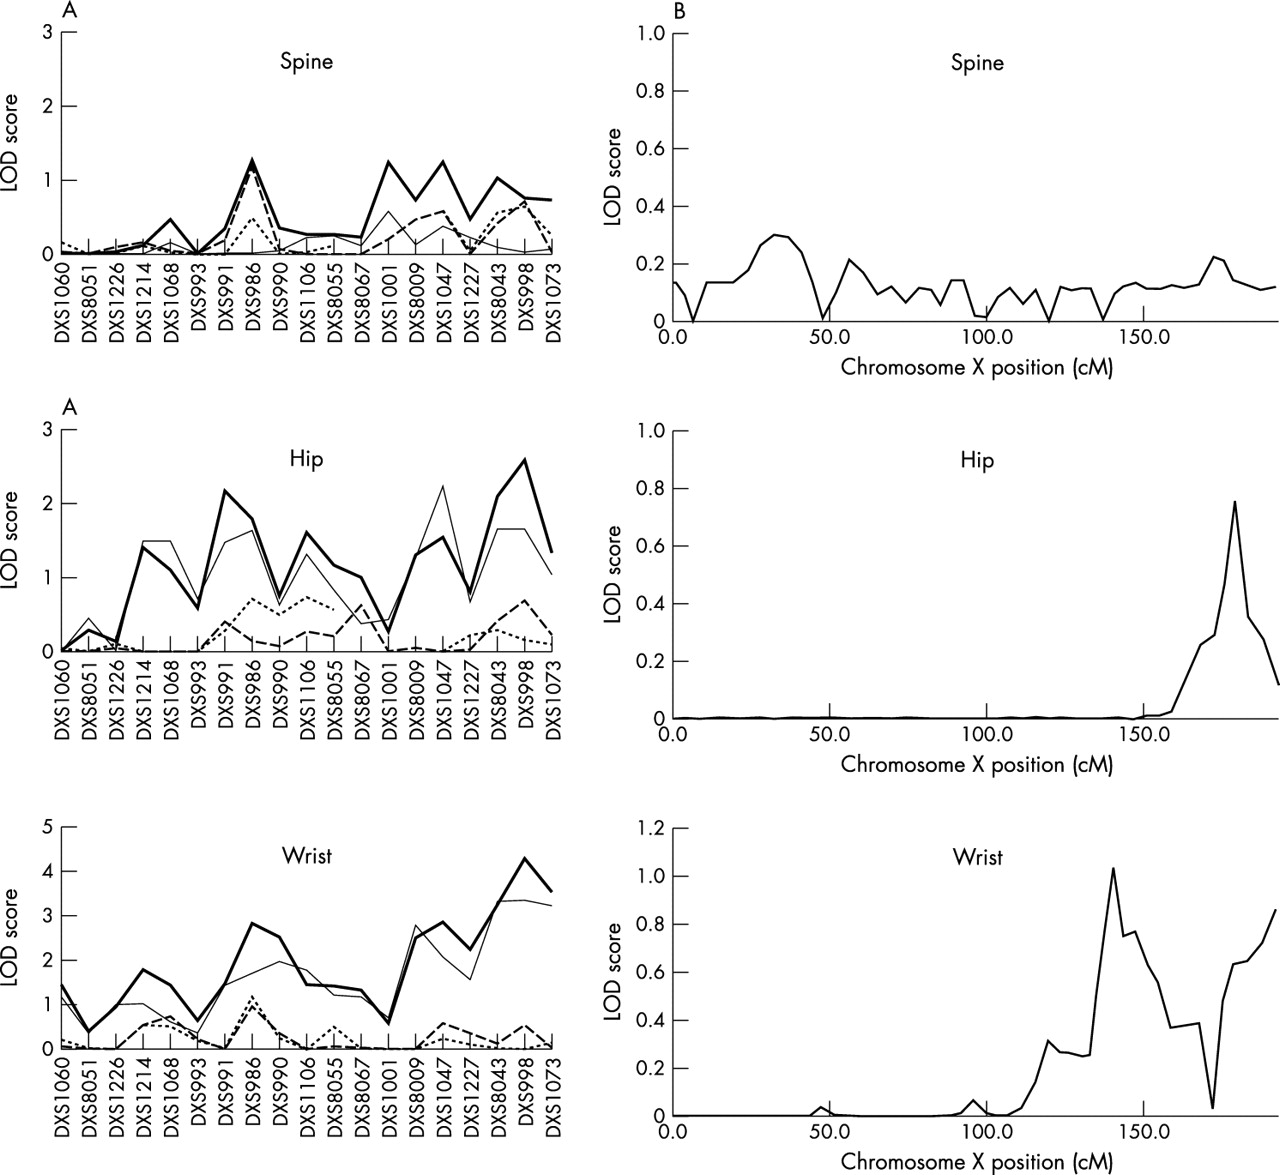
Linkage signals on the X chromosome. (A) Two point LOD scores obtained by SOLAR from the original 53 pedigrees (dotted line), 53 extended pedigrees (dashed line), 26 new pedigrees (thin solid line), and 79 pedigrees (thick solid line). (B) Multipoint LOD scores calculated by Merlin from the “derivative” pedigrees (see Methods).
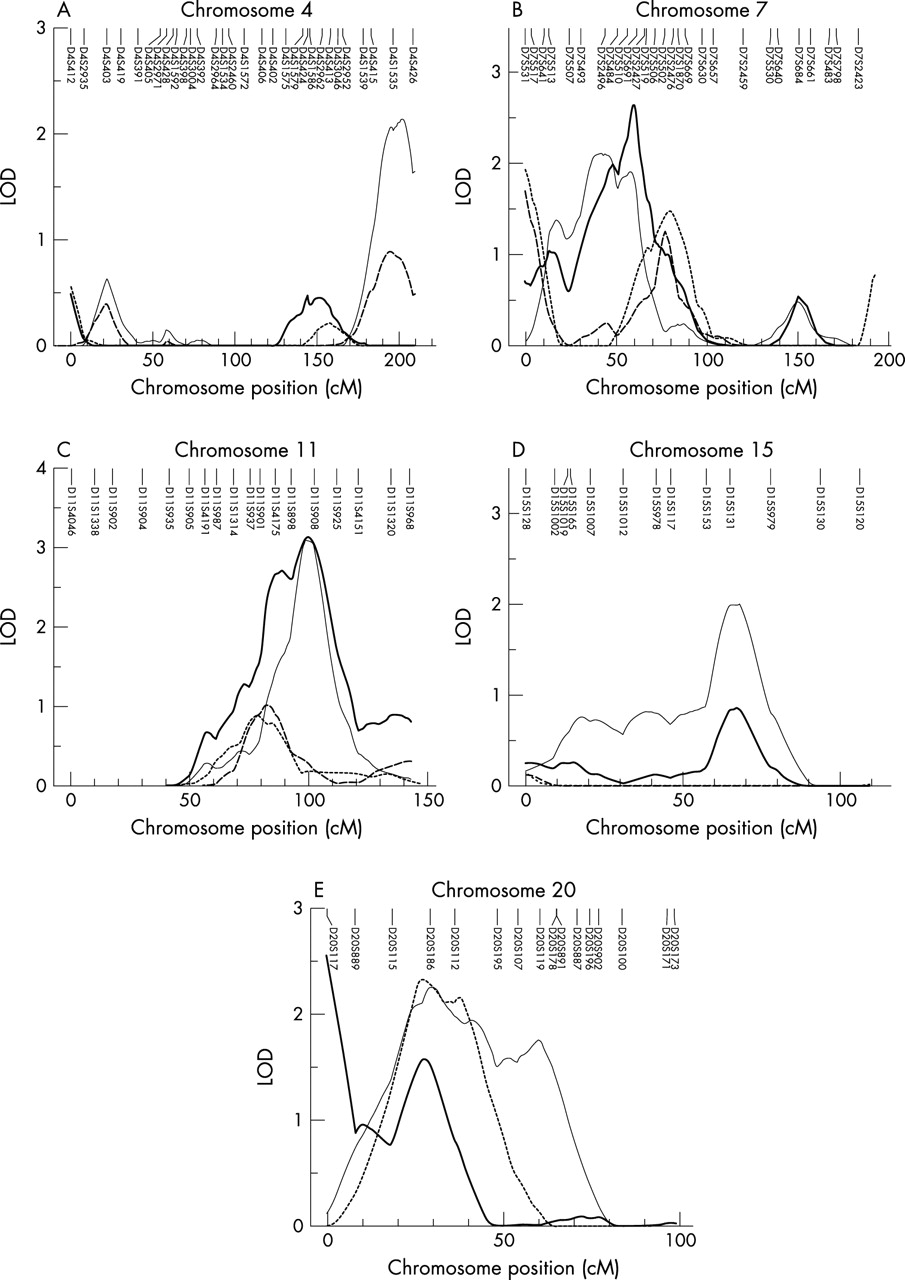
Genomic regions with MLS >1.9 in multipoint analyses detected in the 26 new pedigrees or in the combined 79 pedigrees. Panels A–D show the results of chromosomes 4 and 15 for hip bone mineral density (BMD), and chromosomes 7 and 11 for spine BMD, respectively. In these panels, the samples are indicated as the original 53 pedigrees (dotted line), 53 extended pedigrees (dashed line), 26 new pedigrees (thin solid line), and 79 pedigrees (thick solid line). (E) Multipoint analysis results on chromosome 20 in the 26 new pedigrees for spine BMD (thin solid line), hip BMD (dashed line), and wrist BMD (thick solid line), respectively.
The most significant linkage result—a two point LOD score of 4.30 (pointwise empirical p <0.0001)—was achieved on Xq27 at marker DXS998 for wrist BMD in the total 79 pedigrees (table 4, fig 2A). The marker DXS998 was not genotyped in our previous WGS. In the 53 extended pedigrees and 26 new pedigrees, the two point LOD scores for DXS998 were 0.55 and 3.35, respectively (table 4, fig 2A). For this result, the stepping up of linkage signals with the increase in sample size was evident (fig 2A). For hip BMD, the linkage signals on Xq27 also showed stepping up with the increase in sample size. The two point LOD score at DXS998 was 0.69 in the extended 53 pedigrees, 1.65 in the 26 new pedigrees, and 2.57 in the total 79 pedigrees (table 4, fig 2A). In addition to Xq27, several other regions on chromosome X also showed suggestive linkage for wrist and hip BMD (table 4, fig 2A). The multipoint LOD scores on chromosome X calculated in “derivative” pedigrees were largely below 1.0 (fig 2B), but there is still nominal linkage evidence retained at genomic regions around marker DXS998 for hip BMD (MLS = 0.76) and wrist BMD (MLS = 1.02).
In the combined 79 pedigrees, suggestive evidence of linkage for spine BMD was detected on chromosome 11q23 (MLS = 3.13, pointwise empirical p<0.0001) (table 4, fig 3C). In our previous WGS, we detected nominal linkage evidence at 11q14 near marker D11S901 (MLS = 0.80) for spine BMD.5 With 128 new subjects added into the 53 pedigrees, the highest linkage signal on chromosome 11 for spine BMD was achieved at the same location, but increased to an MLS of 1.02 (fig 3C). In the 26 new pedigrees, the linkage signals increased to 3.10 with the location shifting to 11q23 near the marker D11S908 (16 cM distal to D11S901) (table 4, fig 3C). The difference in position probably reflects better localisation of the QTLs in the 26 new pedigrees and the total 79 pedigrees with both increased sample sizes and denser markers, as suggested by Roberts et al.25 Heterogeneity testing at this region did not show any significant genetic heterogeneity between subsamples (p = 0.31).
On chromosomal region 7p14, an MLS of 2.64 (pointwise empirical p = 0.0003) was achieved near the marker D7S691 for spine BMD in the total 79 pedigrees (table 4, fig 3B). At this region, linkage signals were detected with MLS values of 1.48, 1.27, and 2.11, respectively, in our original 53 pedigrees (with 630 subjects), in 53 pedigrees expanded by 128 new subjects, and in 26 new independent pedigrees (table 4, fig 3B).
In the 26 new pedigrees, suggestive linkage signals were also found on several other genomic regions, including 20p12 for spine and hip BMD (MLS = 2.26 and 2.33, respectively), 4q35 (MLS = 2.14) and 11q12 (MLS = 2.04) for hip BMD, and 20p13 (MLS = 2.55) for wrist BMD (table 4). The results of the expanded 53 pedigrees (data not shown) were generally in accord with the results of the initial WGS, while the LOD scores were somewhat increased or decreased and location variation has also been observed.
DISCUSSION
We conducted our first WGS for BMD variation in 53 pedigrees with 630 subjects.5 Subsequently, we have expanded the sample from 53 pedigrees to 79 and increased the total sample size from 630 to 1816 subjects. We have also increased the number of microsatellite markers from 380 to 451. In particular, the marker density in genomic regions suggested in our earlier WGS has been about doubled. We carried out the present WGS on BMD on the enlarged sample and with the increased number of markers.
We detected significant or suggestive two point linkage signals at several regions on chromosome X for wrist and hip BMD. Although the multipoint LOD score calculated for chromosome X by Merlin is much lower than two point LOD scores obtained from SOLAR, this reduction probably reflects a considerable decrease in the number of relative pairs in the “derivative” pedigrees, which in turn would cause a drastic loss of statistical power. For instance, there are only 603 siblings contained in the derivative pedigrees, compared with 3846 in the combined 79 pedigrees. Epidemiological evidence has shown a lower risk of osteoporosis in men than in women of comparable age. Sex specific genetic regulation of bone mass and bone loss has been suggested in segregation analyses.26–28 Modifications of X chromosome genes in a complex inheritance could contribute to the increased risk of osteoporosis in women. The importance of the X chromosome for bone mass is strengthened by the earlier findings that the genes for two rare skeletal dysplasia syndromes have been mapped to the Xq27 region.29,30
We also found suggestive linkage on chromosome 11 for spine BMD. The 1-LOD support interval around the LOD score peak was mapped to a 33-cM region on 11q14–q23, which is bounded by markers D11S901 and D11S925. On the chromosome region 11q14–23, several other studies also found linkage signals. Devoto et al4 reported a maximum LOD score of 2.08 at marker CD3D, which was mapped to ∼5 cM distal to marker D11S908. Klein et al31 detected a potential QTL in mice near marker D7Mit234 (p = 0.0007), which was in a region homologous to human chromosome 11q14–q21. The promising candidate genes for BMD variation located in this region include a cluster of matrix metalloproteinase (MMP) genes, such as MMP8, MMP10, and MMP13. The enzymes encoded by these genes are involved in the breakdown of bone extracellular matrix in normal physiological processes, such as degrading proteoglycans and type Ι, ΙΙ, and ΙΙΙ collagens.32
Previously, chromosome region 11q12–13—which contains the LRP5 gene—was suggested to be of interest because of the mapping of several Mendelian bone mass phenotypes to this region.33,34 The LRP5 gene, which is located on ∼40 cM proximal to D11S908, is far outside of the 33cM region approximated by the 1-LOD support interval and is distinct from the region of 11q14–q23.
Another interesting finding is on chromosome 20p12, because MLS >1.5 has been achieved near marker D20S186 for BMDs at all the three skeletal sites in the 26 new pedigrees. An MLS of 2.26 was achieved at the spine, 2.33 at the hip, and 1.57 at the wrist (fig 3E). Linkage signals detected in 26 new pedigrees were even stronger than in the combined sample (MLS = 0.09, 1.25, and 1.38 at the spine, hip, and wrist, respectively). This was probably because the region was not detected in our previous WGS or in the 53 extended pedigrees, which may “neutralise” linkage signals achieved in the 26 new pedigrees when the two subsamples were combined. Such a discordant distribution of linkage signals for different subsamples may suggest genetic heterogeneity at this region. However, because the HOMO test only makes senses when MLS is >3.0,23 we did not carry out the heterogeneity test.
Recently, Styrkarsdottir et al10 detected a significant linkage signal on 20p12 (MLS = 5.10, pointwise p = 6.3×10⁻⁷) to osteoporosis risk in the Icelandic population. They applied a novel definition of the osteoporosis phenotype, based on combined osteoporotic fractures and BMD measurements at both the hip and the spine.10 Subsequent linkage disequilibrium mapping indicated that the bone morphogenetic protein 2 gene (BMP2) significantly associated with osteoporosis risk as well as BMD and can account for part of the observed linkage signal.10 An independent association study in a group of Danish postmenopausal women also confirmed those findings.10 Taken together, the 20p12 region is highly likely to contain a gene or genes contributing to osteoporosis risk, and the BMP2 gene is at least one of these genes. We believed in and have demonstrated the importance of using osteoporotic fractures as a phenotype for mapping genes underlying osteoporosis risk.35–37 Unfortunately, we do not have enough information on osteoporotic fractures in the current study. However, our results on 20p12 do replicate the findings of Styrkarsdottir et al10 to some extent and suggest pleiotropic effects of a gene or a cluster of genes within this region underlying BMD variation at multiple skeletal sites.
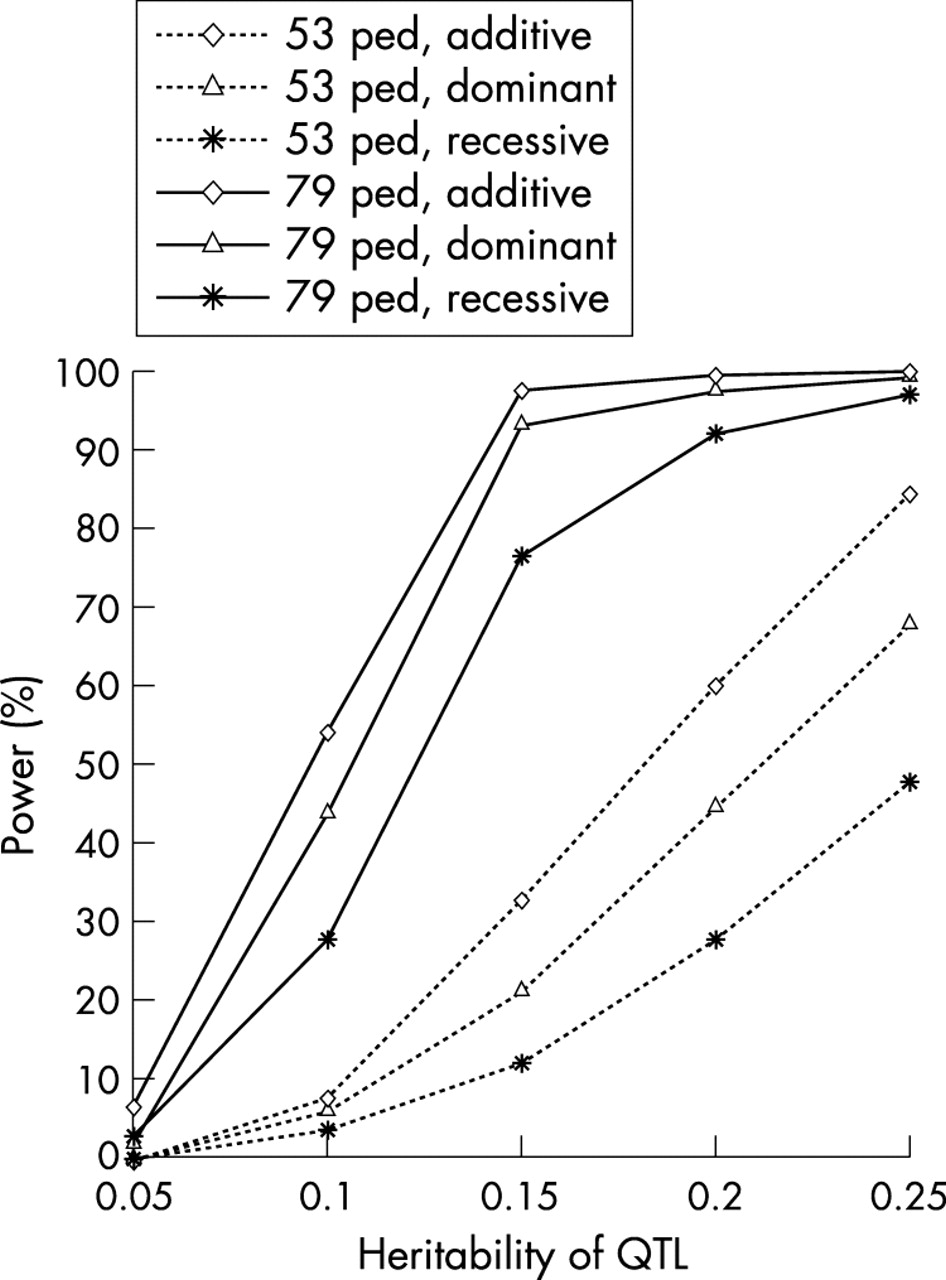
Replication of WGS studies for complex traits has been proven to be difficult, mainly because of the potential polygenic nature of inheritance and the limited power of the current WGS studies.37 As we know, the power and robustness of the linkage results depend critically on the study sample size employed, among other things. Compared with previous WGS studies in bone genetic field or even in the human genetics field in general, the sample employed in our current WGS represents one of the largest. The large sample size and complex relationships in these multigeneration families provide enormous numbers of relative pairs that are informative for linkage analyses. These copious relative pairs give our study exceptionally high statistical power (fig 4). For instance, assuming the total heritability of BMD to be 75%, our combined 79 pedigrees may provide 75–97% power to detect linkage (LOD >3.0) for a QTL accounting for 15% or more of the total trait variance; however, the power is modest for a QTL with smaller effects (for example, 27–55% power for QTL with h2 = 10%). With such fairly high statistical power and consistent evidence across different studies,4,31 we are reasonably confident that regions on chromosomes 11 and X may contain genes underlying BMD variation. The fact that no significant linkage signal has been achieved around some well known candidate genes—such as type I collagen α1 gene (COLIA1) and oestrogen receptor α gene (ER-α)—suggests that those genes may not be major QTLs for BMD variation in general populations, but may instead have weak or even modest effects in specific sample groups.

The statistical power of WGS in the original 53 pedigrees (with 630 subjects) and the current combined 79 pedigrees. For power comparison, the power estimation was conducted by using the same set of assumed parameters. The overall trait heritability is set as 0.75. The QTL is assumed to have two alleles and the frequency of the allele causing a decrease in BMD is 0.4. For the simulated marker, six alleles with equal frequencies are assumed, and the recombination fraction (θ) between the QTL and the marker is 0.05. Ped, pedigree.
On the other hand, no definitive statement can be made about chromosomes 4 and 12. These two regions achieved the highest MLS (3.08 and 2.96, respectively) in our previous WGS5 but showed dramatically decreased MLS in the combined sample of this study (1.54 and 1.50). Given the large sample size and the high statistical power of the current study, it is unlikely that the remarkable reduction of linkage signals merely reflected random fluctuation. Several factors may combine to the fall in LOD scores.
First, genetic heterogeneity is probably one of the principal reasons for failure of replication of the initial findings, though all the study subjects were whites of European origin and the heterogeneity test using HOMO did not reveal significant evidence of heterogeneity. However, it has been pointed out that the heterogeneity test using the admixture model introduced by Smith,23 as employed by HOMO, may have some problems. For example, the validity of the assumptions is unknown and hard to test, and the estimates of the proportion of families that segregate mutations of interest may be founded on incorrect likelihood models.38 In addition, the heterogeneity test is based on parametric linkage analysis, which is notorious for loss of power and robustness owing to violation of the assumption and incorrect specification of inheritance model for complex traits. Thus we cannot rule out the potential effects of genetic heterogeneity. Nevertheless, we think it unlikely that this potential genetic heterogeneity arises solely from the recruitment strategy. The initial 53 pedigrees were mainly recruited through a proband with low BMD and the 26 new pedigrees were enrolled through a proband with high BMD. However, for complex traits determined by multiple genes, sampling sibships or pedigrees through extreme probands (high and/or low) generally can only change the heterozygosity of these genes for their efficient identification in study samples by linkage analysis.39,40 The sampling scheme will not change the identity of loci segregating to determine the variation of the traits for the normal population, and thus will not introduce heterogeneity of loci in the various segregating samples in determining the traits. This is true even for the smallest sampling units such as sibling pairs, and even when the heritability of a segregating locus is as high as 30%.39,40 Moreover, because only one subject (that is, the proband) in each pedigree was ascertained for extreme values, the effects of sampling through extreme probands will diminish with larger and more complex pedigrees.
Second, the marker allele frequencies may have fluctuated in the current and previous studies—in other words, different samples of pedigrees from the same population may yield (by chance) different allele frequencies of markers. As IBD inference critically depends on allele frequencies, such a change may affect IBD estimation and consequently the linkage results. Also, the allele frequencies of the QTLs could be changed in the same manner. Consequently, linkages to QTLs with low frequencies or weak effects are difficult to replicate.41
Third, genotyping errors may also influence linkage results by deflating power and inflating recombination fraction estimates in linkage analyses.42,43 Despite the similar genotyping error rate (∼0.3%) controlled in the current and previous WGS studies, the distribution of genotyping errors in the samples may vary between the two studies, and may thus also lead to variation of linkage results.
Fourth, because of the relatively low statistical power of the previous WGS, we cannot exclude the possibility that the initial findings were false positive for QTLs of small to moderate effects. It is well known that replication of linkage findings is difficult.44,45
All the above attest to the need to enrol large samples as well as maximising sample homogeneity by recruiting subjects from the same ethnic group and rigorously controlling possible environmental factors in WGS for robust results. Subgroup analyses conditional on given genetic or environmental factors may yield more homogeneous samples; however, such studies would require an even larger sample size to ensure that individual subgroups retain adequate power to detect significant and robust results.
Conclusions
We reported a WGS study on BMD variation in an extended sample of 79 white (European) pedigrees. Our findings highlight the importance of increasing sample size to confirm linkage findings and identify new regions of linkage. Chromosomes Xq27 and 11q23 have been suggested to contain QTLs for BMD. The significance of these regions was corroborated by earlier findings and by the candidate genes within the regions. Further exploration of these regions is warranted. On the other hand, because of the complexity of the inheritance pattern of BMD and the difficulty in genetic dissection of complex traits, further evaluation of our findings in other sufficiently powered samples may be necessary. Once linkage to a genomic region is confirmed, subsequent saturation linkage mapping followed by linkage disequilibrium analyses with dense SNP markers within positively identified regions can confine the QTL to small genomic regions, which are amenable for positional cloning. Successful examples using similar strategies in identifying predisposing genes for complex human diseases have emerged and their numbers are growing.10,46–48 In addition, DNA microarray, proteomics, and other functional studies may complement the genetic mapping studies to eventually identify and confirm causal variants.49,50
Acknowledgments
The investigators were partially supported by grants from Health Future Foundation, NIH, State of Nebraska, US DOE. The study also benefited from grant support from CNSF, Huo Ying Dong Education Foundation, Hunan Province, and the Ministry of Education of China.
REFERENCES
Footnotes
-
Conflicts of interest: none declared
-
H Shen and Y-Y Zhang contributed equally to this work