Article Text

Abstract
Background: Using array techniques, it was recently shown that about 10% of patients with mental retardation of unknown origin harbour cryptic chromosomal aneusomies. However, data analysis is currently not standardised and little is known about its sensitivity and specificity.
Methods: We have developed an electronic data analysis tool for gene-mapping SNP arrays, a software tool that we call Copy Number Variation Finder (CNVF). Using CNVF, we analysed 104 unselected patients with mental retardation of unknown origin with a genechip mapping 100K SNP array and established an optimised set of analysis parameters.
Results: We detected deletions as small as 20 kb when covered by at least three single-nucleotide polymorphisms (SNPs) and duplications as small as 150 kb when covered by at least six SNPs, with only one false-positive signal in six patients. In 9.1% of patients, we detected apparently disease-causing or de novo aberrations ranging in size from 0.4 to 14 Mb. Morphological anomalies in patients with de novo aberrations were equal to that of unselected patients when measured with de Vries score.
Conclusion: Our standardised CNVF data analysis tool is easy to use and has high sensitivity and specificity. As some genomic regions are covered more densely than others, the genome-wide resolution of the 100K array is about 400–500 kb for deletions and 900–1000 kb for duplications. The detection rate of about 10% of de novo aberrations is independent of selection of patients for particular features. The incidental finding in two patients of heterozygosity for the 250 kb recurrent deletion at the NPH1 locus, associated with autosomal recessive juvenile nephronophthisis, which was inherited from a healthy parent, highlights the fact that inherited aberrations might be disease-related even though not causal for mental retardation.
- BAC, bacterial artificial chromosome
- CGH, comparative genomic hybridisation
- CNAG, Copy Number Analyser for GeneChip
- CNAT, Copy Number Analysis Tool
- CNVF, Copy Number Variation Finder
- DFA, deterministic finite automata
- FISH, fluorescence in situ hybridisation
- GSA, genomic smoothing algorithm
- OMIM, Online Mendelian Inheritance in Man
- PAC, P1-derived artificial chromosome
- qPCR, quantitative PCR
- SNP, single-nucleotide polymorphism
- SPA, single-point analysis
- molecular karyotyping
- 100K SNP array
- mental retardation
- copy number variation finder
- NPH1
Statistics from Altmetric.com
- BAC, bacterial artificial chromosome
- CGH, comparative genomic hybridisation
- CNAG, Copy Number Analyser for GeneChip
- CNAT, Copy Number Analysis Tool
- CNVF, Copy Number Variation Finder
- DFA, deterministic finite automata
- FISH, fluorescence in situ hybridisation
- GSA, genomic smoothing algorithm
- OMIM, Online Mendelian Inheritance in Man
- PAC, P1-derived artificial chromosome
- qPCR, quantitative PCR
- SNP, single-nucleotide polymorphism
- SPA, single-point analysis
Mental retardation is defined as a significant impairment of cognitive and adaptive functions with onset at <18 years of age and has a prevalence of about 2–3%.1 However, establishing an aetiological diagnosis is usually a challenge, and the underlying cause remains unknown in 65–80% of patients.2–4 As chromosomal aberrations are the most common known causes of mental retardation, genome-wide aneusomy screening methods have been developed using comparative genomic hybridisation (CGH) on 2.2–3.5K bacterial artificial chromosome (BAC) arrays with an average of about one clone per 1 Mb,5–9 so-called “tiling-path” 32K BAC arrays,10 and 10K and 100K single-nucleotide polymorphism (SNP) arrays initially designed for genotyping purposes.4,11–13 However, little is known about the sensitivity and specificity of the various methods. As data generated with SNP arrays are suitable not only for analysis of copy-number variation, but also for the detection of uniparental disomies and for association studies based on SNP genotypes, we considered them the most powerful tools for research into mental retardation. However, the available analysis methods for detecting copy-number variation are time-consuming and non-standardised, usually relying on visual detection of aberrations in data plots. We therefore developed an easy to use data-analysis tool that we call Copy Number Variation Finder (CNVF), and analysed 104 patients with mental retardation of unknown origin for copy-number variations on a 100K SNP array and explored the sensitivity and specificity of different parameters for CNV definition.
METHODS
Patients
In total, 104 patients referred for developmental delay /mental retardation with or without multiple congenital anomalies were recruited without further selection, if clinical evaluation with respective targeted molecular tests revealed no aetiological diagnosis. The tests were: karyotyping after GTG banding with a resolution of about 500 bands according to ISCN 2005;14 and subtelomeric screening by metaphase fluorescence in situ hybridisation (FISH), using the optimised BAC/P1-derived artificial chromosome (PAC) clone set described by Knight et al.15 Patients were categorised using the de Vries score,16 which measures the presence of malformations, dysmorphism, growth anomalies and familial occurrence of mental retardation as frequent signs in chromosomal aberrations. Fifteen patients also had normal results by molecular karyotyping with the 10K array (Affymetrix GeneChip 10K Mapping Array, V.1; Affymetrix, Santa Clara, USA).4
Methods
Hybridisation to mapping 100K arrays
From each patient, a sample of 500 ng of DNA extracted from fresh blood samples was processed according to the manufacturer’s instructions (Affymetrix GeneChip Human Mapping 100K Assay Manual). In brief, 250 ng of high-quality genomic DNA per 50K array was digested with XbaI or HindIII and ligated to XbaI or HindIII adaptors, respectively. After PCR amplification, random fragmentation and labelling, samples were hybridised to 50 K arrays (GeneChip Human Mapping 50K Xba240 and Hind240 arrays; Affymetrix) in a hybridisation oven (Affymetrix Hybridisation Oven 640; Affymetrix). Washes and staining of the arrays were performed using a fluidics station (Affymetrix Fluidics Station 450; Affymetrix), and images were obtained using a gene-chip scanner (Affymetrix GeneChip Scanner 3000; Affymetrix). Call rates had to exceed 98%.
Data analysis
The raw data was analysed using the CNAT V.2.0.0.9 (Affymetrix) using 0.5 Mb sliding windows for the genomic smoothing algorithm (GSA). CNAT V.2 relies on the Affymetrix GDAS program but uses the same algorithm as CNAT V.3, which is implemented in the Affymetrix GTYPE program. The CNAT output was exported to a table, which was then filtered for clusters of SNPs fulfilling particular criteria using a self-programmed, modular-designed Java program, CNVF. The data processing is split into three steps. In the first step, a parser goes over the input data and converts the data line by line into a format that can be processed by the other modules. During the transformation process, the parser classifies all intensity or probability values for each SNP into the categories (1) deletion, (2) duplication, (3) normal and (4) invalid. An SNP is classified as a deletion if its copy number or p value is below a particular configurable threshold. All SNPs that have a copy number above another threshold are marked as duplicated. Therefore, all SNPs neither below the first threshold nor above the second threshold are classified as normal SNPs. SNPs that could not be genotyped by the GDAS program (“no call”) are marked as invalid SNPs and will be ignored by the following processing modules. After the parser has converted the input data and all SNPs have been classified, the next module, the matcher, processes the data. The matcher searches either for blocks of continuous SNPs or for patterns of at least three of five SNPs that fulfil particular conditions. The matchers are based on deterministic finite automata (DFA). These DFAs are automatically built at run time out of given regular expressions similar to those that are used in Perl for matching strings. The main difference, however, is that the regular expressions and the resulting DFAs are able to work on objects instead of strings. All objects that are matched by the DFAs are stored for further processing. After the matcher has found a number of SNPs that fit the given pattern, a validator module checks for particular constraints that each cluster must fulfil. All data that do not pass the various conditions are filtered out.
After visual analysis of data values from the CNAT program in a patient with known 1.4 Mb PMP22 duplication, a patient with known 1.5–1.9 Mb 7q11.23 deletion, and four patients with known 3 Mb 22q11.2 deletion, two different parameter settings, one with a higher stringency to limit the number of possible aberrations (A1) and one with a lower stringency to allow the detection of smaller aberrations (A2) were established for this study. While the less stringent parameter set A2 would have allowed the detection of the known aberration in all six patients, the more stringent parameter set A1 would have detected the 1.4 Mb duplication, but would have missed the 1.5–1.9 Mb deletion and the 3 Mb deletion in three of four patients. For A1, GSA p values, which are ± log10 values, were filtered for clusters of at least six adjacent SNPs with a value <−2.5 containing at least three SNPs with a value <−5 for deletions, or at least six adjacent SNPs with a value >+2.5 and containing at least three SNPs with a value >+5 for duplications. For A2, GSA p values were filtered for clusters of at least three adjacent SNPs with a value of at least ±2.5 containing at least three SNPs with a single-point analysis (SPA) copy number value of ⩽1.5 for deletions and ⩾2.5 for duplications.
Validation of aberrations
Deletions of an expected maximum size of at least 100 kb were analysed by two-colour FISH with locus-specific BAC or PAC probes from the National Center for Biotechnology Information human genome map and subtelomeric control probes on metaphase spreads prepared from blood samples. Probes for the regions of interest were directly labelled with Cy3-dCTP (Amersham, Buckinghamshire, UK), and subtelomeric control probes were directly labelled with SpectrumGreen-dUTP (Vysis, Des Plaines, Illinois, USA) using a nick-translation kit (Roche Diagnostics, Mannheim, Germany), according to the suppliers’ instructions. Hybridisation was performed as described previously.17 For duplications and selected deletions apparently <100 kb, quantitative PCR was performed using Taqman assays with minor-groove binder probes. The assays were performed with fourfold measurements, each multiplexed with an albumin probe as an internal reference, and calculation of copy numbers by the ΔΔCt method as described previously.18
RESULTS
When applying the more stringent CNVF parameter set (A1), molecular karyotyping with the 100K SNP array revealed 10 unique deletions, 23 unique duplications and 9 different recurrent duplications (figs 1, 2 and 3A), whereas parameter set A2 revealed 42 unique deletions, 151 unique duplications, 53 different recurrent deletions and 314 recurrent duplications (fig 3B). Set A1 indicated a total of 92 aberrations in 53 of 104 patients (average of 0.9 aberrations per patient in the total study group; fig 3C), whereas set A2 indicated at least 1 of 1792 aberrations in every patient, with an average of 17.2 aberrations per patient (fig 3D). Distribution of maximum sizes of the respective aberrations is shown in figure 3 (E, F). Depending on the given SNP coverage of a particular region and the size of an aberration, the minimum aberration size as defined by the SNPs showing a particular copy-number variation may differ significantly from the maximum aberration size as defined by flanking SNPs with normal values.

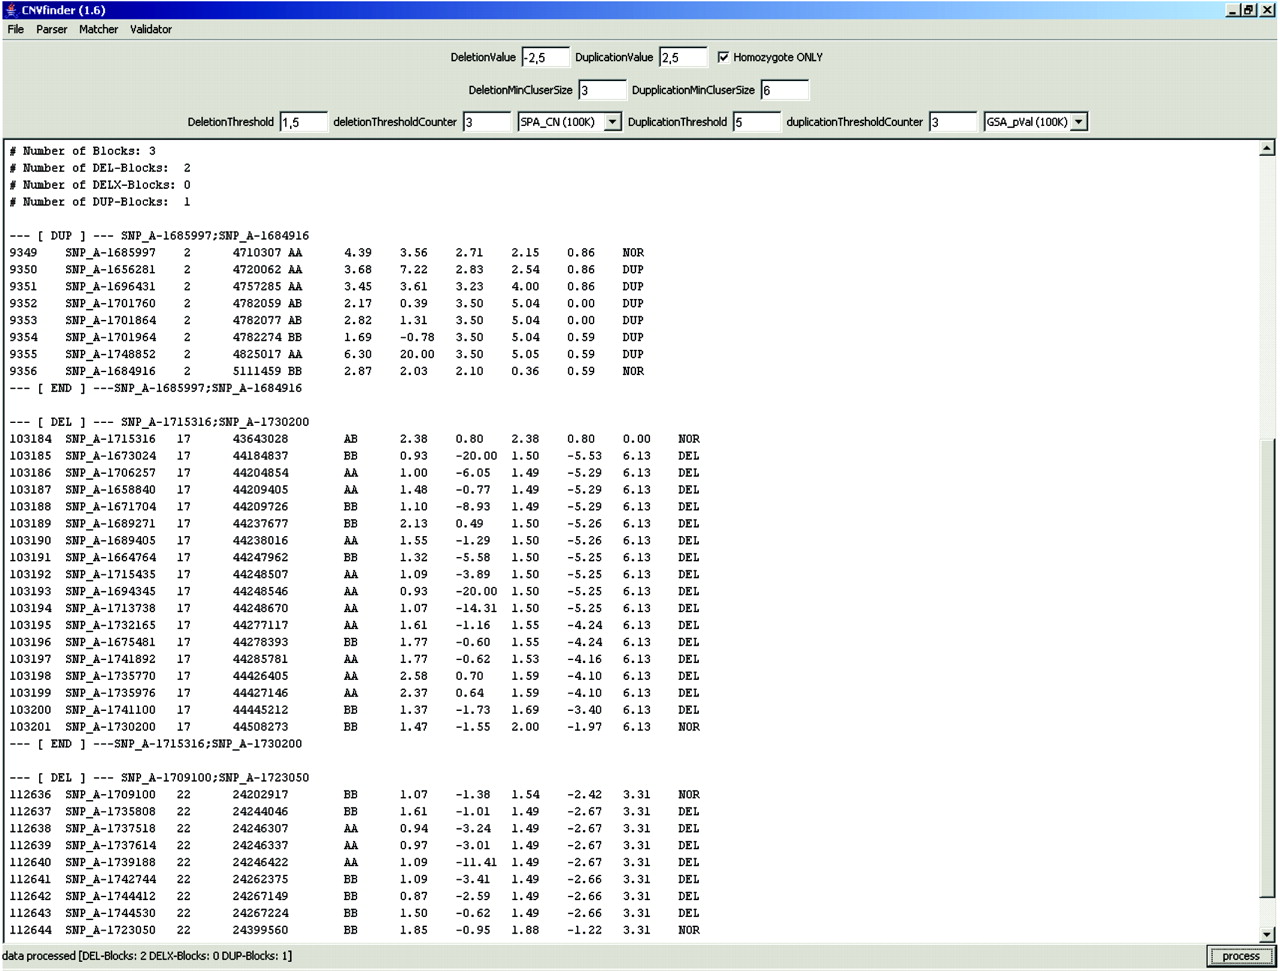
Screen shot of the Copy Number Variation Finder (CNVF) output using the optimised parameter set in patient 12. Note indication of the 17q and 22q confirmed deletions depicted in fig 2, and a duplication on chromosome 2 that was already present in the genomic-variation database. The lines flanking an aberration cluster give the flanking SNPs (separated by a semicolon for easy access to genome information on the respective aberration) in the University of California Santa Cruz genome browser. Columns contain the Copy Number Analysis Tool (CNAT) output information. Left to right: probe set, chromosome, physical position, call (ie genotype), single-point analysis copy number, single-point analysis p value, genomic smoothing algorithm copy number, genomic smoothing algorithm p value, loss of heterozygosity value. Note that the chromosomal position of SNPs given in the array data may differ from the actual genome browser information. The feature “homozygote only” means that SNP intensity values indicating a deletion are only labelled as deletion if the respective genotype is homozygous.

Examples of plots of +/− log10 GSA p values calculated with Affymetrix Copy Number Analysis Tool V.2 for copy numbers of SNPs of the Affymetrix GeneChip Human Mapping 100K SNP array in patient 12 using a Gnuplot program. Genotypes of individual SNPs are indicated by coloured bars at the bottom (magenta, homozygous; blue, heterozygous; brown, no call). Upper: plot of +/− log10 GSA p values for SNPs covering chromosome 17 in patient 12, with a 0.4 Mb de novo deletion in 17q21.31 indicated by Copy Number Variation Finder (CNVF) parameter set A1 and confirmed by fluorescence in situ hybridisation (arrow). Note magenta stretch of homozygosity corresponding to the deleted region. Lower: plot of +/− log10 GSA p values for SNPs covering chromosome 22 in the same patient showing a 250 kb inherited deletion in 22q11.23 indicated by CNVF parameter set A2 and confirmed by FISH (arrow). Note that the resolution of the plot does not allow determination of the number of SNPs passing the thresholds of ±2.5. This is achieved by the CNVF, which indicated in this specific case that 16 SNPs passed the threshold in the 17q21.31 deletion and 7 in the 22q11.23 deletion (fig 1). *Duplication identified in 11.5% of patients, which overlaps with a deletion at 28.1 Mb described as a normal variant.

Overview of results of molecular karyotyping with the 100K array using the Copy Number Variation Finder (CNVF) with parameter sets (A, C, E) A1 and (B, D, F) A2. (A, B) White bars, deletions; black bars, duplications. (A) Set A1 revealed 10 unique deletions, 23 unique duplications and 9 different recurrent duplications; (B) set A2 revealed 42 unique deletions, 151 unique duplications, 53 different recurrent deletions and 314 recurrent duplications. (C, D) Number of patients with a particular number of aberrations. (C) Using the stringent parameter set A1, 51 patients showed no aberration, whereas 53 of the 104 patients showed at least 1 of 92 aberrations (average of 0.9 aberrations per patient in the total study group); (D) A2 indicated at least 1 of 1792 aberrations in every patient, with an average of 17.2 aberrations per patient. (E, F) Size distribution of aberrations indicated by sets (E) A1 and (F) A2.
Using FISH with locus-specific BAC/PAC probes, we verified 46 different potential unique and rare deletions with an estimated maximum size of ⩾100 kb in 52 patients. All 10 deletions (maximum size 0.8–14 Mb) indicated by parameter set A1 were confirmed by FISH, whereas only 9 of 36 further investigated possible deletions indicated by set A2 could be confirmed by FISH or quantitative PCR (qPCR). However, 24 of these possible deletions (18 with a minimum size of 769 bp to 80 kb and 6 with a minimum size of 140–370 kb) could not be confirmed by FISH. They were not further investigated by qPCR because of their small size and lack of gene content or overlap with known polymorphisms. Of 20 unique duplications indicated by parameter set A1 (size 0.2–4 Mb), 6 were confirmed by qPCR, whereas the remaining 14 possible duplications (minimum size 0.8 bp to 224 Mb; 3–10 SNPs) could not be confirmed. Three duplications indicated by A1 were not further investigated because they overlapped with normal gains described elsewhere. Rare duplications indicated only by the less stringent parameter set A2 were not further investigated, because the rate of false-positive signals was already 70% for the more stringent parameter set A1. As nine of the rare deletions confirmed by FISH or qPCR were indicated only by A2 (table 1), an optimised setting would thus use A2 for detection of deletions and A1 for duplications. This approach would result in 3 of 22 (14%) indicated rare deletions and 14 of 20 (70%) indicated rare duplications being false positive, with an average of 1 false-positive signal per 6 patients. However, if only deletions of at least 100 kb and duplications of at least 900 kb were followed, specificity would be 100%, with the loss of all four inherited duplications and only one inherited deletion.
Overview of detected aberrations verified by FISH or quantitative PCR
One 14 Mb deletion containing 59 genes was considered to be disease-causing because of its size and gene content, but the parents of the proband withdrew consent to have themselves test. Eight of the further 18 (44%) confirmed deletions and 2 of the 6 (33%) confirmed duplications occurred de novo, giving a total de novo rate of 42% (tables 1 and 2). Inherited aberrations had maximum sizes between 0.2 and 2 Mb (minimum sizes 20 kb–2 Mb), and de novo aberrations had maximum sizes between 0.85 and 12.9 Mb (minimum sizes 0.4–12.8 Mb) and were thus statistically significantly larger (p = 0.001, Wilcoxon test). Note that the actual size of a confirmed aberration was defined according to the copy number of SNPs within and flanking a cluster with high GSA p values and not according to the GSA p values of the SNPs themselves, which were only used to find aberrations. We have previously shown that p values may overestimate or underestimate aberration sizes, whereas copy-number values correspond very well to FISH results.11
Overview of clinical findings in patients with de novo aberrations
Array data from patients with confirmed aberrations were also investigated with the program Copy Number Analyser for GeneChip (CNAG),19 which analyses data from the two 50 kb arrays (Hind and Xba), separately. One de novo and 6 inherited aberrations were missed by both arrays, and 4 de novo and 6 inherited aberrations were indicated by one array only (table 1). Apart from the confirmed rare aberrations, the CNAG program indicated 105 small aberrations in these 23 patients, with only 1 overlap with the CNVF data (mean 5 aberrations/patient; range 1–13). We used the 100K array on the 15 patients who had normal results with the 10K SNP array in our pilot study;4 one (patient 12), was found to carry a de novo 0.4 Mb microdeletion in 17q21.31 and a maternally inherited 260 kb deletion in 22q11.23, and another patient (patient 51) had a 130 kb paternally inherited deletion in 2q32.1.
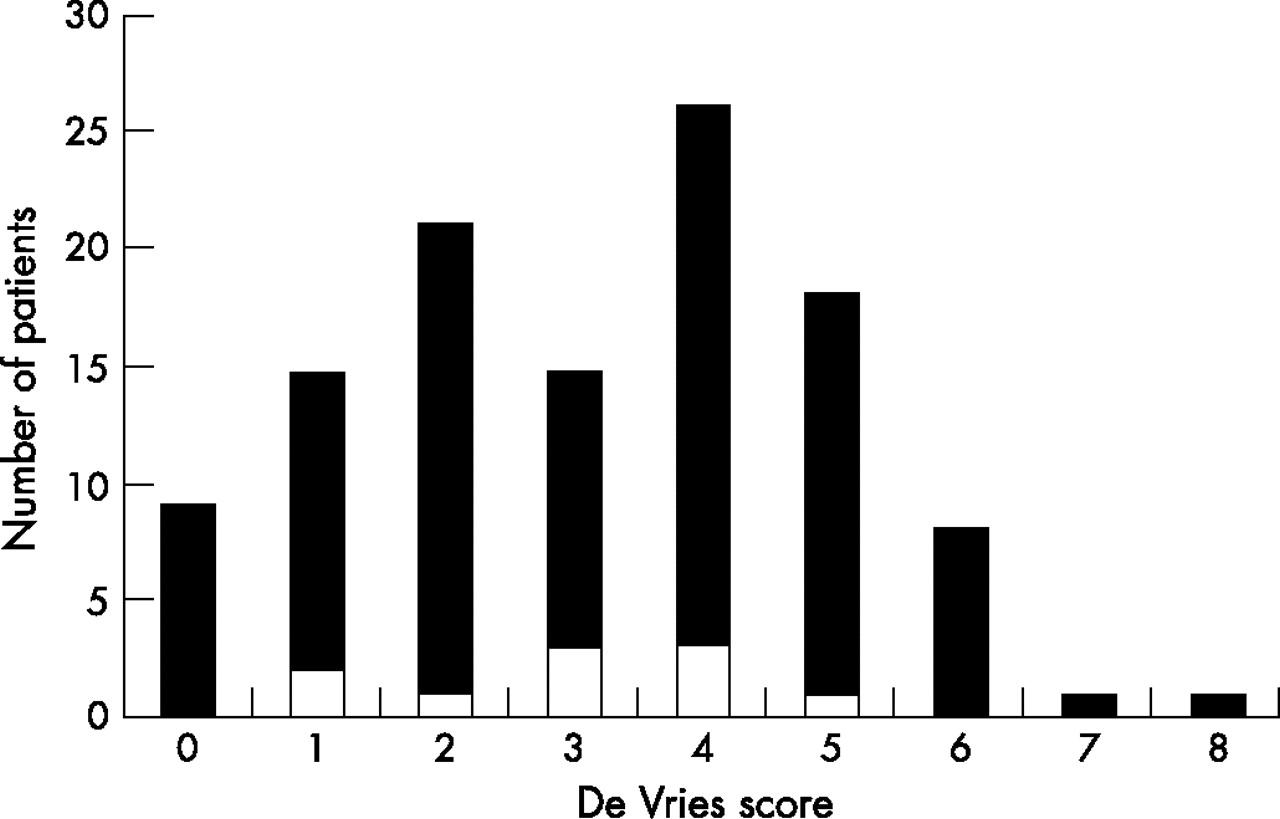
Morphological anomalies measured by the de Vries score (range 0–10) in the 104 patients of our entire study group showed a similar distribution and a similar average score of 3.1 (range 0–8) to those observed in patients with de novo or apparently disease-causing aberrations, who had an average score of 3.0 (range 1–5) (fig 4).

Distribution of de Vries scores in all 104 patients (black areas) and those with apparently disease-causing or de novo aberration (white).
DISCUSSION
Our results show that the CNVF is an easy tool to use for standardised detection of copy-number variations, and has high sensitivity and specificity using intensity data from GeneChip Mapping SNP arrays as calculated by the Affymetrix copy-number tool (V2 or V3). In contrast to other approaches such as the Affymetrix visualisation tool for the copy-number tool data or the CNAG program,19 our CNVF tool circumvents time-consuming and non-standardised visual data analysis. We established an optimised set of analysis parameters for the 100K array, resulting in detection of deletions when covered by at least three SNPs on the array and of duplications when covered by at least six SNPs, with a low false-positive rate of only one false aberration per six patients. Specificity of indicated aberrations can even be increased to 100% without loss of de novo or apparently disease-causing aberrations if deletions with a minimum size of 100 kb and duplications with a minimum size of 900 kb only are followed. The low false-positive rate is especially important, as confirmation of aberrations with independent methods is laborious and time-consuming. Using visual analysis of our confirmed aberrations with the CNAG program, we were unable to detect one de novo and six inherited aberrations identified in our study (table 1). This might be explained by the separate analysis of the two 50K datasets by this program, which increases the gaps in genome-wide SNP coverage. The CNAG program is also based on a different algorithm to calculate copy-number values, and requires at least four adjacent SNPs with a similar copy-number change to reach a false-positive rate of ⩽4 per patient.12 This shows that our CNVF tool has excellent specificity with the described settings, although its sensitivity with respect to CNAG could not be established. However, as the SNPs on the 100K array are not evenly distributed and thus some areas of the genome are covered more densely than others, the genome-wide resolution of this array of our approach is >100 kb. Only 92% of the genome is within 100 kb of an SNP and 83% is within 50 kb of a SNP, thus the genome-wide resolution is more likely to be about 400–500 kb for the detection of deletions requiring three adjacent SNPs, and about 900–1000 kb for duplications requiring six adjacent SNPs.
We were able to detect apparently disease-causing or de novo cryptic chromosomal aberrations in 10 of 104 unselected patients with mental retardation of unknown aetiology after normal karyotyping and subtelomeric screening. Minimum sizes of aberrations varied from 0.4 to 14 Mb. In total, 15 of these patients had not had aberrations found when analysed with the 10K SNP array.4 One of these patients was found with our program to carry a de novo 0.4 Mb microdeletion in 17q21.31. When correcting for the patient with a 5 Mb de novo 6q22 deletion who had already been identified in that pilot study, we obtained a detection rate of de novo non-subtelomeric aberrations of 10.5% (11 of 105 patients), which is in the same range as the 11% previously reported in 100 patients with mental retardation studied with the GeneChip Mapping 100K array12 and the 10% reported in 100 patients studied with a tiling 32K BAC array.10 Despite the approximately 10 times lower resolution, a similar detection rate of 9.1% non-subtelomeric disease-related aberrations was also achieved with 2.6–3.5K BAC arrays in a total of 374 patients.5–8,27–29 This might be explained by our data and previously published data10 showing that the majority of de novo and thus probably disease-related aberrations are >1 Mb and as a group are significantly larger than inherited variants. It is also noteworthy that we observed the same rate of de novo aberrations in unselected patients as found in previous studies that had selected patients for a particular number of major and minor anomalies. In contrast, patients diagnosed with monogenic disorders, recurrent microdeletion syndromes and subtelomeric aberrations showed higher average de Vries scores (3.4, 3.6 and 3.8, respectively).4 Thus, although a de Vries score of ⩾3 might be useful for selecting patients with a higher probability of having a subtelomeric aberration,16 this does not seem to be a good predictor for the presence of an interstitial aberration.
The majority of de novo aberrations we detected are unique, but two of our patients showed microaberrations that have recently been reported. One of the latter overlaps with the up to 0.6 Mb 17q21.31 microdeletion reported to occur with a frequency of 0.3% in patients with mental retardation, and results in a novel distinct phenotype (OMIM 610443).21–23 The second corresponds to the 3.7 Mb duplication of the Smith–Magenis syndrome region at17p11.2, which is associated with a less distinct phenotype also referred to as Potocki–Lupski syndrome.20,30 The 1.5 Mb de novo deletion in 7p22.3–22.2 in patient 45 overlaps with a 3.6 Mb de novo deletion described by Friedman et al in a patient with mental retardation.12 One of our patients with a 1.2 Mb deletion in 18q21.2 led to the identification of the underlying gene defect of the Pitt–Hopkins syndrome, which was a poorly established entity with no OMIM number.31
Our de novo aberrations represented 42% of the confirmed aberrations. This proportion is much lower than the 65–89% de novo aberrations reported by others using 3.5K BAC arrays,9,27 which is probably explained by the higher resolution of the 100K SNP array and the fact that de novo aberrations are usually larger than polymorphisms. Apart from the 11 apparently disease-causing or de novo aberrations observed in 10 patients, we obtained an average of 1.5 copy-number variations per patient with a median of 1 using our optimised data-analysis parameter set. Interestingly, 36 patients (35%) showed no copy-number variation at all. These numbers are relatively low compared with the average of 104 copy-number variations detected with tiling-path BAC arrays in normal people,24 which is probably explained by the stringency of our algorithm to avoid false positives but possibly also to the fact that the 100K SNP array does not cover highly polymorphic repeat regions. Molecular karyotyping has recently been criticised for the need to follow up many rare aberrations, with a high number found to be inherited from healthy parents.32 This problem, if one at all, is only temporary, as is evident from the fact that at the beginning of our study none of the inherited rare aberrations observed was known, but since then, most have been described and deposited in the database of genomic variants (table 1). However, one of the inherited deletions (2q13), which is also described as a normal genomic variant in the database, corresponds to the 250 kb recurrent deletion of the NPH1 locus, which is the major mutation in autosomal recessive junvenile nephronophthisis (OMIM 256100).33 This NPH1 deletion occurred in the heterozygous state in two patients and one of each respective parent, none of whom had signs of nephronophthisis, giving a 2% heterozygous carrier frequency in our study group of European descent. This finding emphasises that inherited aberrations can be recessive or oligogenic mutations, as also observed in the recessive Peters Plus syndrome (OMIM 261540)34 or the thrombocytopenia and absent radius (TAR) syndrome with complex inheritance.35 Thus, inherited copy-number variations might not be associated with the disorder this investigation was intended to study and might represent at-risk alleles for late-onset disorders such as breast cancer,34 an issue that should be taken into account when obtaining informed consent from patients and their families.
Our data show that the CNVF, which is available on request, is a powerful tool to analyse data from the GeneChip Mapping 100K array for molecular karyotyping. We detected verifiable rare deletions as small as 20 kb and duplications as small as 150 kb with a high specificity of only one false-positive aberration in six patients. Using our optimised parameter set and given the average SNP spacing of 23.6 kb, the theoretical resolution is 48 kb for deletions and 120 kb for duplications. However, as some genomic regions are covered more densely than others and some regions including the subtelomeric regions being poorly covered in this array, the actual genome-wide resolution is estimated to about 400–500 kb for deletions and 900–1000 kb for duplications.
Electronic database information
-
National Center for Biotechnology Information (NCBI): http://www.ncbi.nlm.nih.gov/
-
Genome Browser of the University of California Santa Cruz (UCSC): http://genome.ucsc.edu/cgi-bin/hgTracks
-
Online Mendelian Inheritance in Man (OMIM): http://www.ncbi.nlm.nih.gov/Omim.
-
Database of Genomic Variants: http://projects.tcag.ca/variation/
Acknowledgments
We thank the family members for their kind participation, and Michaela Kirsch and Sabrina Schulz for excellent technical assistance. This work was supported by grant RA 833/7-1 (AnR, PN) funded by the Deutsche Forschungsgemeinschaft (DFG).
REFERENCES
Footnotes
-
Published Online First 29 June 2007
-
Competing interests: None declared.