Article Text

Abstract
Background: Subtelomeric regions of the human genome are gene rich, with a high level of sequence polymorphism. A number of clinical conditions, including learning disability, have been attributed to subtelomeric deletions or duplications, but screening for deletion in these regions using conventional cytogenetic methods and fluorescence in situ hybridisation (FISH) is laborious. Here we report that a new method, multiplex amplifiable probe hybridisation (MAPH), can be used to screen for copy number at subtelomeric regions.
Methods: We have constructed a set of MAPH probes with each subtelomeric region represented at least once, so that one gel lane can assay copy number at all chromosome ends in one person. Each probe has been sequenced and, where possible, its position relative to the telomere determined by comparison with mapped clones.
Results: The sensitivity of the probes has been characterised on a series of cytogenetically verified positive controls and 83 normal controls were used to assess the frequency of polymorphic copy number with no apparent phenotypic effect. We have also used MAPH to test a cohort of 37 people selected from males referred for fragile X syndrome testing and found six changes that were confirmed by dosage PCR.
Conclusions: MAPH can be used to screen subtelomeric regions of chromosomes for deletions and duplications before confirmation by FISH or dosage PCR. The high throughput nature of this technique allows it to be used for large scale screening of subtelomeric copy number, before confirmation by FISH. In practice, the availability of a rapid and efficient screen may allow subtelomeric analysis to be applied to a wider selection of patients than is currently possible using FISH alone.
- subtelomeric DNA
- learning disability
- MAPH
- copy number
Statistics from Altmetric.com
Subtelomeric regions of human chromosomes are highly polymorphic and have the highest gene density in the genome.1,2 They are of clinical interest because chromosome rearrangements involving subtelomeric regions have been shown to cause several conditions including learning disability,3,4 haematological malignancies, and recurrent miscarriages.5,6
Conventional cytogenetics using Giemsa banding of metaphase chromosomes has not been very successful in identifying deletions or duplications of the subtelomeric regions of chromosomes, because most terminal bands are Giemsa negative. A set of clones that map to the subtelomeric regions of all human chromosomes, except the p ends of acrocentric chromosomes, has been developed for fluorescence in situ hybridisation (FISH).7–9 These allowed many telomeric rearrangements and deletions to be identified,10 but also detected several polymorphisms with no apparent phenotypic effect.11
An alternative approach is to assay directly for DNA copy number changes at each subtelomeric region. Here we apply multiplex amplifiable probe hybridisation (MAPH)12,13 to measure copy number changes at the subtelomeric regions of human chromosomes. MAPH relies on the fact that short probes can be recovered quantitatively and amplified after hybridisation to genomic DNA immobilised on a nylon filter. It has been used to identify a deletion of nearly the entire TBX5 gene as a cause of Holt-Oram syndrome,14 and as a screen for deletions in the DMD,15, PMP22, and BRCA1 genes (unpublished results). It has also been used in a preliminary study to examine the subtelomeric DNA of patients referred with idiopathic learning disability in Cyprus16 and confirm a deletion in one patient whose subtelomeric copy number was known a priori from FISH analysis. In this paper, we present a complete quantitative approach to MAPH analysis, using a new second generation probe set that can screen all chromosome ends in the human karyotype at once, except the p ends of acrocentric chromosomes. We have characterised this probe set on DNA samples from 83 unrelated controls to screen for copy number polymorphism with no phenotypic effect, on a number of subjects with subtelomeric DNA copy number changes previously detected by cytogenetic studies, and on a cohort of 37 subjects referred to the Clinical Molecular Genetics Laboratory at Nottingham for diagnostic testing of fragile X syndrome (MIM 309550, Online Mendelian Inheritance in Man (OMIM) http://www.ncbi.nlm.nih.gov/Omim). We have also adapted the MAPH technique to use gel electrophoresis equipment with fluorescence based detection. Finally, we show how appropriate statistical treatment of MAPH results can be used to screen large numbers of samples to identify those warranting investigation by further MAPH analysis, dosage multiplex PCR,17 or FISH analysis.
METHODS
DNA samples
DNA from a cohort of unrelated subjects, mostly Nottinghamshire and Derbyshire residents, and anonymous males selected from those referred to the Nottingham Clinical Molecular Genetics Laboratory for Fragile X DNA testing, was prepared using standard techniques. DNA samples with known subtelomeric imbalance were obtained from several sources: from University of Nijmegen Department of Medical Genetics at Nijmegen, The Netherlands (DMGN), as part of their clinical screening programme, from the Coriell Cell Repository (CCR) at Camden, New Jersey, USA, from the European Collection of Animal Cell Cultures (ECACC) at Salisbury, Wiltshire, UK, and from Sheffield Children’s Hospital, Sheffield, UK. All samples were collected under the appropriate ethical guidelines and ethics committee approval of each country.
MAPH probes
Probes for subtelomeric MAPH were prepared as previously described12 by subcloning fragments of PACs or cosmids mapped to subtelomeric regions, or direct cloning of specific amplicons. After cloning, each probe was sequenced using the BigDye terminator cycle sequencing kit and an ABI 377 Genetic Analyser, and any sequences not represented in the Genbank database were submitted (accession numbers AY061937-AY061940, see laboratory website for all probe sequences, http://www.nottingham.ac.uk/~pdzjala/maph/maph.html). Maximum distances of each probe from the telomere were estimated by noting the size of the half YACs from which each probe was ultimately derived,9 and linking the half YAC sequence to a physical map which included the BAC containing the probe sequence, as identified by BLAST. For nine chromosome ends (1p, 2p, 9q, 7p, 15q, 16q, 18p, 18q, and 19q), the distance between the probe and the telomere is represented by partially sequenced BACs, which may lead to an incomplete genome assembly and hence inaccurate estimates of distance.
MAPH
MAPH was carried out using 1 μg genomic DNA, with fluorescent detection of amplification products using ABI Prism technology with an ABI 377 DNA analyser, or with Amersham Pharmacia ALFexpress technology. Hybridisation and generation of a first round amplification product were performed as described previously.12
The first round amplification product was used to seed a further 20 μl amplification using 5‘ FAM labelled PZA primer or 5‘ Cy5 labelled PZA primer for detection by the ABI 377 and Pharmacia ALF respectively. After ethanol precipitation (for the ABI machine only) and addition of a formamide based loading buffer, amplification products were separated using PAGE LongRanger gels on the ABI 377, and bands quantified using GeneScan™. An arbitrary threshold of 1000 relative fluorescent units was set, so that if the average of the top two and bottom two bands was above that threshold, the result for that sample was deemed technically satisfactory. On the Amersham Pharmacia ALFexpress equipment, the amplification products were run on a ReproGel High resolution gel, and bands quantified using the packaged software.
Data processing and univariate analysis
Normalised ratios of signal strength, setting diploid dosage at 1.0, were calculated as previously described.12 Briefly, each band intensity was quantified by measuring the area under the peak, and that value was divided by the sum of the four nearest band intensities within that lane. This value represents band intensity relative to neighbouring bands, and, in the absence of copy number changes, was reproducible across samples. Dividing each relative band intensity value by the mean for that probe allowed a normalised ratio to be calculated with a mean of 1.0, equivalent to a dosage of two copies per diploid cell. Calculation of the standard deviation of the normalised ratios allowed each sample/probe combination to be represented by a Z value, corresponding to the number of standard deviations away from the mean of 1.0.
Bivariate analysis
For observations in duplicate (x,y), the correlation coeffiecient rxy , was calculated and a test statistic T(x,y) calculated for each value and compared with Cα , a value, unique to the data set from each probe, which describes the confidence ellipse of that data at a significance level of α.18 Details on calculating T(x,y) and Cα are available from the laboratory website. Where performed, all corrections to significance values to allow for multiple tests used the Dunn-idák method: α’ = 1 − ( 1 – α )k where α is the p value for a given result, and α’ is the p value for the given result, corrected for k tests.
All sample/probe combinations giving significant deviations using this analysis were examined in detail. Firstly, the gel tracking was checked and the peak allocation value was also checked to confirm that the software had recognised the equivalent peak to other lanes. The value was renormalised against a different set of bands within the same lane to ensure that variation in a neighbouring band, usually used for normalisation, was not causing the positive result. Finally, if the chromosome end had two representative probes in the probe set, the results from these were compared. For the analysis of patient samples, sample/probe combinations reported as retests were screened as above as well.
Dosage PCR
Fluorescent multiplex dosage PCR primers were designed to amplify the same subtelomeric segments that hybridise with the MAPH probes. One primer of each pair was labelled with 6-FAM fluorescent dye; 20 ng of genomic DNA was amplified in 20 μl reactions with 10 pmol of each of the appropriate primers. The cycling conditions were 95°C for one minute, 56°C for one minute, and 72°C for one minute, for 25 cycles using a Perkin Elmer 480 Thermal Cycler. A total of 1 μl of the amplification was loaded on an ABI 377 DNA sequencer with formamide based loading buffer and ROX500 size marker, and the bands quantified using GeneScan™ software. The sequences of all primers used are available from the laboratory website (http://www.nottingham.ac.uk/~pdzjala/maph/maph.html). Normalised band areas which differed from the mean with a one tailed significance of greater than 90% (p<0.1) were reported as positive.
RESULTS
We have applied multiplex amplifiable probe hybridisation (MAPH) to analyse DNA for subtelomeric copy number changes in one gel lane per sample. MAPH is a method that detects copy number changes by hybridising specific probes corresponding to the sequence of interest to immobilised genomic DNA, followed by quantitative recovery and amplification of these probes.12 All probes have shared primer binding sites for amplification, but the different sizes (between 100 and 600 bp) allow each probe, and hence each locus, to be resolved, identified, and quantified on a polyacrylamide gel. Normalisation of a probe of interest against probes with an expected dosage of two (in a diploid cell) allows relative dosage to be determined.
A probe set consisting of 47 probes was constructed with all chromosome ends represented by at least one probe, except the p ends of acrocentric chromosomes. Six ends are covered by more than one probe: XpYp, because each probe was known to detect independent but infrequent polymorphic deletions (unpublished work), 22q 19p, 12q, 19q, and 1p. Each probe was initially characterised on a small cohort of normal subjects using MAPH with radioisotopic detection, and sequenced before being incorporated in the final probe set. A table of the properties of each probe in the set is available at the laboratory website.
The probable distances of the probes from their respective telomeres was deduced by previous physical mapping (Human telomere mapping and sequencing project, University of Pennsylvania, http://www.wistar.upenn.edu/Riethman/, Joint Genome Institute chromosome 19 physical map, http://www.jgi.doe.gov), and from the human genome draft assembly (University of California, Santa Cruz Working Draft Human Genome Assembly http://genome.cse.ucsc.edu). Inconsistencies between the physical map and the assembly, and indeed between different assemblies, indicate that the human genome working draft contains extensive misassemblies at the ends of chromosomes. As the physical mapping and sequencing of the telomeres proceeds, replacement of these probes with sequences of known physical distance will be a priority for construction of the next subtelomeric probe set.
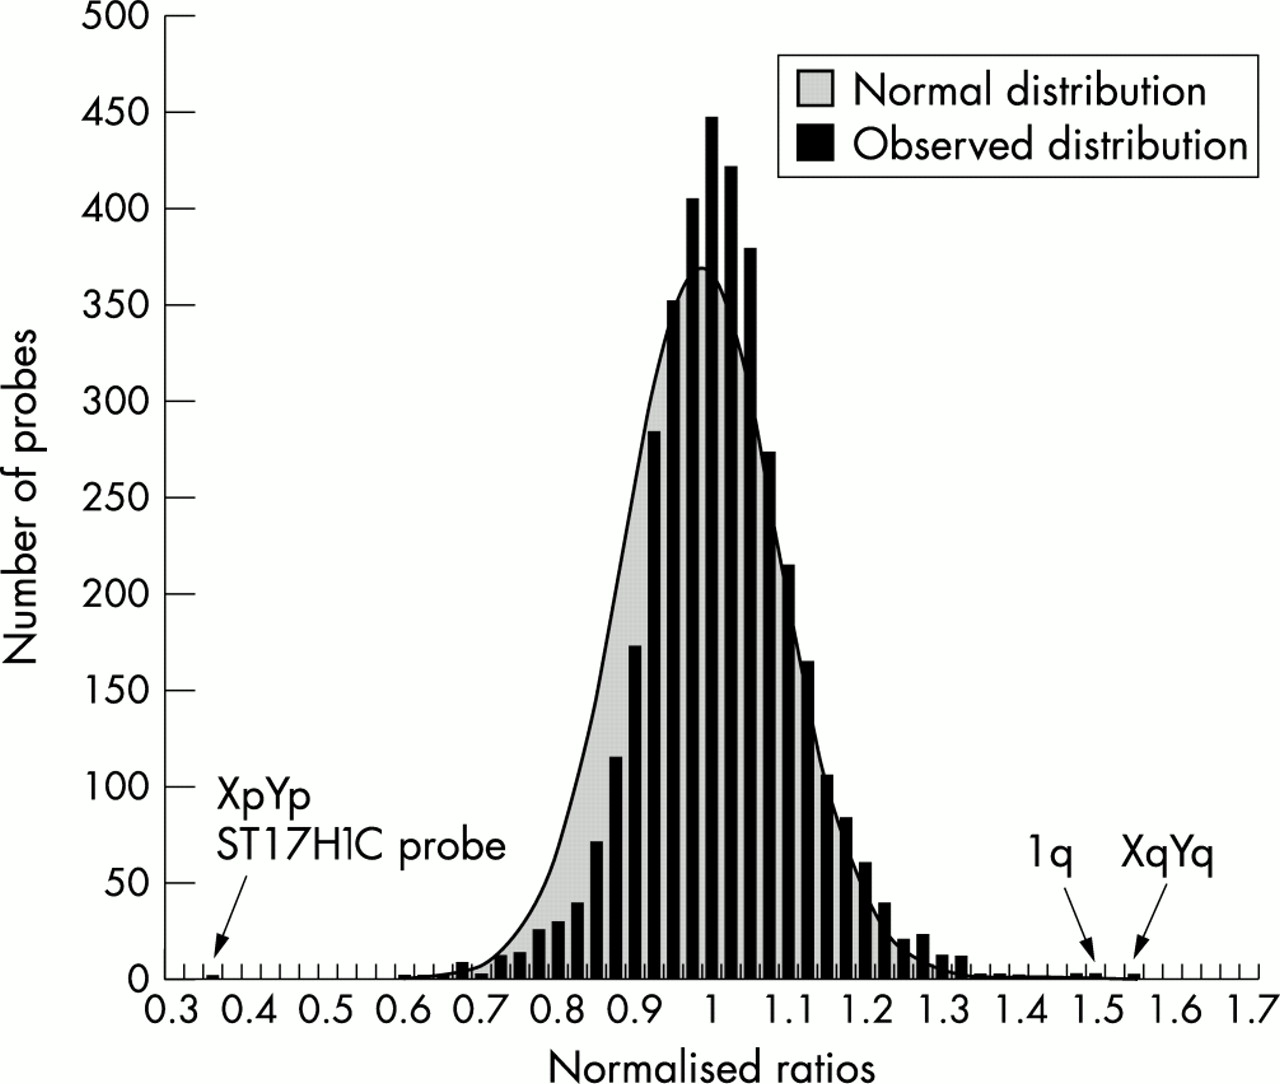
To characterise the probe set, DNA from 83 normal subjects was analysed in duplicate using the ABI 377 DNA Analyser. We tested each sample in duplicate to reduce the number of false positives and false negatives, and hence give more statistical power to the results. Our initial approach for analysing the data was to average the two normalised ratios for each sample/probe combination and plot these values as a histogram (fig 1). The mean and standard deviation of the distribution shown in the histogram were calculated, and the expected normal distribution using these calculated parameters is also shown in fig 1. It is clear that the data fit the normal curve reasonably well, but there is a slight skew resulting in conservative estimates of significance for deletions but more accurate estimates of significance for duplications. Several outliers were identified (fig 1), and dosage PCR confirmed the presence of an XqYq duplication (p=5.4 × 10⁻⁶) and a 1q duplication (p=3.2 × 10⁻⁹). The XpYp deletion is one of a range of XpYp polymorphisms found using MAPH (data not shown) and is only detected with one XpYp probe, ST17H1C, so was not confirmed by dosage PCR. Dosage PCR was used to verify these changes in preference to FISH as copy number changes involving small (<10 kb) segments, such as found in alleles at XpYp (unpublished work), would not be detected by large FISH probes.

Histogram of normalised ratios of 83 normal subjects. For all probes, the average of the two normalised ratios from normal subjects tested in duplicate are displayed as a histogram, with calculated mean and standard deviation of the distribution at 1.0 and 0.1015 respectively. A normal (Gaussian) distribution using these two values is shown in grey. One subject was heterozygous for a deleted allele at one XpYp locus and two others had apparent heterozygous duplications of the 1q sequence and XqYq sequence. These normalised ratios are indicated by arrows.
Control samples with known subtelomeric copy number changes were used to verify the dosage response of 14 probes (table 1). These positive controls had been phenotyped by FISH using the subtelomeric probe set available (Cytocell), except the DNA from CCR and ECACC where only G banded karyotypes were available. Table 1 shows the probes for which positive controls were available, together with the p values of each observation. Fig 2 shows analysis of an unbalanced 3p−;16q+ translocation carrier as a positive control, together with a normal negative control.
Subtelomeric copy number changes identified in positive controls

Fluorescent output of MAPH analysis. The lower panel shows results of MAPH analysis on a normal subject, and the upper panel shows MAPH analysis of a subject with an unbalanced 16q;3p subtelomeric translocation previously characterised by FISH. Each blue peak corresponds to a FAM labelled PCR product generated from a recovered MAPH probe after hybridisation. The peaks showing the copy number changes (16q+ and 3p−) are indicated, and the mean significance value of four replicates. The mean normalised ratios (SD) were 1.32 (0.021) for the 16q+, and 0.495 (0.028) for the 3p−. The smaller red peaks labelled M represent ROX labelled marker fragments used to generate the size scale on the x axis.
The analysis method described above is only suitable when the probe/sample values are independent of each other every time they are tested in independent experiments. To determine whether duplicate values for a specific sample were independent of each other, the correlation statistic r was calculated for each probe from the 83 pairs of observations of the normal subjects. This statistic was significantly different from 0 (H0, no correlation, p<0.05) for 34 of the 47 probes. Because duplicate results are not completely independent, hypothesis testing using the average of two values, as shown in fig 1, is not a valid method for further data analysis.
We therefore applied a bivariate statistical analysis approach to the data from the 83 normal subjects to correct for this observed correlation effect. The duplicate results for each probe were plotted on a scatter graph, and an ellipse calculated for a specific confidence limit around (1.0,1.0) (for the normal values), (0.5,0.5) (for any deleted values), and (1.5,1.5) (for any duplicated values). If the value was outside all ellipses, or in the intersection of two ellipses, it was reported as a “retest”. If the value is inside the duplication or deletion ellipse only, then it is reported as a “positive”. If the value is within the normal ellipse only, it is reported as “normal”. Further statistical methods are available from the laboratory web site. An appropriate confidence limit for the normal ellipse (which is equivalent to the false positive rate) was calculated by iteration to minimise the number of retests reported by the analysis. This value was found to be 1.7 × 10⁻⁵ per probe per sample, equivalent to 0.0008 (0.08%) when corrected for multiple probes, and resulted in a total of 6.37% of observations being reported as positives or retests. Any “positive” samples were then tested by dosage PCR. A false negative rate was set at 1% for deletions and 1% for duplications. The outliers identified in the univariate analysis were classed as retests by the bivariate analysis.
We used the methods developed above to screen patients with learning disability to examine whether MAPH could detect copy number changes in subjects whose subtelomeric DNA would not normally be analysed. Thirty-seven DNA samples from patients referred to the Nottingham Clinical Molecular Genetics Laboratory for diagnostic testing for the fragile X syndrome, but who had no FRAXA repeat expansion, were tested in duplicate using the ABI 377 and in duplicate by ALFexpress technology. The results were assembled to give 74 results in duplicate. These were then analysed using the same false negative and false positive parameters used for the analysis of the 83 normal controls, with the results classified into normal, retest, and positive results. If one analysis was reported as a positive, and the other as a retest, the sample was classified as a positive. Two samples had very high results for the 9q probe owing to a gel artefact, which caused all samples to be reported as retests. Therefore, the 9q probe produced no reliable data and was excluded from further analysis. All positives and retests were then tested by dosage PCR. To conform to local ethical guidelines, these DNA samples were collected and tested anonymously, making it impossible to collect cells for cytogenetic diagnosis or to identify the proband’s parents.
There were 65 sample/probe combinations (out of a possible 1480) that were classed as a retest in both the ALF and ABI data sets, and four loci that were classed as a positive in the ALF/ABI and a retest in the other. All “positive” results and retests were tested by dosage PCR (table 2) and six (three deletions and three duplications) were confirmed as true positives. The corresponding overall false positive rate was 3.99%. Among the confirmed positives, the 7q− and 16q− deletions not only gave the lowest p values in both MAPH tests, but were also identified as a genuine positive instead of a retest in one of those MAPH experiments. Terminal 7q deletion has been reported to be associated with holoprosencephaly 3, which has learning disability as a symptom (MIM 142945).19 This was later shown to be the result of deletion of the SHH gene,20 but we have not determined the extent of the 7q deletion in this person. Similarly, 4p terminal deletions (as identified in sample A16) have been associated with the closely related Pitt and Wolf-Hirschhorn syndromes (MIM 262350, 194190), both conditions that have learning disability as a clinical phenotype. The 16q− deletion in sample B1 is accompanied by 3p duplication, suggesting that this may be an unbalanced translocation. However, for all of these observations, only FISH analysis could act as definitive confirmation of these subtelomeric changes.
Subtelomeric copy number changes identified in patients
DISCUSSION
We have shown that a new technique, MAPH, can be used to identify copy number changes in subtelomeric DNA. It has several advantages over FISH based methods, in that it does not require metaphase chromosomes, can analyse all unique chromosome ends simultaneously, and one polyacrylamide gel can analyse 45 samples. These combine to give the technique a very high throughput with a much lower cost per sample compared to FISH. In addition, repeat testing is straightforward and strengthens statistical analysis of the results. MAPH compares favourably with other techniques used for subtelomeric DNA screening. Inheritance at short tandem repeat polymorphisms (STRPs) has been used to detect copy number changes at subtelomeric regions,21–23 but this technique depends on the informativeness of the STRPs used, needs DNA samples from parents, may miss duplications, and requires multiple PCRs to screen each karyotype. A recent paper applied array comparative genomic hybridisation (array-CGH) to screen for subtelomeric copy number changes.24 Using the published data, we calculate that triplicate testing of each sample should result in a false positive rate of 4.6%, assuming independence between results. However, the authors routinely removed noisy data, so the unselected false positive rate may be closer to that using MAPH. Array-CGH also requires expensive equipment and consumables, an important fact when high throughput screening is proposed. Multiplex ligation dependent probe amplification (MLPA) is a method similar to MAPH that could be applied to detect subtelomeric DNA copy number changes, but there are no published data on subtelomeric screening.25
We have applied MAPH to study a cohort of patients, and have identified six subtelomeric copy number changes in five patients that were confirmed by fluorescent dosage PCR (13.5% of the total number of patients screened). In a diagnostic setting, the technique is best suited as a screening method for the many samples for which current analyses are uneconomical, and using FISH analysis of reported samples as a “gold standard” of diagnosis. Because of the many loci that are analysed simultaneously, the fairly high false positive rates can cause a significant number of loci to be reported, especially if many different samples are analysed together. Nevertheless, the method can still be very useful in reducing the FISH workload by 96% and focusing on the 4% of loci that are likely to show a copy number change. The false negative rate is important for such a situation. By using appropriate confidence thresholds for calling deletions and duplications in bivariate or univariate analysis, we can adjust the expected false negative rate. In this study we have set this false negative rate (the probability of a genuine copy number change not being detected) at 2%. The impact of this value depends on the frequency of genuine copy number changes expected in the cohort that is analysed. The frequency of subtelomeric rearrangements in subjects with idiopathic learning disability has been reported to be around 6%,3 which would result in about 0.012% of a cohort of mentally retarded patients being wrongly reported as having no subtelomeric copy changes. This assumes that subtelomeric rearrangements are copy number changes; since MAPH can only detect net copy number changes it cannot detect balanced translocations or inversions where no net loss or gain of DNA has occurred. More recent studies find different frequencies of subtelomeric rearrangements in patients with learning disability. Using a combination of G band cytogenetics and subtelomeric FISH, Vorsanova et al26 reported that 3.8% of patients with learning disability have subtelomeric rearrangements, although a more recent study suggests that the value may be as high as 9%.27 Knight et al28 emphasised the importance of patient selection when conducting studies of this type. By dividing patients into two classes, mild learning disability and moderate to severe learning disability, the frequency of subtelomeric rearrangements in the two groups was 0.5% and 7.4%, respectively. Another report has suggested that subtelomeric rearrangement is not a significant cause of learning disability, and may be found at polymorphic frequencies in the general population.29 A recent review of published data30 suggests that the initial study by Flint et al3 reporting an overall frequency of 6% may be about right. To obtain an accurate assessment of the frequency of subtelomeric rearrangements, a very large sample of patients selected using the same clinical criteria must be assayed. Using FISH alone, this would be extremely laborious and time consuming, but the ability of MAPH to act as a screen before FISH makes this approach practical. It is also likely that, by using MAPH, smaller subtelomeric copy number changes, previously undetected by cytogenetic methods, will be reported.
As the human genome project generates a more accurate assembly of sequence near the telomere of each chromosome, it will be possible to design single copy probes that are as near the telomere as possible. The position of these will be a compromise between proximity to the telomere and ability to recognise single copy sequences, since on most chromosome ends the subtelomeric DNA consists of multicopy sequences shared between chromosomes immediately after the telomeric repeat, followed by the gene rich single copy DNA.1 A third generation set of probes will ideally have several probes at each chromosome end so an estimate of the extent and position of each copy number change could be determined.
Acknowledgments
We would like to thank Ingrid Davies for the ABI GeneScan™ gel runs, John Brookfield, William Brown, Jonathan Flint, Colin Armstrong, and Anita Mistry for useful discussions, and Johan den Dunnen at the Leiden University Medical Centre for making the authors aware of their work before publication. DNA samples were provided by Jackie Langdon at the University of Nottingham, Carolina Sismani and Philippos Patsalis at the Cyprus Institute of Neurology and Genetics, Nicosia, Erik Sistermans at the University of Nijmegen, and Nora Shannon at the Sheffield Children’s Hospital. We would also like to thank James Cavey and Abid Sharif for technical assistance. This work was funded by a Wellcome Trust grant (number 060578) to JALA. Supplementary information relating to this study can be found at http://www.nottingham.ac.uk/~pdzjala/maph/maph.html