Article Text

Abstract
Background BRCA carrier identification offers opportunities for early diagnoses, targeted treatment and cancer prevention. We evaluate BRCA- carrier detection rates in general and Ashkenazi Jewish (AJ) populations across Greater London and estimate time-to-detection of all identifiable BRCA carriers.
Methods BRCA carrier data from 1993 to 2014 were obtained from National Health Service genetic laboratories and compared with modelled predictions of BRCA prevalence from published literature and geographical data from UK Office for National Statistics. Proportion of BRCA carriers identified was estimated. Prediction models were developed to fit BRCA detection rate data. BRCA carrier identification rates were evaluated for an ‘Angelina Jolie effect’. Maps for four Greater London regions were constructed, and their relative BRCA detection rates were compared. Models developed were used to predict future time-to-identify all detectable BRCA carriers in AJ and general populations.
Results Until 2014, only 2.6% (3072/111 742 estimated) general population and 10.9% (548/4985 estimated) AJ population BRCA carriers have been identified in 16 696 608 (AJ=190 997) Greater London population. 57% general population and 54% AJ mutations were identified through cascade testing. Current detection rates mirror linear fit rather than parabolic model and will not identify all BRCA carriers. Addition of unselected ovarian/triple-negative breast cancer testing would take >250 years to identify all BRCA carriers. Doubling current detection rates can identify all ‘detectable’ BRCA carriers in the general population by year 2181, while parabolic and triple linear rates can identify ‘detectable’ BRCA carriers by 2084 and 2093, respectively. The linear fit model can identify ‘detectable’ AJ carriers by 2044. We did not find an Angelina Jolie effect on BRCA carrier detection rates. There was a significant difference in BRCA detection rates between geographical regions over time (P<0.001).
Conclusions The majority of BRCA carriers have not been identified, missing key opportunities for prevention/earlier diagnosis. Enhanced and new strategies/approaches are needed.
- Brca
- genetic testing
- time to detection
- prediction
- detection rate
Statistics from Altmetric.com
Introduction
Mutations in BRCA1/BRCA2 genes are associated with a high risk of breast cancer (BC) and ovarian cancer (OC) in women, as well as elevated risk of prostate and male BC in men.1–3 Identifying carriers is important, because it offers the opportunity of early diagnosis and/or prevention to reduce the burden of BRCA-associated cancers in the population. Additionally, BRCA carriers who develop cancer can be offered new targeted treatments such as poly ADP ribose polymerase (PARP) inhibitors. For known mutation carriers, there are a number of risk management options like preventive surgery for BC/OC,4 5 screening for BC,6 chemoprevention with selective oestrogen-receptor modulators,7 lifestyle and reproductive advice incorporating breast feeding, contraception and opportunity to inform reproductive decision making, including preimplantation genetic diagnosis.8 9 The importance of prevention is magnified by the increasing costs of new drugs/treatment and persistent poor OC survival rates. Additionally, the number of OC and BC cases are expected to rise by 27% and 24%, respectively, in the UK and 55% and 55%, respectively, globally by 2035, leading to an increase in overall burden of disease.10
Over the years, health services have provided BRCA1/BRCA2 testing using predominantly family history (FH) based clinical criteria, with testing offered through specialised genetic services at BRCA1/BRCA2 mutation probability thresholds of initially 20%, and subsequently this was reduced to a probability threshold of 10%.11 12 Several risk models/clinical criteria13–15 are widely used to calculate these probabilities to identify individuals eligible for testing. This strategy is dependent on people and their doctors being aware of their FH and acting on it, accuracy of FH, communication within/between families and timely referrals to clinical genetics.
To date, the performance of a health service in detecting BRCA1/BRCA2 mutations compared with the estimated prevalence for an entire population in a large geographical area has not been assessed. We report on the BRCA1/BRCA2 detection rates across the entire Greater London and bordering areas population since National Health Service (NHS) testing began from 1995 to 2014. We evaluate the carrier identification rate across four geographical areas covered by NHS London regional genetic services (RGS). We also for the first time forecast the time to pick up all identifiable BRCA1/BRCA2 carriers in the Greater London and bordering areas population using current clinical protocols. These analyses are undertaken separately for both Ashkenazi Jewish (AJ) and non-AJ general populations.
Methods
Data on BRCA1/BRCA2 carriers identified by genetic testing through the NHS London genetics laboratories between August 1993 and November 2014 were obtained from laboratory records and databases. This included date of test, carrier postcode, AJ ethnicity (self-reported) and mutated gene (BRCA1/BRCA2).
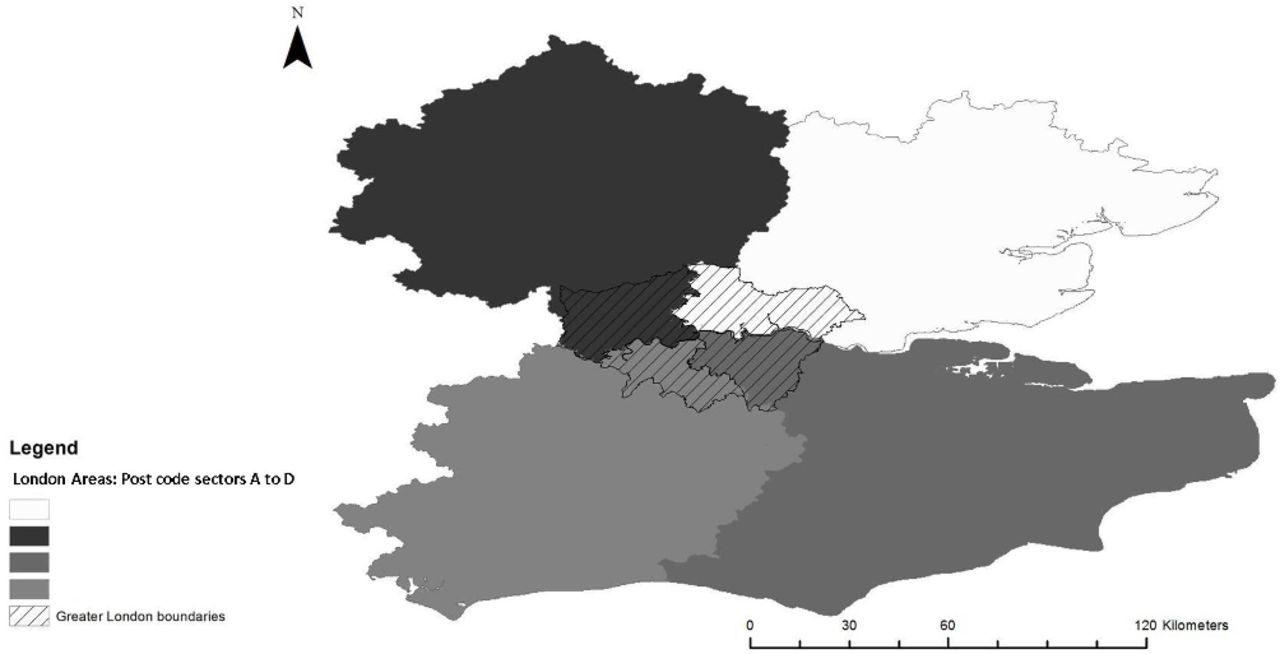
The first stage was to map the number of carriers identified in London by NHS providers over this period. In London, four NHS RGS and an independent NHS cancer genetics centre provide clinical genetics care to a Greater London and bordering areas population. Each of the four RGS covers a distinct area (A, B, C and D) comprising of a set of different postcode sectors.16 People are referred to the relevant RGS depending on their postal address that falls in one of the postcode sectors. The independent NHS genetics centre received referrals from all four areas (A, B, C and D). We constructed the map of these four coverage areas (A, B, C and D) based on postcode sectors, using ArcGIS V.10.4 software (figure 1). Postcode data of identified carriers were matched to all known Greater London and bordering areas postcodes in areas A, B, C and D. BRCA carriers identified by the genetic laboratories from outside these four catchment areas were excluded from the analysis.

Map of Greater London coverage areas (A, B, C and D: postcode areas covered in the analysis).
These detection rate data were compared with modelled estimates of the number of carriers in each area. Incorporating information from improved/contemporary sequencing technologies, updated mutation pathogenicity and modifications in penetrance, we recently estimated that BRCA1+BRCA2 prevalence in the general population to be 0.00677 (95% CI 0.0059 to 0.0077).17 These estimates are in line with data from cancer-free women controls from the Australian Lifepool study.18 AJ population data were obtained from our Genetc Cancer Prediction through Population Screening (GCaPPS) study, which found BRCA prevalence to be 0.0261 (95% CI 0.0173 to 0.0378).19 A number of BRCA carriers are missed by current clinical criteria that are based on risk levels determined by FH. Recent estimates suggest only approximately 50% of general and 44% of AJ BRCA1/BRCA2-carriers19 are ‘detectable’ using current clinical genetics criteria. Population density data by boroughs and postcodes in the mapped Greater London areas were obtained from the Office for National Statistics (ONS) database. Data were obtained separately for both AJ and non-AJ general populations. The Greater London population served by the NHS RGS was estimated to be 16 696 608, of whom 190 997 are self-reported AJ (2011, ONS census).20 Thus, the detectable number of BRCA1/BRCA2 carriers in the general population is=16505611*0.00677*0.5 (95% CI 16505611*(0.0059)*0.5 to 16505611*(0.0077)*0.5). The identifiable number of BRCA1/BRCA2 carriers in the AJ population is=190 997*0.0261*0.44 (95% CI 190997*(0.0173)*0.44 to 190997*(0.0378)*0.44).
To forecast the length of time from 2015 onwards it would take to detect all carriers using current clinical criteria, we first plotted detection curves of the number of carriers detected by time (figure 2). We then developed two different prediction models (parabolic and linear) in the general and AJ populations to fit the BRCA carrier detection rate data in the four geographical catchment areas (A, B, C and D). The first parabolic model (equations below) fits the entire data set and reflects the dynamics of all carriers detected per year since testing began. However, detection rates appear constant for the last 6–8 years. The second linear model (equations below) is fitted only for part of the data where the detection slope became close to constant, that is, from year 2008 onwards for the general population and 2006 onwards for the AJ population (figure 2A, B). The models were then used to predict time taken to identify all ‘detectable’ BRCA carriers in the general and AJ populations from the year 2015 onwards. The modelling takes into account the change in population over time. We assume the population would change at the rate of change seen between 2001 and 2011 UK census.20 21 Census data indicate the general population would increase by 93 334/year, and the AJ population would decrease by 394/year across geographical areas A, B, C and D.
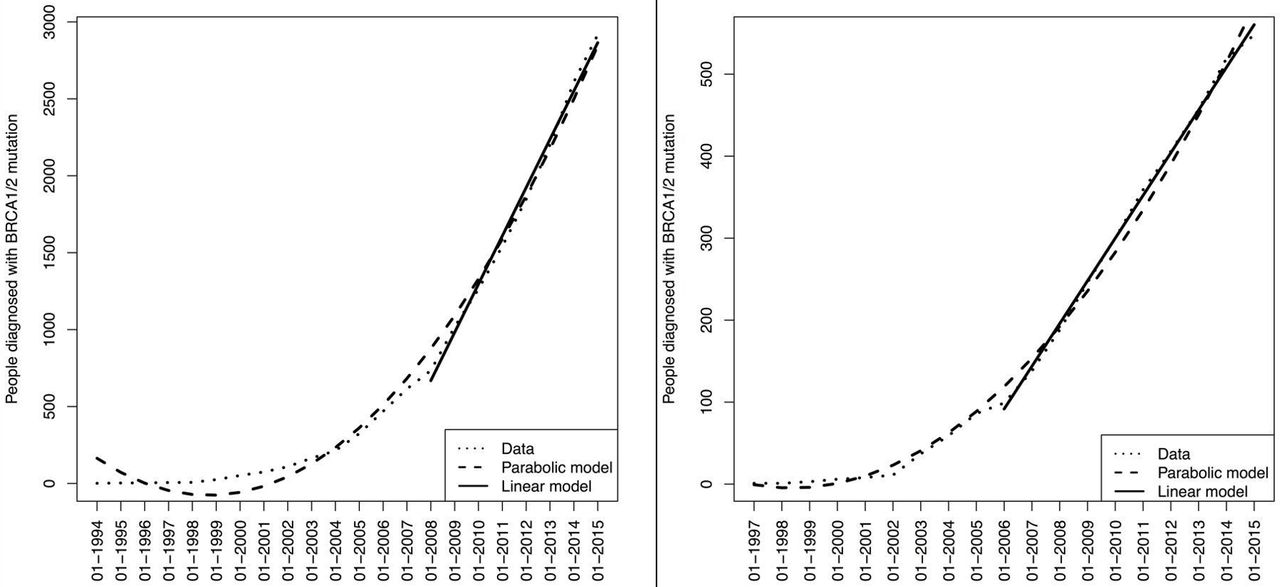
Number of carriers identified by time in the general and Ashkenazi Jewish populations in London and Greater London. (A) Number of carriers identified by time in the general population in London and Greater London. The figure shows the fit of linear and parabolic curves to the BRCA carrier detection rate data in general population. X axis: number of carriers detected. Y axis: date of detection. (B) Number of carriers identified by time in the Ashkenazi Jewish population in London and Greater London. The figure shows the fit of linear and parabolic curves to the BRCA carrier detection rate data in the Ashkenazi Jewish population. X axis: number of carriers detected. Y axis: date of detection.
For the general population, parabolic fit for total BRCA carriers detected is  (where x=1 year step from January1993). While for the linear fit,
  (where x=1 year step from January 2008) curve provided best fit for the data. For the AJ population, the parabolic fit was
  where x=1 year step from January 1996, while for the linear fit,
  approximated the data best, where x=1 year step from January 2006. Figure 2A, B shows linear/parabolic function curves fitting the data. In addition to the linear fit that reflects current detection rate, the time taken with doubled and tripled detection rates compared with the current linear rate were also explored for general and AJ populations. Precise date-of-detection was missing for 163 (5.5%) general population carriers, and these were excluded from model development.
The relative detection rates observed for people living across the four geographical areas A, B, C and D (adjusted for total population in each area) were compared over time. Mann-Whitney U test was performed for the carriers detected in quarter-year windows, adjusted for the total population in each of the four geographical areas A, B, C and D. A sensitivity analysis was also undertaken assuming missing RGS status data from each genetic laboratory is distributed among the four areas in the same proportion as available data (online supplementary table S1) .
Supplementary file 1
Angelina Jolie’s publicised decision to undergo a risk-reducing mastectomy created a media storm and public frenzy around BRCA testing. We evaluated our data for an ‘Angelina Jolie’ effect: change in detection rate after she underwent risk reducing mastectomy on 16 February 2013.
Results
Between 1993 and 2014, NHS genetic laboratories identified 3297 BRCA1/BRCA2 carriers in the general population and 575 in the AJ population. Twenty-seven AJ and 225 general population BRCA carriers lived outside the RGS catchment areas and were excluded. Date of detection was available for 2916 of 3072 general and 548 AJ carriers residing in Greater London/bordering areas. Of these 57% (1589/2798) general and 54% (266/491) AJ mutations were identified through cascade testing (testing a known mutation in the family). Three general population and six AJ carriers had mutations in both BRCA1 andBRCA2 genes. Overall 51%/62% BRCA1% and 49%/37% BRCA2 carriers belonged to general/AJ populations, respectively. The BRCA carrier detection curves over time for general and AJ populations are given in figure 2A, B, respectively. The estimated ‘total’ prevalence of BRCA carriers in Greater London (areas: A, B, C and D) is 111 742 (95% CI 97 383 to 127 093) in the general population and 4985 (95% CI 3304 to 7220) in the AJ population. Of these, the ‘detectable’ number using clinical criteria is estimated as 55 872 (95% CI 48 692 to 63 547) in the general and 2193 (95% CI 1454 to 3177) in the AJ population, respectively. The residual 55 870 general and 2792 AJ carriers remain undetectable.
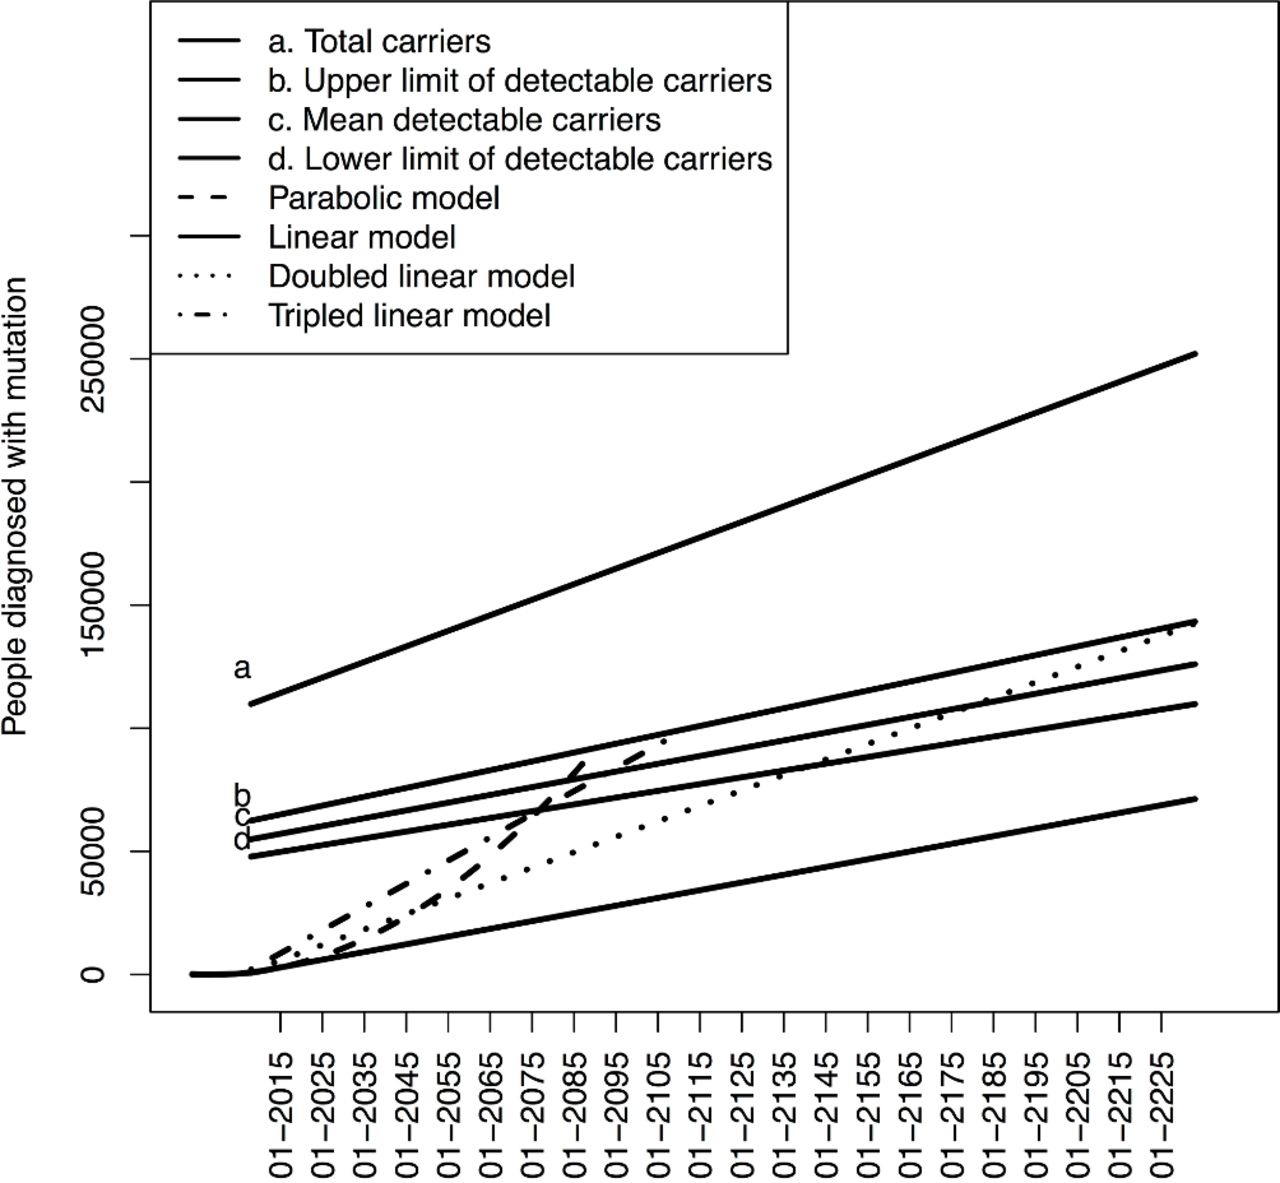
Figure 1 shows a map of the Greater London and bordering postcodes lying within the four geographical areas A, B, C and D. Table 1 provides the overall population and estimated carrier distribution across these four areas. Figures 3 and 4 depict the forecasting models of the time-to-detect the remaining BRCA carriers from 2015 onwards for the general and AJ populations, respectively, across the Greater London and bordering areas. Each figure shows outcomes of linear and parabolic models and also where the linear rate is doubled or tripled. Line ‘a’ reflects the total estimated carriers in the population and line ‘c’ reflects the ‘detectable’ carriers. ‘Line-a’–‘Line-c’ denote the unidentifiable pool of BRCA carriers using FH-based clinical criteria. The current NHS detection rate mirrors the linear function as the slope is near constant over the last 8 years (figure 2A, B). Continuing at the current 2014 NHS detection rate will not be able to identify the ‘detectable’ BRCA-carriers in the non-AJ general population. Doubling these rates will enable identification of ‘detectable’ BRCA carriers by the year 2181 (95% CI 2141 to 2228), while the parabolic and triple linear rates can identify the ‘detectable’ BRCA carriers in the population by 2084 (95% CI 2077 to 2091) for parabolic or 2093 (95% CI 2077 to 2112) for tripled linear rate. The current detection rate for AJ carriers will identify ‘detectable’ carriers by 2044 (95% CI 2032 to 2060), while doubling this linear rate can do so by 2025 (95% CI 2019 to 2034).
Population and estimated BRCA carrier distribution by four London areas A, B, C and D

Time-to-detection from 2015 onwards for the remaining estimated BRCA carriers in the general population across London and Greater London. Figure 3 shows the predicted time-to-detection outcomes of parabolic, linear, double linear and triple linear prediction models for BRCA carriers in the general population. Line a reflects the total estimated carriers in the population. Line c reflects the detectable carriers. Lines b and d are the upper and lower confidence limits for line c, respectively. Lines a–c reflect the unidentifiable pool of carriers using FH-based clinical criteria. The detectable BRCA carriers in the general population cannot be identified by the linear model. A double linear rates will enable identification of ‘detectable’ BRCA carriers by the year 2181 (95% CI 2141 to 2228). The parabolic and triple linear rates will identify the ‘detectable’ BRCA carriers in the population within 100 years. This will occur by the year will be 2084 (95% CI 2077 to 2091) with the parabolic or year 2093 (95% CI 2077 to 2112) with the tripled linear rate model. FH, family history.

Time-to-detection from 2015 onwards for the remaining estimated BRCA carriers in the Ashkenazi Jewish population across London and Greater London. Figure 4 shows the predicted time-to-detection outcomes of parabolic, linear, double linear and triple linear prediction models for BRCA carriers in the Ashkenazi Jewish (AJ) population. Line a reflects the total estimated carriers in the AJ population. Line c reflects the detectable carriers. Lines b and d are the upper and lower confidence limits for line c, respectively. Lines a–c reflect the unidentifiable pool of carriers using family history-based clinical criteria. The linear fit model can identify detectable carriers by the year 2044 (95% CI 2032 to 2060). The doubled linear rat model can do so by year 2025 (95% CI 2019 to 2034), and tripling it could do so by year 2019 (95% CI 2014 to 2025). The parabolic model could potentially detect the detectable carriers by year 2030 (95% CI 2025 to 2037).
The detection rates of BRCA carriers over time across the four areas A, B, C and D are plotted in online supplementary figure 1a, b for general and AJ populations, respectively. Corresponding RGS area status information was missing for 22 (4%) AJ and 675 (23%) general population BRCA carriers. Hence, the analysis comparing rates across different areas A, B, C and D is limited to 96% AJ and 77% general population carriers. Comparisons of the mean performance in quarter-year windows (as a ratio from all detectable carriers) are presented in table 2. There was a significant difference in BRCA carrier identification rates among people living across the four areas A, B, C and D over time.
Supplementary file 2
![[SP2.jpg]](https://jmg.bmj.com/content/jmedgenet/55/8/538/DC2/embed/inline-supplementary-material-2.jpg?download=true)
Comparison of BRCA identification rates across four London areas A, B, C and D
Although we saw a numerical increase in the average quarter-year BRCA detection rates in the 18 months after compared with 18 months before ‘Angelina Jolie’s’ mastectomy, this was not statistically significant for either the general (100 vs 85.7,P=0.059) or AJ populations (13 vs 12.8,P=0.612).
Discussion
We for the first time report on NHS BRCA carrier identification rates across the Greater London/bordering population over time. Over the years, only 2.6% of total estimated carriers and 5.1% of detectable carriers have been identified in the general population. Greater success has been achieved in the AJ population with 10.9% of total estimated and 24.9% of detectable AJ carriers being identified. Nevertheless, the significantly large majority of BRCA carriers at high risk of cancer remain to be identified. Although the parabolic model has a steeper curve and quicker detection than the linear model, the current detection rates mirror a linear slope far more rather than a parabolic one. Continuing at the 2014 identification rate, the NHS is unable to identify the ‘detectable’ pool of BRCA carriers in the general population, while it will take 30 years to identify the ‘detectable’ BRCA carriers in the AJ population. However, we expect the current detection rates to increase given the lowering of the BRCA1/BRCA2 probability threshold for genetic testing to 10% in 2013 and the recent introduction of mainstreaming of BRCA1/BRCA2 testing for OC cases. The full impact of this will emerge over the next few years and is therefore probably underestimated in our base case analysis. Nevertheless, even if the rate doubled it will take ~167 years to identify the detectable pool of BRCA carriers and if it tripled it could still take 79 years, with an exponential parabolic increase making it 70 years to identify ‘detectable’ BRCA carriers in the general population. To expect a tripling or exponential increase is unrealistic. Most of the carriers who do not fulfil FH-based clinical testing criteria will however remain undetected. Various reasons for historic lower detection rates include poor performance characteristics of clinical criteria (limited sensitivity), less sensitive molecular tests, paternal inheritance, small family size, incomplete penetrance, poor communication within/between families, population migration, poor physician/health professional awareness, poor referral guideline implementation by non-genetic/primary care clinicians, limited public awareness and population preferences.19 22 The rate of detection currently being achieved is not adequate to maximise BRCA carrier identification for cancer screening and prevention.
Around 10% epithelial OC23 (84% of OC)24 and 9.8% triple-negative (TN) BC25 (13.5% of BC)25 unselected for FH have BRCA mutations. Testing is now advocated in them from 2015 in the UK.26 This approach will also enable identification of BRCA carriers lacking a strong FH. Our study population comprises 26.4% of the UK population.20 Assuming proportionate UK annual OC and BC incidence in our population (OC incidence=0.264*7400; TNBC incidence=0.264*55200)27 28 and two additional carriers identified from cascade testing29 for each index case, we incorporated the additional impact of testing all epithelial OC and TNBC in the models to detect ‘total’ BRCA carriers in the population. Addition of testing epithelial OC/TNBC at cancer diagnosis to current detection rates will take >250 years (2286) to identify the ‘total’ BRCA carriers in the general population. Coupled with the doubled linear fit, tripled linear fit and parabolic fit, ‘total’ BRCA carriers could be detected by 2226, 2181 and 2128 respectively. Hence, even if ‘everyone’ is tested at cancer diagnosis, it will take an inordinately long time to identify all at-risk BRCA carriers.
Our study has a number of advantages. We incorporate data since NHS BRCA testing began. We use most recent estimates of BRCA1/BRCA2 mutation frequencies for the AJ19 and general populations17 and incorporate the potential change in population size over time. Limitations include exclusion of any BRCA testing in the private sector. Unfortunately, these data are unavailable/inaccessible. However, most BRCA testing in the UK health system is undertaken through the NHS. The private health sector is minuscule compared with the public NHS. According to the King’s fund, only ~11% of UK residents have some private medical insurance. However, that does not equate to 11% of BRCA testing being done privately and the proportion of private BRCA testing is probably much lower. A sensitivity analysis assuming 11% additional BRCA carriers identified through other sources indicates that doubling or tripling the linear model would detect general population carriers by 2146 (95% CI 2116 to 2185), or 2080(95% CI 2067 to 2095), respectively. Additionally, all identifiable AJ BRCA carriers could be detected by 2040 (95% CI 2029 to 2055). This does not majorly shift the time-to-detection estimates predicted using our models. We cannot account for predictive testing undertaken by family members living outside London. However, the analysis incorporates cascade testing of London-based individuals whose familial mutation may have been diagnosed outside London. Unlike some reports, we did not find an ‘Angelina Jolie’ effect translating to a higher carrier detection rate.30 Nevertheless, this is consistent with other findings of increased genetic testing referrals from the worried well, with many such indivdiuals not fulfilling clinical testing criteria.31
Our analysis is not limited/restricted by age of testing. Our data set had anonymised data without date of birth or age distribution of carriers. This may be considered as a limitation by others. However, predictive presymptomatic testing for BRCA mutations is currently offered in the UK from the age of autonomous consent, that is, 18 years.32–34 This is consistent with many international guidelines.35–39 This is a time series analysis spanning up to 250 years in the prediction models. Within 18 years’ time someone who is <1 year old will become eligible for testing. Limiting testing to say ≥30 years in our view is a paternalistic approach. Potential clinical benefits for testing between the ages of 18 and 30 years include the opportunity to make contraceptive, lifestyle and reproductive choices including Preimplantation Genetic Diagnosis (PGD) that can minimise risk. Earlier awareness can help decision making in some women who may choose to complete their families earlier so as to have timely surgical prevention later. Taking the pill at younger ages (rather than >30 years) at a lower absolute risk of BC will have a lower detrimental impact on BC risk while providing the benefit of OC risk reduction. Experience from clinical practice as well as our population testing research trials support and show acceptability of genetic testing from 18 years.19 40 41 There is no upper age limit for BRCA testing in the UK. The annualised risk of developing OC is ~1% per annum in the older age group. The average life expectancy in women is ~85 years, and statistically this is even greater in older women. Hence, the residual risk is still high enough to offer surgical prevention and many older women aged >70–75 years attending our clinics opt for this. Forty per cent of OCs occur in the >70 years age group and 28% in the >75 years age group.42 BRCA carrier identification even in older women offers the opportunity for predictive/cascade testing for other unaffected family members with implications for screening/prevention and cancer risk reduction. Additionally, this has implications for their care with respect to improving survival through use of drugs like PARP inhibitors. Hence, for these reasons we feel the analysis should not be restricted by age.
Our data show regional differences in identification of BRCA carriers across London. Identification rates were higher among AJ and general population people living in C and D postcode sectors than those within areas A and B. A limitation of the analysis is incomplete RGS data for 23% general population carriers. However, a sensitivity analysis assuming proportionate attribution of RGS to these 23% carriers detected does not change the variation in carrier identification rates observed between different London regions (online supplementary table 1 and figures 2, 3). The precise reasons for why apparently more people living in areas C and D come forward for testing compared with areas A and B cannot be evaluated through this analysis and require further study. We had access to limited anonymised data and lacked broader individual carrier level variables/factors to properly analyse socioeconomic or population factors affecting testing uptake across different areas. We also lacked information on total number of BRCA tests undertaken (including those testing negative). There are socioeconomic differences in populations across different London areas. The Index of Multiple Deprivation incorporates seven domains to produce an official measure for relative deprivation across small areas. The majority of the London areas present among the 20% most deprived in the country are represented across area A postcodes, followed by area B and then area C. The least deprived being in area D postcodes.43 Differences in population characteristics, socioeconomic status, knowledge, awareness, population attitudes itself may contribute to this disparity observed in testing and detection rates. Additional contributory factors include NHS structural changes with genetic clinics in some areas being established a few years after others and in part oncology services through which the affected proband carrying the familial mutation is ascertained. There is limited awareness of BRCA testing among clinicians/practitioners and the population per se. Low referral rates for genetic counselling and subsequent BRCA testing have been reported by others too, which further highlights the missed therapeutic and prevention opportunities.44 Understanding reasons for differences observed is important and requires further research. This can help plan interventions to address underlying issues and improve carrier identification.
The number of OC/BC cases are predicted to rise by 27%/24%, respectively, in the UK, and 55%/55%, respectively, globally over the next 20 years.10 BRCA carriers have a 17%–44% OC risk and 69%–71% BC risk by 80 years.1 2 Uptake of screening and prevention options is cost-effective in reducing BC and OC incidence.45 46 Hence, BRCA carrier identification-driven precision medicine and cancer prevention provides an excellent opportunity to reduce future cancer burden and improve health outcomes, the importance of which is magnified by current economic/funding constraints (2.4% NHS budgetary shortfall).47
The limited Greater London BRCA detection rates achieved and long predicted time-to-identification observed highlights a need for change. We postulate that a similar situation probably exists across many other parts of the UK, Europe and other Western countries. Concerted efforts are required to increase knowledge and awareness among health professionals (hospital specialists and primary care general practitioners) and the general public regarding current guidelines for BRCA testing as well as access to health system pathways for BRCA testing. Additional steps are needed to simplify access and expand availability of BRCA testing, including investment in genetics infrastructure/services, relaxing current clinical testing thresholds, as well as implementing new ascertainment strategies like testing at cancer diagnosis.
Systematic population-based testing has been advocated as one key innovative strategy. Population testing can identify the large pool of carriers who remain undetected using FH-based approaches. It would also provide a strong stimulus to push carrier detection rates to higher levels compared with current trends, providing a greater impetus for earlier identification and consequent OC/BC prevention. Next-generation sequencing technologies and advanced bioinformatics now enable population testing. In the AJ population this has been and found to be acceptable, safe, effective and cost-saving.19 22 48–50 While population testing should be implemented in the AJ population, further research is needed before implementation in the general non-AJ population. A pilot study is underway in the UK.41 We recently showed that such an approach of population-based genetic testing would be cost-effective in the general non-Jewish population too.51 We call for research studies to understand the overall impact and evaluate delivery mechanisms and pathways for a population-based BRCA testing strategy in the general population.
Supplementary file 3
![[SP3.jpg]](https://jmg.bmj.com/content/jmedgenet/55/8/538/DC3/embed/inline-supplementary-material-3.jpg?download=true)
Supplementary file 4
![[SP4.jpg]](https://jmg.bmj.com/content/jmedgenet/55/8/538/DC4/embed/inline-supplementary-material-4.jpg?download=true)
Acknowledgments
The study is supported by researchers at the Barts Cancer Institute Cancer Research UK Centre for Excellence, Queen Mary University of London (C16420/A18066). We are grateful to Dr Angela Brady (North West Thames Regional Genetics Service) for her support with data collection and to Vishakha Tripathi (Guy’s Hospital) for her support of this work.
References
Footnotes
Contributors RM developed the concept and design of the study. RM, RT, CJ, FG, CG, OB, AZ, VSG, MB and IJ were involved in conduct of the study. RT and CJ contributed data to the study. FG and CG helped with data collection. OB, AZ and RM developed the models. RM, OB, FG, VSG, AZ and MB contributed to data analysis and preparation of figures and tables. RM and OB prepared the initial draft of the manuscript. All authors contributed to reporting of the work, including paper writing and critical review of the analysis. All authors approved the final version of the manuscript. RM and OB are guarantors of the work.
Funding The study was in part funded by ‘The Eve Appeal’ charity (GTCV).
Disclaimer The funding body (The Eve Appeal charity) had no role in the study design, data collection, analysis, interpretation, writing of the report or decision to submit for publication. The research team was independent of funders.
Competing interests IJ and UM have a financial interest in Abcodia, Ltd, a company formed to develop academic and commercial development of biomarkers for screening and risk prediction. IJ is a member of the board of Abcodia Ltd, a Director of Women’s Health Specialists Ltd and received consultancy from Beckton Dickinson. RM declares research funding from The Eve Appeal and Cancer Research UK into population testing and from Barts & the London Charity outside this work, as well as an honorarium for grant review from Israel National Institute for Health Policy Research. The other authors declare no conflict of interest.
Patient consent Not required.
Ethics approval This analysis was approved under the ethics approval obtained for the Genetic Cancer Prediction through Population Screening (GCaPPS) study from the Institute of Child Health/ Great Ormond Street Hospital Research Ethics Committee: REC Reference number 08/H0713/44.
Provenance and peer review Not commissioned; externally peer reviewed.
Data sharing statement Relevant anonymised data can be obtained on reasonable request from the corresponding author.