Article Text

Abstract
Chromosomal aberrations are a common cause of multiple anomaly syndromes that include growth and developmental delay and dysmorphism. Novel high resolution, whole genome technologies, such as array based comparative genomic hybridisation (array-CGH), improve the detection rate of submicroscopic chromosomal abnormalities allowing re-investigation of cases where conventional cytogenetic techniques, Spectral karyotyping (SKY), and FISH failed to detect abnormalities. We performed a high resolution genome-wide screening for submicroscopic chromosomal rearrangements using array-CGH on 41 children with idiopathic mental retardation (MR) and dysmorphic features. The commercially available microarray from Spectral Genomics contained 2600 BAC clones spaced at approximately 1 Mb intervals across the genome. Standard chromosome analysis (>450 bands per haploid genome) revealed no chromosomal rearrangements. In addition, multi-subtelomeric FISH screening in 30 cases and SKY in 11 patients did not detect any abnormality. Using array-CGH we detected chromosomal imbalances in four patients (9.8%) ranging in size from 2 to 14 Mb. Large scale copy number variations were frequently observed. Array-CGH has become an important tool for the detection of chromosome aberrations and has the potential to identify genes involved in developmental delay and dysmorphism. Moreover, the detection of genomic imbalances of clinical significance will increase knowledge of the human genome by performing genotype-phenotype correlation.
- array-CGH, array based comparative genomic hybridisation
- HR-CGH, high resolution comparative genomic hybridisation
- LCVs, large copy number variants
- MR, mental retardation
- SKY, Spectral karyotyping
- WHS, Wolf Hirshhorn syndrome
- array-CGH
- dysmorphism
- large scale copy number variations
- mental retardation
- submicroscopic chromosome aberrations
Statistics from Altmetric.com
- array-CGH, array based comparative genomic hybridisation
- HR-CGH, high resolution comparative genomic hybridisation
- LCVs, large copy number variants
- MR, mental retardation
- SKY, Spectral karyotyping
- WHS, Wolf Hirshhorn syndrome
- array-CGH
- dysmorphism
- large scale copy number variations
- mental retardation
- submicroscopic chromosome aberrations
Segmental aneusomy is a common cause of malformations and mental retardation (MR). Rearrangements involving large chromosomal segments can be detected by standard chromosome analysis using GTG-banding, but this technique is not suited for the detection of small chromosome abnormalities. Subtelomeric abnormalities are found in about 5% of mentally retarded patients1,2 when investigated by subtelomeric screening methods. However, these methods only reveal chromosome rearrangements located in the subtelomeric regions, and the relatively frequent observation of subtelomeric aberrations implies that small interstitial gene dose alterations may be as common but are overlooked. High resolution comparative genomic hybridisation (HR-CGH) performed on metaphase chromosomes has been used for genome-wide screening for chromosomal imbalances in patients with idiopathic MR.3,4 However, the resolution of CGH performed on metaphase chromosomes is limited and most likely depends on the structure and condensation of certain chromosome regions.5
On the other hand, when performing CGH on DNA clones immobilised on a glass surface (array based CGH),6 the resolution is determined by the size of the clones and the genomic distance between the clones. Array-CGH is a powerful tool for detecting very small chromosomal imbalances. This approach has revealed submicroscopic chromosome aberrations in patients with idiopathic MR with detection rates as high as 15–24%.7,8 These findings prompted us to study children with idiopathic MR and dysmorphic features, in whom G-banding karyotypes were normal. In addition, subtelomeric screening had been performed in the majority of the cases (30/41) and a small number of these cases (11) had also been investigated by Spectral karyotyping (SKY), without revealing any abnormalities. Using array based comparative genomic hybridisation (array-CGH) with a resolution of approximately 1 Mb, in a set of 41 cases we found aberrations in four. All cases had a de novo interstitial deletion. In addition to probable causative chromosome imbalances, we detected large copy number variants (LCVs) using array-CGH. The frequent occurrences of large size copy number polymorphisms in the human genome have recently been reported.9,10
METHODS
Patient selection
A total of 41 patients (22 girls and 19 boys between 6 months and 16 years old) with a phenotype highly suggestive of a disorder of chromosomal origin were selected. The phenotype included dysmorphic features, malformations, and/or a family history in combination with mild to severe MR. The selected patients scored at least 3 points on the checklist developed by de Vries et al.11 All 41 patients had been analysed by standard G-band analysis (>450 band resolution), 30 of the patients had been screened for subtelomeric aberrations by FISH, and 11 cases had also been investigated by SKY.12 Normal karyotypes had been found in all patients.
Array-CGH
Genomic DNA was extracted from peripheral venous blood samples, EBV transformed lymphocytes, or cultured fibroblasts using a Puregene blood kit (Gentra Systems, Minneapolis, MN) according to the manufacturer’s protocol. Genomic DNA from the patients was digested into fragments of 100–2000 bp by overnight incubation at 37°C with DpnII (New England Biolabs, Beverly, MA) at 37°C and checked on a 2% agarose gel. The DNA fragments were purified using a Qiaquick PCR purification kit (Qiagen, Hilden, Germany).
Array-CGH was performed using arrays containing 2600 BAC clones (Spectral Genomics, Houston, TX) as previously described,13 with some minor modifications. Briefly, 1 μg of digested genomic DNA was labelled with Cy5-dCTP or with Cy3 dCTP (Amersham Biosciences, Buckinghamshire, UK) using random prime labelling (Bioprime Labeling Kit, Invitrogen, Carlsbad, CA). Labelled test and reference DNA were mixed and unincorporated nucleotides were removed using a Qiaquick PCR purification kit (Qiagen, Hilden, Germany) prior to co-precipitation with Spectral hybridisation buffer I. The DNA pellet was re-suspended in Spectral hybridisation buffer II (Spectral Genomics). After denaturation, the probe was applied on the array and overnight hybridised at 37°C in a hybridisation chamber (Corning, Corning, NY). Slides were washed for 20 min each at 50°C in 50% formamid/2×SSC, 2×SSC/0.1% Tween 20 and 10 min in 0.2×SSC and immediately nitrogen blow dried. Colour reverse experiments were performed and, to minimise the costs, each investigated case was hybridised once against reference DNA consisting of a pool of 10 normal individuals (Promega, Mannheim, Germany) and once against another patient with a different clinical phenotype.
Array data analysis
Arrays were scanned in a fluorescence confocal scanner (Scan Array Lite, GSI Lumonics, Billerica, CA) and images were analysed using GenePix Pro 3.0 software (Axon Instruments, Burlingame, CA). Spots were defined by the automatic grid feature of the software and manually adjusted when necessary. Spots showing no signal or obvious defects were excluded from the data analysis, local background was subtracted, and total intensities, as well as the fluorescence intensity ratios of the two dyes, were calculated for each spot. Further data analysis was performed using the online accessible version of SpectralWare software (Spectral Genomics) using global mean normalisation of the data. In addition, the datasets were analysed using Microsoft Excel. After performing global mean and global median normalisations, the mean ratios of four fluorescent signals (two signals from the duplicated clone on the array and two signals from the colour reverse experiment) for each clone were calculated. All analysis was done on log2 ratios. To reduce false positive results, clones showing test/reference ratio value higher than 1.2 were considered gained and clones showing test/reference ratio value lower than 0.8 were considered lost, but only if the results of all four fluorescent signals were consistent. Clones were excluded from analysis if the ratio values of the four hybridised spots of each clone exceeded the threshold values (0.8–1.2) in a non-concordant matter.
FISH confirmation of array analysis
BAC clones spotted on the array showing gains or losses were subjected to FISH confirmation. All clones were obtained from The Welcome Trust Sanger Institute (Cambridge, UK) or BACPAC Resource Center Children’s Hospital (Oakland Research Institute, Oakland, CA). Bacterial cultures and DNA isolation were performed according to the BAC-PAC miniprep protocol from the Resources for Molecular Cytogenetics, University of Bari website (http://www.biologia.uniba.it/rmc). Probes were labelled with FITC-dUTP (NEN Life Science Products, Boston, MA) or SpectrumOrange-dUTP (Vysis, Downers Grove, IL) by nick translation, and FISH analyses were performed according to a standard protocol on metaphase slides that were prepared from lymphocyte cultures of peripheral blood or from fibroblast cultures. The slides were analysed on a Zeiss Axioplan 2 (Carl Zeiss, Göttingen, Germany) epifluorescence microscope and images were captured using a cooled CCD camera (Sensys Photometrics, München, Germany) and SmartCapture 2 software (DigitalScientific, Cambridge, UK). FISH signals were examined both on metaphase chromosomes and interphase nuclei. Control probes and inverted DAPI staining were used for chromosome identification.
RESULTS
We screened 41 mentally retarded children with dysmorphic features, for submicroscopic chromosomal imbalances by array-CGH. All patients had an apparently normal balanced karyotype when investigated by standard G-banding (>450 band resolution). In addition, multi-subtelomeric FISH was performed on the majority of the patients (30 out of 41) and 11 cases were investigated by SKY without revealing any rearrangements.12 We detected four de novo interstitial deletions. The results are summarised in table 1. A large number of single clone gains and losses interpreted as normal variants are listed in table 2. All four de novo aberrations were confirmed by metaphase FISH and parental samples were investigated by metaphase FISH and G-banding. Metaphase FISH investigation on the parental samples was performed using three to six differentially labelled clones, located in or flanking the region of interest, in order to exclude inversions.
Phenotypes and detected chromosome imbalance
Single clone normal variant detected by array-CGH
For verification of single clone variants, metaphase- and interphase-FISH was used. However, as expected, these relatively small microduplications and microdeletions proved to be difficult to validate by conventional FISH since the breakpoints of the duplications or deletions might be within the clone and only variable FISH signal intensity could be observed. Parental samples were not available in the majority of the cases to investigate parental inheritance of the polymorphisms. We interpreted aberrant signals from single clones as polymorphisms if they were detected in two or more unrelated patients not sharing the same phenotype or if the clones were listed in the online publicly accessible Database of Genomic Variants (http://projects.tcag.ca/variation). All but two of the polymorphic clones (RP11-130P22 and RP11-57D6, table 2) were already listed in the database.9,10
Case 1
Case 1 was a 2 year old girl with severe MR, dysmorphic facial features (synophrys, long eyelashes, depressed nasal bridge, long philtrum, crescent shape mouth), prenatal growth deficiency, severe epilepsy, cleft palate, hirsutism, camptodactyly, and syndactyly. A deletion spanning 12 clones with an estimated size of 10 Mb was identified, located on chromosome band 2q24–31. The deletion is probably the cause of the girl’s phenotype, since her clinical features overlap greatly with those mentioned in previous reports.14,15 In retrospect, a subtle deletion could be revealed by re-investigation of G-band analysis (fig 1A).
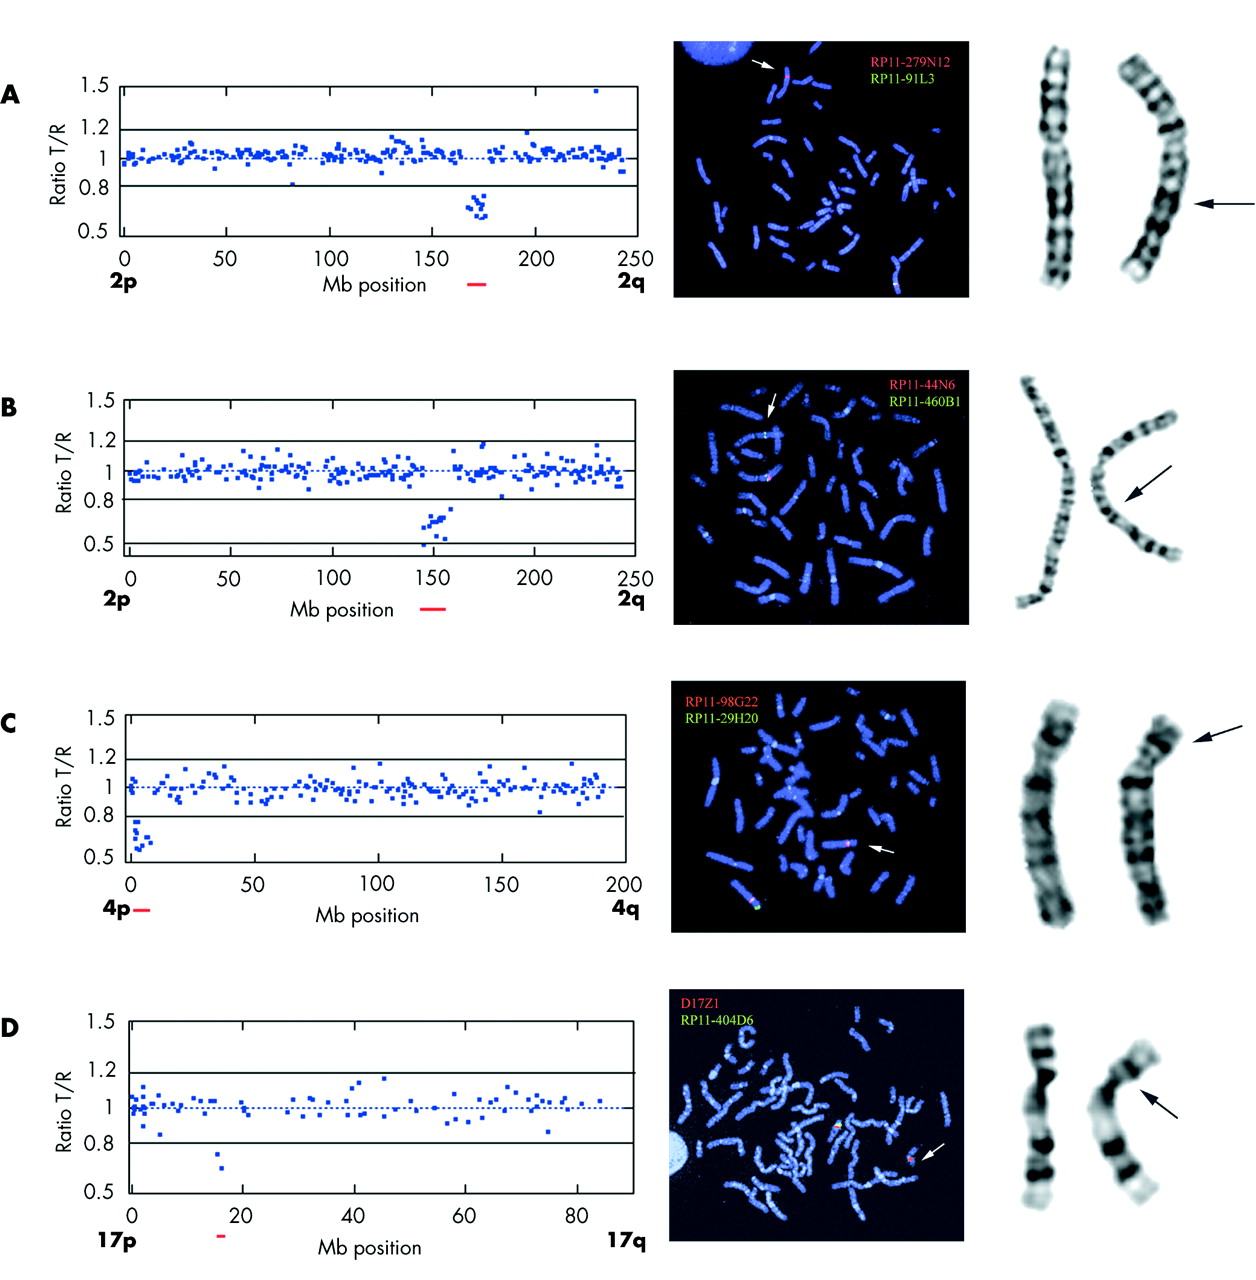
Array-CGH, FISH, and G-band images. Images on left: Array-CGH test/reference ratio plot of chromosomes displaying chromosomal aberration. The BAC clones are sorted according to their Mb genomic location along the chromosomes with the short arm (p) on the left and the long arm (q) on the right. Images in middle: Metaphase FISH confirmation using BAC clones showing aberrant ratios in the array analysis together with a chromosome specific control probe. Images on right: Giemsa stained chromosomes. (A) Case 1, chromosome 2: Array-CGH ratio plot from chromosome 2 displaying an interstitial deletion of 10 clones in cytogenetic band 2q24-3–q31.1. A polymorphism is visible at clone RP11-316O14 located at Mb position 220 showing a duplication (ratio close to 1.5). Metaphase FISH confirmation using BAC clone RP11-91L3 labelled with green located in the deletion and control probe RP11-279N12 labelled in red. A green signal on one 2q is missing indicating a deletion. Retrospective G-band analysis showing a subtle deletion on 2q. (B) Case 2, chromosome 2: Array-CGH ratio plot from chromosome 2 displaying an interstitial deletion of 14 clones in cytogenetic band 2q22-3–q24.1. Metaphase FISH confirmation using BAC clone RP11-44N6 labelled with red located in the deletion and control probe RP11-460B1 labelled in green. A red signal on one 2q is missing indicating a deletion. Retrospective G-band analysis showing a subtle deletion on 2q. (C) Case 4, chromosome 4: Array-CGH ratio plot from chromosome 4 displaying an interstitial deletion of 11 clones in cytogenetic band 4p16. Metaphase FISH confirmation using BAC clone RP11-29H20 labelled with green located in the deletion and control probe RP11-98G22 labelled in red presenting only one green signal on the deleted chromosome 4. Giemsa stained chromosomes showing a deletion on 4p. (D) Case 5, chromosome 17: Array-CGH ratio plot from chromosome 17 displaying an interstitial deletion of two clones in cytogenetic band 17p11.2. Metaphase FISH confirmation using BAC clone RP11-404D6 labelled with green located in the deletion and a centromeric probe D17Z1 labelled in red showing only one green signal on the deleted chromosome 17. Giemsa stained chromosomes showing no deletion on 17p.
Case 2
Case 2 was a 13 year old girl with severe MR, microcephaly, anal atresia, heart malformations (VSD, PDA, and hypoplastic aortic arch), postnatal growth retardation, susceptibility to infections, and facial dysmorphism (synophrys, long eyelashes, low set prominent ears, down turned corners of the mouth). A deletion of approximately 14 Mb, involving 13 BAC clones located in chromosome band 2q22.3–24.1, was identified by array-CGH. The deletion was confirmed by metaphase FISH (fig 1b). Because of the relatively large size of the deletion revealed by array-CGH, G-band karyotype was re-investigated and revealed a very subtle deletion (fig 1B). This de novo deletion is most likely the underlying cause of the girl’s phenotype, which had some overlap with a previously reported case with del(2q)(q22.3q23.3).16 The ZFHX1B (SIP1) gene, associated with Mowat-Wilson syndrome,17 is located close to the deletion in case 2. Therefore, FISH with a clone covering the ZFHX1B (SIP1) gene (RP11-107E5) was performed with normal results, indicating no deletion of this gene.
Case 3
In case 3, an 11 year old girl with severe MR, pre- and postnatal growth retardation, microcephaly, seizures, and facial dysmorphism (hypertelorism, epicantus, triangular face, and brachycephaly), we detected an interstitial deletion spanning 11 clones on 4p16.2–16.3, size estimated to be 6 Mb (fig 1D). The deletion spans both the WHSC1 and WHSC2 genes, associated with Wolf Hirshhorn syndrome (WHS). In retrospect the classical characteristic facial features of this syndrome were recognised in the girl. We mapped the proximal breakpoint of the deletion by FISH using clone RP11-1197E19, covering the LETM1 gene. Deletions causing haplo-insufficiency for LETM1 (a calcium channel gene located at 1.77 Mb) have been suggested to be the underlying cause of seizures occurring in patients with WHS.18–20 This patient, with late onset epilepsy (short partial seizures), could have one of the gene copies affected by the breakpoint.
Case 4
Case 4 was a 10 year old boy with moderate MR and mild dysmorphic facial features (short and broad middle face, prominent chin) in combination with a behavioural disturbance with temper tantrums and sleeping disorder. He had postnatal growth retardation but developed overweight from the age of 3. A deletion of approximately 2 Mb involving two clones was detected at 17p11.2 (fig 1E). The deletion was proximal but close to the Smith-Magenis syndrome repeat gene clusters, SMS-REPs.21 We therefore investigated this patient for SMS microdeletion by FISH using an SMS commercially available probe (Qbiogene, Illkirch, France). No deletion was detected using this probe, but the patient’s phenotype showed many features overlapping with those of SMS. The expression of the genes responsible for the SMS phenotype might be influenced by a heterochromatin induced position effect in this patient. Nevertheless, thorough genotype-phenotype correlation of this case together with other SMS patients would be needed to determine if the critical region for SMS needs to be adjusted.
DISCUSSION
Array-CGH has proven to be an important tool to detect submicroscopic chromosomal aberrations. Two previous array-CGH screenings performed on mentally retarded patients have reported detection rates as high as 15% and 24%, respectively.7,8 However, almost half of the aberrations detected were single clone gains or losses. These small imbalances are more difficult to distinguish from normal variants, especially if these small imbalances are inherited from one of the parents. Despite the fact that inherited imbalances could account for the abnormal phenotype in affected children through an epigenetic or unrecognised mechanism in rare cases of recessive disorders, it is however more likely that single clone imbalances inherited from phenotypically normal parents are not the cause of the phenotype in their affected offspring. After exclusion of the abnormalities that were inherited or were listed in the Database of Genomic Variants, the detection rate is closer to 10% in both previously reported array-CGH screening studies.
We detected chromosome imbalances in 9.8% of the investigated cases. The aberrations involved 2–14 clones and none of the aberrations were inherited. Two of the aberrations detected were estimated to be ⩾10 Mb in size, but still they were not previously detected by standard karyotyping. Furthermore, other genome-wide screening studies have reported large aberrations that escaped detection by G-banding analysis. This illustrates that more accurate and reliable methods are needed to exclude chromosome imbalances in mentally retarded patients. Moreover, high resolution screening using array-CGH not only detects submicroscopic chromosomal imbalances, but also allows accurate delineation of the duplicated or deleted chromosomal segments. This is crucial for genotype-phenotype correlations and for identifying candidate genes involved in the development of mental disability and dysmorphism.
When subtelomeric screening was widely performed, numerous subtelomeric rearrangements were mapped, phenotype-genotype correlations were performed,22 and polymorphisms were identified.23,24 Array-CGH offers the same possibilities, but now including the whole genome. The online databases to access phenotypes correlated to gene dose alterations, such as DECIPHER (http://www.sanger.ac.uk/PostGenomics/decipher/) and ECARUCA (http://www.ecaruca.net/), will become tremendously helpful for interpreting the results of these analyses. Array-CGH has already been used successfully for delineation of known microdeletion/microduplication syndromes,21,25–28 and recently the CHD7 gene causing CHARGE syndrome was identified by array-CGH screening of patients diagnosed with this syndrome.29
In addition to chromosome imbalances, we detected a large number of single clone gains and losses that were interpreted as normal variants, since they are frequently observed in normal healthy individuals or were observed in several patients with different clinical phenotypes. Therefore, it is unlikely that these polymorphic gains and losses influence the phenotypes of our patients. In a previous study testing the same microarray on 10 patients with well characterised chromosome abnormalities,13 we did not detect any polymorphisms, but a number of clones gave false negative results. This is most likely due to the smaller sample size used, but more importantly a more restricted threshold was used for array data analysis. Polymorphisms without clinical significance are present in the population, including regions containing coding genes. Because of the frequent LCVs found in individuals without clinical manifestations,9,10 the clinical interpretation of array-CGH is complicated.
Shaw-Smith et al speculated that array-CGH possibly could give a detection yield as high as 20% when screening patients with MR, dysmorphism, normal karyotypes by G-band analysis, and if subtelomeric regions are not excluded prior to array-CGH analysis.7 Subtelomeric rearrangements are currently reported to occur in 5% of investigated cases.2 The two previously reported array-CGH studies7,8 and this current study detected abnormalities of clinical significance in approximately 10% in a comparable group of patients. The detection rate speculated by Shaw-Smith et al might thus be slightly overestimated. Interestingly, previously reported studies using HR-CGH with a resolution of 2–3 Mb, also reported approximately 10%4 and 12%30 detection rates, respectively. These findings could imply that array-CGH with an average resolution of 1 Mb does not dramatically increase the detection of pathogenic chromosome imbalances compared to HR-CGH performed on metaphases. However, a considerable number of aberrations detected by array-CGH were less than 3 Mb in size and would most likely have escaped detection by HR-CGH. Furthermore, array-CGH allows for rapid and more precise mapping of candidate genes giving rise to certain phenotypes. It will become even more useful for screening mentally retarded patients for constitutional chromosome imbalances when a tiling resolution array consisting 32 500 overlapping BAC clones becomes readily available.31 This array will detect most of the submicroscopic aberrations that remain undetected by the methods discussed above and will give us more insight into the diversity of the human genome by detecting polymorphisms. Structural polymorphisms may play an analogous role in determining genetic diversity within the human population and there might be relationships between large scale copy number variations and susceptibility to genetic rearrangements and development of disorders. It is well recognised that segmental duplications in the human genome are located within regions which contain recurring de novo rearrangements causing several developmental disorders, such as Prader Willi/Angelman syndromes, DiGeorge syndrome, Charcot Marie Tooth syndrome, Smith Magenis syndrome, and Williams-Beuren syndrome.32 Regions on chromosome 8p and 4p are prone to genetic rearrangements, due to large olfactory receptor-gene (OR) clusters causing unequal crossovers between two OR clusters in these regions.33 Duplications on the short arm of chromosome 8p have frequently been reported with or without clinical manifestations and deletion on the short arm of chromosome 4p causes WHS. Publicly accessible databases containing normal variants are very useful tools for determining polymorphisms, as results from different investigators world-wide can be accessed. In this way we will gain more understanding of the human variations in the genome to help discover its possible function.
In conclusion, high resolution screening of patients with idiopathic MR by array-CGH has the potential to become an important tool in the clinical diagnostic setting. Thorough phenotype-genotype correlation will be needed for the determination of the clinical significance of genomic imbalances. The characterisation of polymorphisms will provide more insight into the plasticity of the human genome.
ACKNOWLEDGEMENTS
We are grateful to the patients and their parents. We want to thank Dr Kerstin Sars Zimmer for referring patients and Dr Elisabeth Blennow for critical review. We also want to thank the Wellcome Trust Sanger Institute and BACPAC Resource Center, Children’s Hospital Oakland Research Institute for providing BAC and PAC clones.
REFERENCES
Footnotes
-
This work was supported by funds from the Swedish Medical Research Council, Frimurarna Barnahuset Foundation, Linnea och Josef Carlsson Stiftelse, Stiftelsen Sävstaholm, and the Ronald McDonald Child Foundation.
-
Competing interests: none declared