Article Text

Abstract
Purpose: To develop a simple scoring system for the likelihood of identifying a BRCA1 or BRCA2 mutation.
Methods: DNA samples from affected subjects from 422 non-Jewish families with a history of breast and/or ovarian cancer were screened for BRCA1 mutations and a subset of 318 was screened for BRCA2 by whole gene screening techniques. Using a combination of results from screening and the family history of mutation negative and positive kindreds, a simple scoring system (Manchester scoring system) was devised to predict pathogenic mutations and particularly to discriminate at the 10% likelihood level. A second separate dataset of 192 samples was subsequently used to test the model’s predictive value. This was further validated on a third set of 258 samples and compared against existing models.
Results: The scoring system includes a cut-off at 10 points for each gene. This equates to >10% probability of a pathogenic mutation in BRCA1 and BRCA2 individually. The Manchester scoring system had the best trade-off between sensitivity and specificity at 10% prediction for the presence of mutations as shown by its highest C-statistic and was far superior to BRCAPRO.
Conclusion: The scoring system is useful in identifying mutations particularly in BRCA2. The algorithm may need modifying to include pathological data when calculating whether to screen for BRCA1 mutations. It is considerably less time-consuming for clinicians than using computer models and if implemented routinely in clinical practice will aid in selecting families most suitable for DNA sampling for diagnostic testing.
- BRCA1
- BRCA2
- breast cancer
- mutation analysis
- ovarian cancer
- triage
- CSGE, conformation sensitive gel electrophoresis
- ER, oestrogen receptor
- FBC, female breast cancer
- HA, hetero-duplex analysis
- MBC, male breast cancer
- PTT, protein truncation test
- SSCP, single strand conformation polymorphism
Statistics from Altmetric.com
- CSGE, conformation sensitive gel electrophoresis
- ER, oestrogen receptor
- FBC, female breast cancer
- HA, hetero-duplex analysis
- MBC, male breast cancer
- PTT, protein truncation test
- SSCP, single strand conformation polymorphism
The prevalence of BRCA1 and BRCA2 mutations in families with breast/ovarian cancer depends on the type of cancer found in the families, the number of cases in a family, the age at onset, and the ethnic background. The Breast Cancer Linkage Consortium (BCLC) has carried out analysis in high risk families to ascertain the proportion of familial breast cancers attributable to BRCA1 or BRCA2, or neither.1 In 237 families with at least four cases of breast cancer diagnosed at <60 years of age (or one or more cases of male breast cancer (MBC) or ovarian cancer contributing to four or more cancers in total) 52% were linked to BRCA1 and 32% to BRCA2, with 16% linked to neither. Of the breast-ovarian families, 81% were linked to BRCA1 and 14% were linked to BRCA2. However, 76% of families with MBC but no ovarian cancer were linked to BRCA2. Of families with four or five cases of female breast cancer only, 67% were not linked to BRCA1 or BRCA2, suggesting the presence of other breast cancer predisposing genes. From this information, it is therefore substantially less likely that families with only female breast cancer cases will harbour BRCA1/2 mutations.
Many countries or ethnic groups have particular founder mutations that are not seen in other populations. In countries with a small founder population, a few mutations may account for the vast majority of breast cancer families. For example, 2% of the Ashkenazi Jewish population carry either the 185delAG or 5382insC mutation (BRCA1) or the 6174delT mutation (BRCA2). One study showed one of these three mutations present in 59% of high risk families.2 Population studies have shown that the 185delAG mutation predates the separation of Sephardim and Ashkenazim Jewish populations and is probably 2000 years old.3 In Iceland, the BRCA2 995del5 mutation accounts for most familial breast cancer.4 A duplication in exon 13 of BRCA1 appears to be a founder mutation that originated from the UK.5 Nonetheless, this mutation is unlikely to account for a high proportion of familial breast cancer in the UK. We have previously reported a possible founder in BRCA2 (2157delG), which accounts for around 20% of BRCA2 mutations in our population in North West England.6 However, there are no founder mutations occurring at high enough frequencies in the UK to substantially increase the proportion of breast cancers attributable to BRCA1/2.
Several researchers have produced models based on tested samples to calculate the chances of identifying BRCA1/2 mutations.7–11 Most use logistic regression to calculate pre test probability that a family with a given cancer phenotype has a mutation. One model relies on inputting the pedigree into a computer.7 The accuracy of these predictions is difficult to assess,12–15 but all validations so far have been in predominantly high risk families. However, the only fully validated model7 is time consuming and requires a computer, appropriate software, accurate data input, and some knowledge of expected outcome to achieve a reasonably consistent and reliable result. This is because an inaccurate entry could substantially affect the risk predictions. The manual models rely on algorithms, which incorporate certain factors about the breast and ovarian cancers in the family. The Couch model averages the age at which breast cancers occur, but does not account for the number of breast cancers.8 Three categories of families with ovarian cancer are included: families with both breast and ovarian cancer, families with breast cancer in addition to a double primary breast and ovarian cancer, and a single case double primary individual. In each case the average age at breast cancer is the determinant.8 Both Frank models10,11 include specific information about the age and tumour diagnosis of the proband. The first model only includes families with a breast cancer at <50 years of age and does not account for relatives diagnosed after that age.10 Categories are read from a simple table depending on the proband’s diagnosis and the presence of other breast cancer (at <50 years of age) in the family or ovarian cancer. The second model has many more variables dependant on the proband diagnosis.11 It allows information on more than one other relative with breast cancer at <50 years of age and also on more than one relative with ovarian cancer. Again breast cancers in relatives at >50 years of age are ignored.11 A more complete review of these models is available.15 Recently validation of a number of models in 109 Spanish families (34% detection rate for BRCA1/2 combined) was reported.16 This evaluated the Couch and Frank2 models, a Dutch,17 a Finnish,18 and an in house model.19 These latter three manual models were, however, derived in a small (<200) high risk sample set and the validation was also in a small high risk set.
While the manual models are relatively easy to use we felt they ignored important information in the family, while the computer model was too time consuming to use in a busy clinical practice where we see over 1000 breast cancer family history referrals per year. Without a reliable method of triage, clinical judgement can often be coloured by circumstances and patient pressure. With a view to a practical solution to this problem, we undertook to develop a simple quick model to assess the likelihood of BRCA1/2 mutation by using empirical data from our mutation screening programme. We only used information from our outbred British population as we did not have sufficient mutation data to develop a separate scoring system for our known Ashkenazi population. Given the lack of substantial founder effects in our population we felt this would be an important group to assess. We then tested the scoring system to compare its ability to discriminate which families should be tested at a 10% likelihood of a mutation being present.
METHODS
Model development
Affected individuals with breast and/or ovarian cancer, with a family history of breast or ovarian cancer, were ascertained from attendees at cancer genetics clinics in the Manchester region of North West England (population 4.1 million). Blood and informed consent were obtained for mutation screening of BRCA1 and BRCA2. Generally samples were initially prioritised using a clinician’s assessment of the likelihood of identifying a mutation, as resources for such testing have been limited in the UK. A minimal requirement was two close relatives (usually first degree relatives of each other) with breast cancer at <50 years of age, but combinations of male and female breast cancer and breast and ovarian cancer were particularly prioritised for mutation analysis. Exceptions to this were two research projects where population based cases of breast cancer at <31 years of age20 and sporadic breast cancer at ⩽35 years of age21 were screened for mutations in both genes. MBC families presenting to the clinic with at least one MBC at <60 years of age or at any age if female breast cancer had occurred were screened for BRCA2.22 Attempts were made to confirm all cancers, in particular ovarian cancer cases, using death certificates, pathology reports, and cancer registries.
Mutation screening of both genes was undertaken with a whole gene approach using SSCP (single strand conformation polymorphism) of all small exons and PTT (protein truncation test) of exon 11 in BRCA1, and of exons 10 and 11 in BRCA2. All mutations were confirmed by sequencing. Fifteen families were referred, without such testing, to direct sequencing of both genes by Myriad Genetics. As BRCA1 testing was established earlier, a larger number of families have had mutation screening for BRCA1 than for BRCA2. Those families with MBC have been screened, preferentially for mutations in BRCA2 and usually have not had mutation screening of BRCA1. Families with ovarian cancer were always pre-screened for BRCA1 unless MBC was present. Not all families have had mutation screening of both genes.
Validation samples
The scoring system was subsequently validated in a set of samples from the Wessex region of Southern England. Families were selected using similar criteria and samples tested by a variety of techniques including whole gene screening and in some cases partial gene screening (exons 2, 11, 12, 20 of BRCA1).23 Samples were usually tested initially for BRCA1. Fewer samples were tested for BRCA2 using a variety of techniques, in particular PTT for exons 10 and 11 and in some cases whole gene screening using either hetero-duplex analysis (HA)/SSCP or conformation sensitive gel electrophoresis (CSGE).
The scoring system was finally validated in a third set of 258 samples predominantly at a lower risk from the North West region. This third set was sent to a separate research laboratory. Whole gene screening techniques were used: the full coding sequence and intron–exon boundaries of both BRCA1 and BRCA2 were screened in 86 fragments by CSGE.24 We estimate this has a >90% sensitivity for base substitutions and >99% for small insertions/deletions.
Only clearly pathogenic mutations were counted for the purposes of this analysis. Unknown variants were not included.
Model comparisons
The final set was then scored using three existing manual models8,10,11 and the most widely validated computer model.7 Sensitivity and specificity were assessed using receiver operating characteristic (ROC) curves. These are plots of the true positive rate against the false positive rate for different possible cut-points. They show the trade-off between sensitivity and specificity of the different models (any increase in sensitivity will be accompanied by a decrease in specificity). The C-statistic is the area under the ROC curve and relates to the accuracy of the model, that is the larger the area under the curve the more accurate the model. An area under the curve of 1 represents a perfect model and an area of 0.5 or lower represents a poor model. This final set of 258 samples contained many families that fell short of our criteria for diagnostic service genetic testing in the UK. A basic minimum was:
-
two breast cancers with the youngest at <50 years of age (including bilateral disease),
-
three breast cancers at any age, and
-
ovarian cancer at any age+breast cancer or ovarian cancer at any age.
The majority of families contained multiple cases of female breast cancer only. However, there were four families with two ovarian cancers only and 10 with breast and ovarian cancer. Six families consisted of a single affected individual with bilateral breast cancer and there were no male breast cancer families.
Therefore, three sample sets were used in this analysis:
-
472 samples (set 1; table 1) from the highest risk families attending for genetic counselling in North West England, but including 131 samples tested in a research context. A total of 71 had only BRCA1 testing and 51 only BRCA2 testing.
-
192 samples from families attending for counselling in Southern England (set 2).
-
258 previously untested samples from families of attendees in North West England (set 3).
Proportion of families from set 1 testing positive for pathogenic mutations in BRCA1/2 with an overall estimate of the combined frequency
RESULTS
Set 1
A total of 422 families have had complete testing for BRCA1 in North West England. A total of 84 (20%) truncating mutations have been identified (table 1). Of 318 families tested for BRCA2 mutations, 54 (17%) have been identified as carrying pathogenic mutations (table 1). The detection rate for each gene in the samples tested for each grouping was used to estimate the number of extra mutations that would have been found in samples tested for only one gene, thus providing a final estimate for both genes.
A simple empirically derived scoring system for the likelihood of identifying a BRCA2 mutation was initially developed using the 36 pedigrees of the MBC families and the 99 samples from our population based set of breast cancers at <31 years of age,20,22 and then further developed by using the entire set 1. A similar scoring system was then derived for BRCA1. This system assigns scores depending upon the type of cancer and age at diagnosis (table 2). This was developed such that a score of 10 was equivalent to a 10% chance of identifying a BRCA2 or BRCA1 mutation. Scores for each cancer (including disseminated carcinoma in situ (DCIS)) with one score for each breast cancer in bilateral disease were summed for each family. If cancers occurred on both sides of the family the lineage providing the highest score was counted. Cancers occurring through two unaffected females at >60 years of age were discounted. The system weights the score on the likelihood of combinations of breast and ovarian cancer reaching the 10% threshold. The system weights the age at onset for female breast cancer for both genes, but ovarian cancer only for BRCA1 and MBC only for BRCA2. The use of our MBC set and young onset breast cancer samples was particularly useful in this respect. For instance, an isolated female breast cancer at age 20–29 years (6 points for BRCA1, 5 points for BRCA2) would not reach the 10% threshold for either gene. However adding a female breast cancer at age 30–39 years (4 points for each gene) hit the 10% threshold for BRCA1, but fell just short for BRCA2. We in particular wished to include all cancers that could add to the likelihood of identifying a mutation and thus breast cancers at all ages were included. Table 3 correlates the scoring system with results of mutation screening for both BRCA1 and BRCA2 in the entire sample set 1.
Scoring system for identification of a pathogenic BRCA1/2 mutation
Proportion of pathogenic mutations identified in both genes by scoring system in set 1
As can be seen, the 10 point cut-off clearly identifies a >10% likelihood of a mutation in BRCA2, but is less clear for BRCA1. The combined scores for 8 and 9 points are clearly <10% for both BRCA1 and BRCA2.
Set 2
The scoring system was then validated for a sample set from Southampton (Southern England) that is geographically separated from the North West by about 200 miles (320 km). A total of 48 mutations were identified in 192 families evaluated for BRCA1 and 13 in 110 families evaluated for BRCA2 mutations. Prediction using the scoring system (table 4) was very similar to the North West data set, with a good cut-off at 10 points for both genes, although the numbers were small for BRCA2.
Proportion of pathogenic mutations identified in both genes by scoring system in the set 2
The combined dataset of 664 samples from the North West and Southern regions (tables 3 and 4) was then used to provide predicted likelihood of BRCA1 and BRCA2 mutations being identified with each range of scores (table 5). A combined score of 18–21 was derived as predicting a combined likelihood of 10–20% for identifying a BRCA1/2 mutation.
Proportion of pathogenic mutations predicted in both genes by scoring in the combined dataset (sets 1 and 2)
Validation with set 3
The third set of samples consisted of 258 affected individuals from families not previously screened for BRCA1 or BRCA2. Some 23/258 (9%) families had mutations identified with full gene testing of both genes. Only six mutations were identified in BRCA1. Predicted scores varied widely between the three other manual methods, even between the two derived from the Myriad dataset.10,11 In particular, the models did not take account of all the factors, which could influence the presence of a mutation. Scores could not be derived from the Frank1 model10 in 83 patients because the tested individual did not have breast cancer at <50 years of age; three of these families had a BRCA2 mutation. The six bilateral breast cancers could not be scored in the Frank2 model.11 The Couch model could not derive a score for the families containing only ovarian cancer.8 The predicted number of mutations (this is calculated for the Manchester model using the data in table 5) and those identified using a 10 and 20% cut-off, are illustrated in table 6, with sensitivity and specificity in table 7. In order to assess the sensitivity and specificity of each model, ROC curves were generated (figs 1–3) and the C-statistic calculated (table 8). As can be seen in table 7, the Manchester model outperformed all other models, especially in the combined group.
Assessment of scoring systems in 258 samples with full gene testing in set 3
Sensitivity, specificity and positive predictive value for each model using a 10% detection prediction in 258 samples with full gene testing in set 3
Area under the ROC curve (C-statistic) for each model using a 10% detection prediction in 175 (174 for BRCA1 models) samples with full gene testing

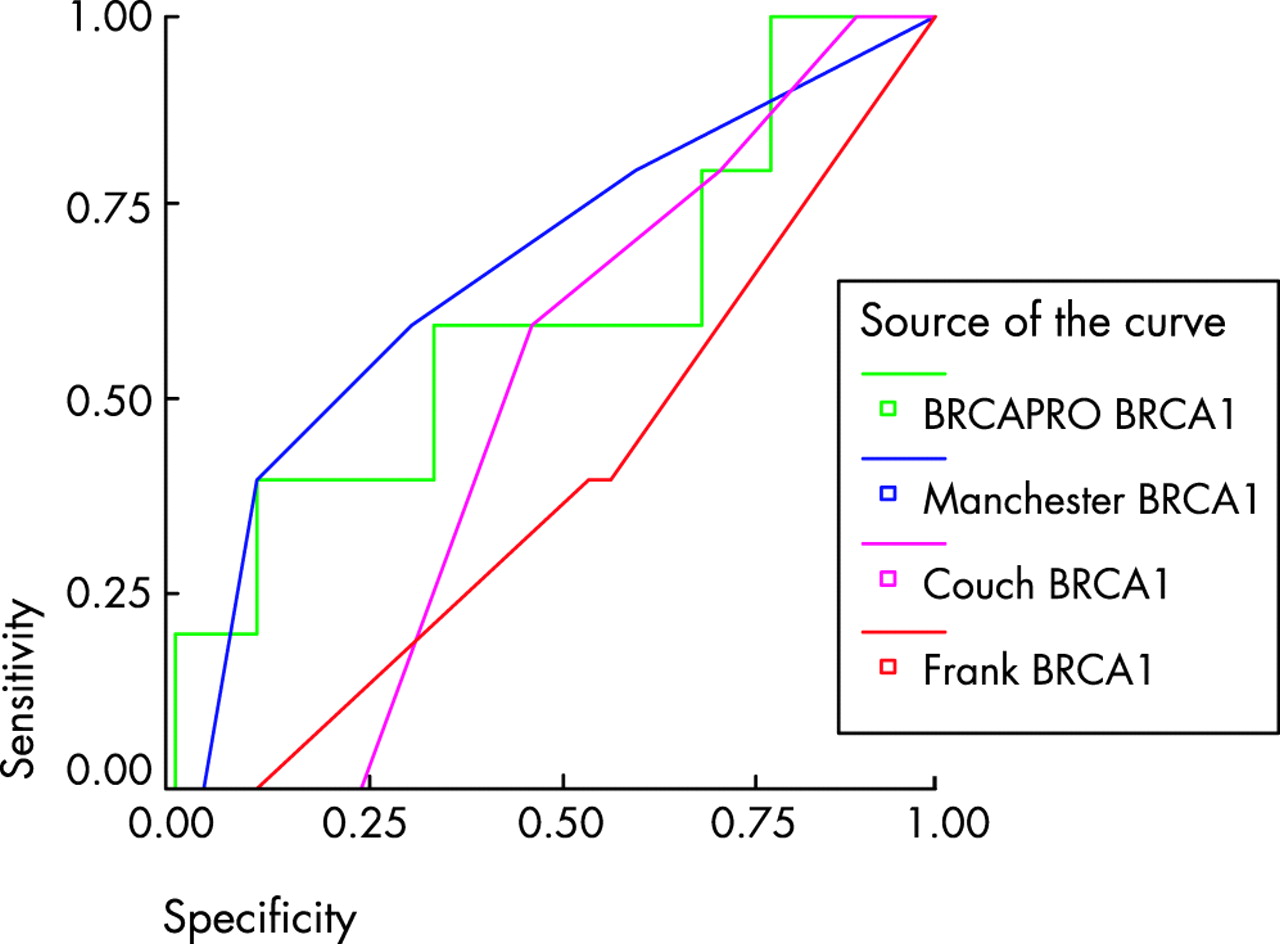
ROC curve for BRCA1 models using a 10% detection prediction in 174 samples with full gene testing. Comparisons are with the Frank1 model. Diagonal segments are produced by ties.
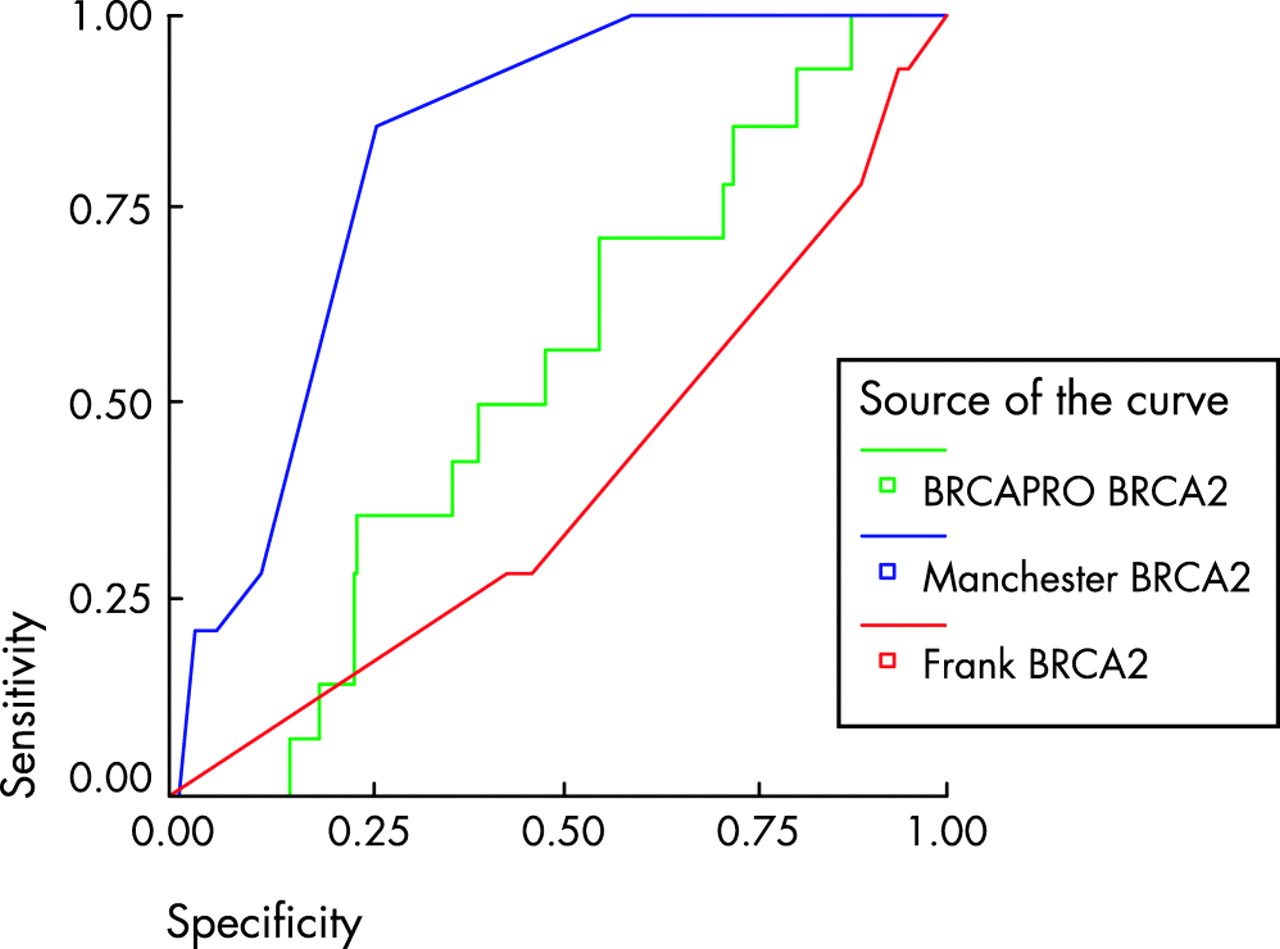
ROC curve for BRCA2 models using a 10% detection prediction in 175 samples with full gene testing. Comparisons are with the Frank1 model. Diagonal segments are produced by ties.
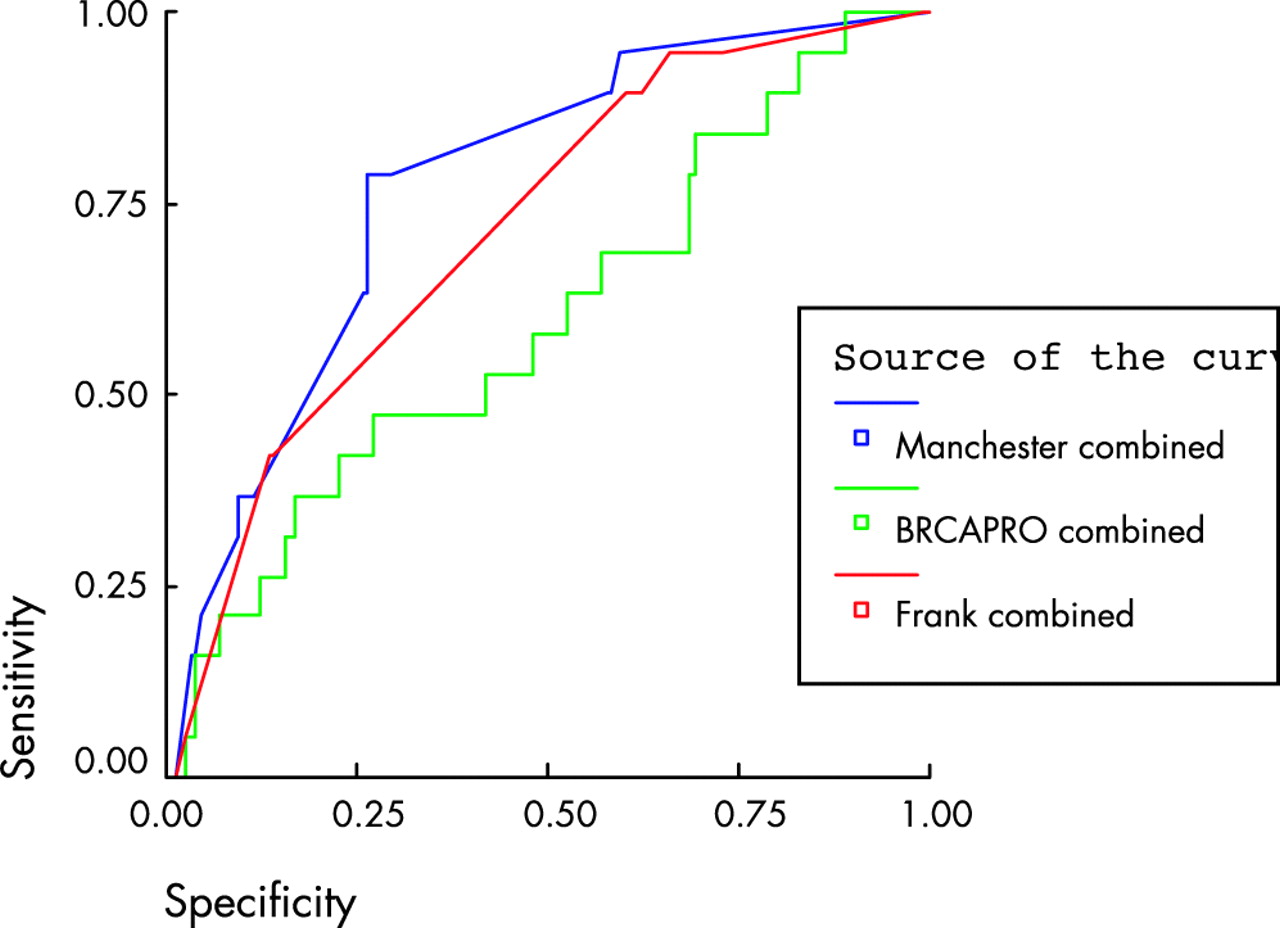
ROC curve for models comprising both BRCA1 and 2 using a 10% detection prediction in 252 samples with full gene testing. Comparisons are with the Frank2 combined model. Diagonal segments are produced by ties.
DISCUSSION
This study represents one of the largest reports of mutational analysis of BRCA1/2. In the three combined datasets some 222 (24%) families have been identified with proven pathogenic BRCA1/2 mutations out of a total of 922 families primarily from North West England (population 4.1 million). The mutations identified in these families are similar to the estimates from the Breast Cancer Linkage Consortium (BCLC) with allowances for the 60–70% detection rate using SSCP and PTT.1 This analysis does not suggest that BRCA1/2 mutational analysis is justified in isolated male or female breast cancer at whatever age.20–22 Published data suggest mutation analysis may be valid in isolated breast cancer if it is grade 3 oestrogen receptor (ER) negative and diagnosed at <35 years of age.25 In an isolated patient from an ethnic background where strong founder mutations exist,26 these can be tested for simply and inexpensively. The lack of inclusion of an algorithm for Ashkenazi Jewish origin should therefore not be a major weakness for the Manchester scoring system. Careful scrutiny of other population based testing of isolated breast cancer at <35 years of age in non-founder populations gives a very low rate for BRCA1/2 mutations.27–30 The rate for isolated MBC is also low with only around 4% having a mutation in BRCA2.22,31 Our scoring system would not allow testing of single cases with a single primary (female breast cancer, MBC, or ovarian cancer) even in the combined 10% cut-off category.
We have also undertaken validations of many other available risk packages.7,8,10,11 We did not evaluate the Shattuck-Eidens model9 as we felt this model from Myriad had been supplanted by the Frank models.10,11 All of these models fell short of our Manchester model in predictions of number of mutations and in the combined aspects of sensitivity and specificity as shown by the Manchester model having the best C-statistic for BRCA1 and BRCA2 mutations. The Couch model did not identify any of the six BRCA1 families using a 10% cut-off. Although the Frank1 model detected 5/6 mutations, there is no category that scores <10% in the model. The Manchester model performed particularly well for BRCA2, with a C-statistic of 0.817. Even in the combined score the Manchester model outperformed the most recent Myriad model (Frank2)11 and BRCAPRO,7 with a better C-statistic and a better overall prediction of the number of mutations. A recent validation of the Couch8 and Frank211 models in a high risk setting has shown that they help genetic counsellors to select appropriate families for testing.13 The authors deliberately chose a high risk sample set and therefore were not really addressing the issue of a 10 or 20% likelihood cut-off. The Couch and Frank2 models performed equally well to the other three manual models tested,17–19 with trade-offs for sensitivity and specificity fairly even. Interestingly all the models overpredicted BRCA1 compared to BRCA2 mutations even in this high risk sample set.
Surprisingly our Manchester model has substantially outperformed the computer model.7 Although previous validation of the BRCAPRO model suggested a relatively good correlation, the pedigrees used were mainly in the high risk category.13,14 We have identified a group of families (set 3) which are clustered around the 10% likelihood category. It would appear that BRCAPRO substantially overestimates in this lower risk category, particularly for BRCA1. One of the two validation papers14 specifically used the 10% threshold and, while sensitivity was high (high risk families were utilised), the specificity was only 32%, substantially lower than in our dataset. Although some adjustment could be made for sensitivity of the mutation testing, this is unlikely to greatly affect the outcomes. The techniques used were of the order of 70–80% sensitive32 (allowing for a 10–15% cryptic and large deletion rate) and even an upward elevation of the mutations identified to account for this would still leave our Manchester model outperforming the other models. Indeed the appropriate elevation to account for the difference in sensitivity between 70 and 85% (direct sequencing, without a deletion strategy) would only predict another five mutation positive families (total 28) and all the combined score estimates were well above the 38 predicted in our Manchester model. BRCAPRO performs particularly badly for BRCA2. Although it predicted quite accurately the number of mutations, this disguised an inability to predict which families would have mutations. Of the 17 BRCA2 families, 14 were given a higher score for BRCA1 than BRCA2 by BRCAPRO and only 1/17 was identified using a 10% threshold. Our Manchester scoring system takes minimal time and the family tree does not require inputting into a computer programme. We have assessed that it would take over 60 man-hours to create electronic pedigrees for all our 258 families from scratch and download them into a computer package for an experienced researcher. Scoring all 258 pedigrees using our system took <2 h.
The existing paper models are deficient in a number of ways. The Couch model8 does not take into account the number of breast cancers. For instance two with an average age of 34 would be scored the same as five with the same average age. It also would downgrade a score for extra breast cancers if these were old. For instance two sisters with breast cancer at age 34 would have a score of 17.4%. However if the mother and maternal grandmother were diagnosed at 80 and 85 years of age this would downgrade the score to only 2.3% as the average age rises from 34 to 58 years. It seems unlikely that the extra breast cancers would work in this way. The Frank1 model10 only scores for families with a breast cancer at <50 years of age and does not take into account multiple cases of breast cancer. The score appears to be overly dependant on the affected status of the proband. For instance a proband with bilateral breast cancer, the first at 39 years and the second aged 70 years, with an affected mother aged 49 years would elicit a 71% likelihood of a BRCA1 mutation and a 76% combined score. However in the Frank2 model11 this would only obtain a combined score of 29.7%. The Frank2 model does not take into account more than three affected relatives and places no relevance on breast cancer at age >50 years. There could be criticisms of the development of the Manchester model in groups of samples (sets 1 and 2) which were not fully tested for both genes. However, the number of samples tested and the reproducibility in three separate datasets, including the third set of 258 samples (fully tested for both genes) where the model outperforms all other models, should be sufficient to largely counter this potential criticism.
A threshold for mutational analysis in the USA has been put at 10% likelihood of identifying a mutation.33 The Manchester model provides a quick, effective, and reasonably specific filter for families, which is certainly superior to the other non-computer models. In the UK and most other countries analysis is usually carried out on each gene sequentially. A more realistic level to set for mutational analysis would be a 10% threshold for each gene.
We believe our scoring system is particularly useful for BRCA2 for which there are few pathological markers. It may be possible to further adapt the scoring system for BRCA1 to incorporate histology information from both breast and ovarian cancers, for example by increasing the score for grade III ER negative tumours and decreasing it for ER positive tumours.25 It is of note that families with two or more ovarian cancers had a high level of identifiable mutations, but of the six families with a proven mucinous ovarian cancer, only one had a mutation (in BRCA2). Indeed the mucinous cancer in this family did not carry the pathogenic mutation. Given the absence of mutations in mucinous ovarian cancer in this and other studies,34 a much lower score could be given for this tumour for both BRCA1 and BRCA2. A strategy for screening would be to test families for BRCA2 first if there is an MBC and BRCA1 if there is an ovarian cancer (unless MBC as well). Breast only families should be tested for BRCA2 first unless the score for BRCA1 is higher (breast cancer at <30 years of age in the family). Prostate (especially early onset) and pancreatic cancer in the family would make BRCA2 a priority.35 The low detection rate for BRCA1 mutations in our validation set was a little surprising. It would appear that BRCA1 mutations are much less likely to be found in smaller aggregations of breast only families than has hitherto been considered.
Our Manchester model does have some similarities with a scoring system called FHAT derived in Canada.36 The FHAT scoring system was designed to trigger referral for genetic counselling and mutation testing at a score of 10 points. This was equated with a lifetime risk of breast cancer of 22% using Claus tables or BRCAPRO. This had good sensitivity for identifying families for mutation testing, but poor specificity and positive predictive values compared to BRCAPRO. As no percentage values were given for each FHAT score it was not possible to test the FHAT in our set 3. Indeed the authors stated that the FHAT was not designed as a tool to determine the likelihood of finding a BRCA1/2 mutation. No further validations of the FHAT have appeared.
Clearly our model will need validating in other populations without founder effects and may be particularly useful for North America. It is in no way meant to totally replace the computer models that are now readily available as modifications in these could be made to account for the findings in patient series like our own. Indeed new models incorporating putative other genes including recessive and polygenic elements are being published.37 However, our model can provide quick guidance for busy clinicians to determine which families are worth referring for BRCA1/2 mutation testing and which gene to test first.
REFERENCES
Footnotes
-
Conflict of interest: none declared.