Article Text

Abstract
The underlying causes of learning disability and dysmorphic features in many patients remain unidentified despite extensive investigation. Routine karyotype analysis is not sensitive enough to detect subtle chromosome rearrangements (less than 5 Mb). The presence of subtle DNA copy number changes was investigated by array-CGH in 50 patients with learning disability and dysmorphism, employing a DNA microarray constructed from large insert clones spaced at approximately 1 Mb intervals across the genome. Twelve copy number abnormalities were identified in 12 patients (24% of the total): seven deletions (six apparently de novo and one inherited from a phenotypically normal parent) and five duplications (one de novo and four inherited from phenotypically normal parents). Altered segments ranged in size from those involving a single clone to regions as large as 14 Mb. No recurrent deletion or duplication was identified within this cohort of patients. On the basis of these results, we anticipate that array-CGH will become a routine method of genome-wide screening for imbalanced rearrangements in children with learning disability.
- array-CGH
- mental retardation
- microdeletion
- microduplication
Statistics from Altmetric.com
Constitutional chromosomal imbalance is often associated with learning disability, dysmorphism, congenital anomalies, and abnormalities of growth. Examples of recurrent chromosomal imbalances include well characterised conditions such as the common trisomies, which can be studied by classical cytogenetic techniques. However, these methods have limited resolution and are unreliable for subtle copy number changes involving chromosome segments of 5 Mb in length or less.
Recurrent chromosomal microdeletion or duplication syndromes, such as for example DiGeorge syndrome (22q11 deletion syndrome), may be recognisable clinically because of the combination of clinical features or because of a characteristic facial appearance (“gestalt”). In patients with normal karyotypes, the clinical features may still suggest appropriate regions to be screened for microscopic imbalance by fluorescent in situ hybridisation (FISH) analysis using locus specific probes. Often, however, the combination of clinical features is not diagnostic of a particular syndrome but may nevertheless still suggest that a chromosomal imbalance is the likely underlying cause of the abnormality. FISH probes designed to detect subtelomeric rearrangements have given a significant diagnostic yield of around 6% in patients with unexplained learning disability and dysmorphic features,1–3 but interstitial chromosomal deletions and duplications are not detectable using this method.
More recently, the technique of comparative genomic hybridisation (CGH) using metaphase chromosomes has been applied to this clinical problem.4,5 Its sensitivity has been refined to permit detection of chromosomal deletions as small as 3 Mb. In a study of patients with learning difficulties and dysmorphism, 10% showed small deletions or duplications which were detectable by this method but which had not been identified on the G banded karyotype.4
Microarray based comparative genomic hybridisation (array-CGH)6 has many potential advantages over other methods currently available for the investigation of children with learning disability and dysmorphism. It offers rapid genome-wide analysis at high resolution and the information it provides is directly linked to the physical and genetic maps of the human genome.
Array-CGH has been used successfully for analysis of tumour samples and cell lines7–12 and for high resolution analysis of constitutional abnormalities consisting of single copy gains and losses in specific chromosomal regions,13–15 telomeres,16 and an entire chromosome.17 A study using genome-wide array-CGH to investigate patients with dysmorphism and learning disability has been reported recently.18 In that study, five copy number changes—of which only two were de novo and one involved a rearrangement within a telomeric region—were found in 20 patients, giving a potential diagnostic yield of 15%.
We have previously reported the design and use of DNA microarrays for the detection of copy number changes10 with application to cytogenetic abnormality,19 and have used a modified version of the technique to identify breakpoints in individuals with balanced reciprocal translocations.20 Here we report the application of genome-wide array-CGH at 1 Mb resolution to the study of 50 patients with learning disability and dysmorphism for whom, in the majority of cases, telomeric rearrangements had been excluded.
METHODS
Patients
We recruited patients born to unrelated parents and presenting with moderate to severe learning difficulties of unknown cause, 24 from France and 26 from the United Kingdom. Appropriate ethical approval was obtained. The patients were included in the study on the basis of the presence of at least one of the following additional criteria:
-
A family history of learning disability;
-
overgrowth or growth failure;
-
behavioural problems;
-
seizures;
-
facial dysmorphism or clinical or radiological evidence of brain, trunk, or limb anomalies.
In addition, all patients had a karyotype interpreted as normal using GTG banding analysis at ISCN 400–500. The presence of a subtelomeric abnormality was excluded by FISH or genotyping in the majority of these patients (41/50; 17 by FISH, 24 by genotyping). Genomic DNA from each patient was isolated from blood lymphocytes using a Nucleon kit (Amersham, UK) according to the manufacturer’s instructions. Pooled genomic DNA extracted from blood of 20 male or 20 female individuals was used as the reference in array hybridisations.
Array-CGH
The 1 Mb resolution arrays used in this study are as described previously.10 The clone set used for the construction of these arrays was verified by end sequencing and is available from the Sanger Institute. Array-CGH was undertaken generally as described but with modification.10 DNA was labelled using the Bioprime labelling kit (Invitrogen, Carlsbad, California, USA) with modifications of the nucleotide mix. Briefly, a 130.5 μl reaction was set up containing 450 ng of DNA and 60 μl 2.5× random primer solution. After denaturing the DNA for 10 minutes at 100°C, 15 μl 10×dNTP mix (1 mM dCTP, 2 mM dATP, 2 mM dGTP, and 2 mM dTTP in TE buffer), 1.5 μl 1 mM Cy5-dCTP or Cy3-dCTP (NEN Life Science Products, Boston, Massachusetts, USA), and 3 μl Klenow fragment were added on ice to a final reaction volume of 150 µl. The reaction was incubated at 37°C overnight and stopped by adding 15 μl stop buffer supplied in the kit. Unincorporated nucleotides were removed by use of micro-spin G50 columns (Pharmacia Biotech, Piscataway, New Jersey, USA) according to the suppliers’ instructions.
Array hybridisation using the 1 Mb array was undertaken as described previously.10 Briefly, Cy3 and Cy5 labelled test and control DNAs were combined, precipitated together with 135 μg of human Cot1 DNA (Roche, Mannheim, Germany), and resuspended in 60 μl of hybridisation buffer (50% formamide, 10% dextran sulphate, 0.1% Tween 20, 2×SSC, and 10 mM Tris-HCl, pH 7.4) and 6 μl of yeast tRNA (100 μg/µl, Invitrogen). Prehybridisation was carried out for one hour at 37°C as described. To prehybridise the arrays, 80 μl of herring sperm DNA (10 mg/ml, Sigma Aldrich, Poole, Dorset, UK) and 135 µg of human Cot1 DNA (Roche, Mannheim, Germany) were co-precipitated and resuspended in 160 μl of hybridisation buffer. Open-well hybridisation was done as described previously.10
Image and data analysis
Arrays were scanned using an Agilent scanner (Agilent Technologies). Fluorescent intensities were extracted after subtraction of local background using SPOT software.21 The data were normalised by dividing the mean ratio of each clone duplicate by the median ratio of all autosomal clones. Clones were excluded where the duplicate values differed from each other by more that 20%. In addition, clones that we have identified in previous control hybridisations and other studies as being polymorphic in normal individuals or consistently generating irreproducible ratios were excluded from the analysis. Mean and standard deviation values of hybridisation ratios for all clones in each experiment were calculated, and experiments where the standard deviation (SDh) exceeded 0.1 were excluded from analysis (but were successfully repeated subsequently).
We investigated those clones where the hybridisation ratio exceeded a value of the mean plus or minus four times the standard deviation (SDh) for the particular hybridisation experiment.
FISH
FISH experiments were done to confirm deletions and duplications identified by microarray analysis, using standard techniques.22 Metaphase spreads were prepared from patient derived lymphocytes using standard procedures. The human genomic clones from the RPCI BAC and PAC libraries were obtained from BACPAC resources (http://www.chorio.org/bacpac/) or locally from the Wellcome Trust Sanger Institute. Clones were grown on plates containing LB and 25 μg/ml kanamycin (PACs) or 20 μg/ml chloramphenicol (BACs), and incubated overnight at 37°C. Single colonies were picked and inoculated into 5 ml cultures of LB, supplemented with the appropriate antibiotic and grown overnight at 37°C at 215 rpm. DNA from clones was isolated using a QIAprep spin miniprep kit (Qiagen), and 500 ng of miniprep DNA was labelled with Spectrum Orange dUTP by nick translation (Vysis), following the manufacturer’s instructions. Slides were analysed using a fluorescence microscope (Leica DMRB), and images recorded using SmartCapture 2 software (Digital Scientific).
Quantitative FISH analysis was used to confirm the duplications identified in cases 2 and 8 by array-CGH, essentially as previously described,23 but with modifications. The fluorescent images captured in the conventional manner with the SmartCapture software were transferred into and visualised in the IP lab software package (Signal Analytics Inc). For each metaphase, the probe signals were isolated by splitting the colour coordinates so only the red channel containing the probe signals was displayed. Regions of interest of identical size were then drawn around each of the test and control probe signals on each chromosome homologue. The mean fluorescence for each probe signal within the defined region of interest was then measured using the IP Lab software. This procedure was carried out for 10 cells in each probe experiment. Statistical analysis was done using a Student t test. Log ratios of the fluorescent intensities for the test and control probe on the normal chromosome homologue were subtracted from the log ratios of the fluorescent intensities of the test and control probe on the abnormal homologue for each of the 10 cells. A fluorescence intensity ratio estimate (and 95% confidence intervals) was obtained between the test probe on the putative duplicated chromosome and the test probe on the other homologue.
Genotyping
Genotyping was carried out as described.24 Briefly, the number, location, and heterozygosity scores of the microsatellites were obtained from either the GENETHON database (http://www.genethon.fr/) or the GENOME DATABASE (http://www.gdb.org/). Primers labelled with a 6-FAM or HEX fluorochromes were ordered from MWG BIOTECH (Courtabeuf, France). DNA was extracted from peripheral blood lymphocytes according to standard techniques. Polymerase chain reaction (PCR) amplification of genomic DNA from parents and patients (100 ng) was undertaken separately. PCR products were then pooled according to their size and labelling, and analysed on an automatic sequencer (ABI 3100, PE Biosystem). Gel lane tracking and sizing of the size standard peaks were checked manually for all lanes. GENESCAN™ and Genotyper™ software (Applied Biosystems) was used to size the PCR products and to analyse the data.
RESULTS
We used a DNA microarray with a resolution of approximately one clone per megabase to study 50 patients with normal or apparently balanced karyotypes in whom a chromosomal abnormality was suspected because of the combination of clinical features. All patients had developmental delay or learning disability/mental retardation, together with dysmorphic facial features and other dysmorphic features involving the limbs or internal organs. All patients showed normal G banded karyotypes (with one exception, case 10), and in the majority of cases (41/50) telomere rearrangements had been excluded by FISH or genotyping.
A loss or gain of chromosomal material was detected in 12 patients, giving a rearrangement detection rate of 24%. In addition, copy number changes involving the Y chromosome were identified in two patients, but in regions largely consisting of palindromic repeats. As these regions were unlikely to be linked to the phenotype, we discounted them from further analysis. Seven of the abnormalities were deletions, of which six were not present in either parent. Five were duplications, of which one was de novo and four were inherited from a phenotypically normal parent. The copy number changes identified ranged in size from those involving only a single clone to approximately 14 Mb. All the deletions and duplications identified within the set of 12 abnormal results were in distinct non-overlapping chromosomal regions.
Array-CGH profiles for aberrant chromosomes are shown in fig 1. The imbalances in each of these cases were confirmed either by FISH (fig 2) or by microsatellite analysis of samples from the proband and both parents (table 1). For duplications, quantitative FISH analysis was carried out. In one case (patient 9), microarray analysis at tiling path resolution was done in order to confirm and refine the abnormal finding (data not shown).
Genotype analysis using chromosome 9 markers confirms the 9q22.3 deletion for patient 4 and demonstrates paternal inheritance

Summary of the array-CGH ratio profiles showing chromosomal abnormalities. Hybridisation results are shown for each of the 12 study patients in whom an abnormality was identified by array-CGH. For each panel, the X axis marks the distance, in megabases, along the chromosome from the p telomere. The Y axis marks the hybridisation ratio plotted on a log2 scale. Red lines indicate thresholds for clone deletion or duplication (mean ±4 SD). For each subject, the result for the whole chromosome (panel 1–2) or for the 50 Mb length chromosomal segment (panels 3–12) that contains the abnormality is shown. Further details for each patient are given in table 2. Centromeres, which are not covered on this array, appear in grey. (A) Patient 10 shows a deletion involving two clones in 13q. (B) Patient 11 shows a duplication involving 2 clones in Xp. (C) Patient 1 shows a deletion involving a single clone in 1p. (D) Patient 2 shows a duplication involving five clones in 1p. (E) Patient 3 shows a deletion involving 14 clones in 1p. (F) Patient 8 shows a duplication involving two clones in 3p. (G) Patient 9 shows a duplication involving a single clone in 6q. (H) Patient 4 shows a deletion involving 11 clones at 9q22.3. (I) Patient 5 shows a deletion involving a single clone at 17q. (J) Patient 6 shows a deletion involving a single clone at 19q. (K) Patient 7 shows a deletion involving seven clones in 21q. (L) Patient 12 shows a duplication involving a single clone in Xq.
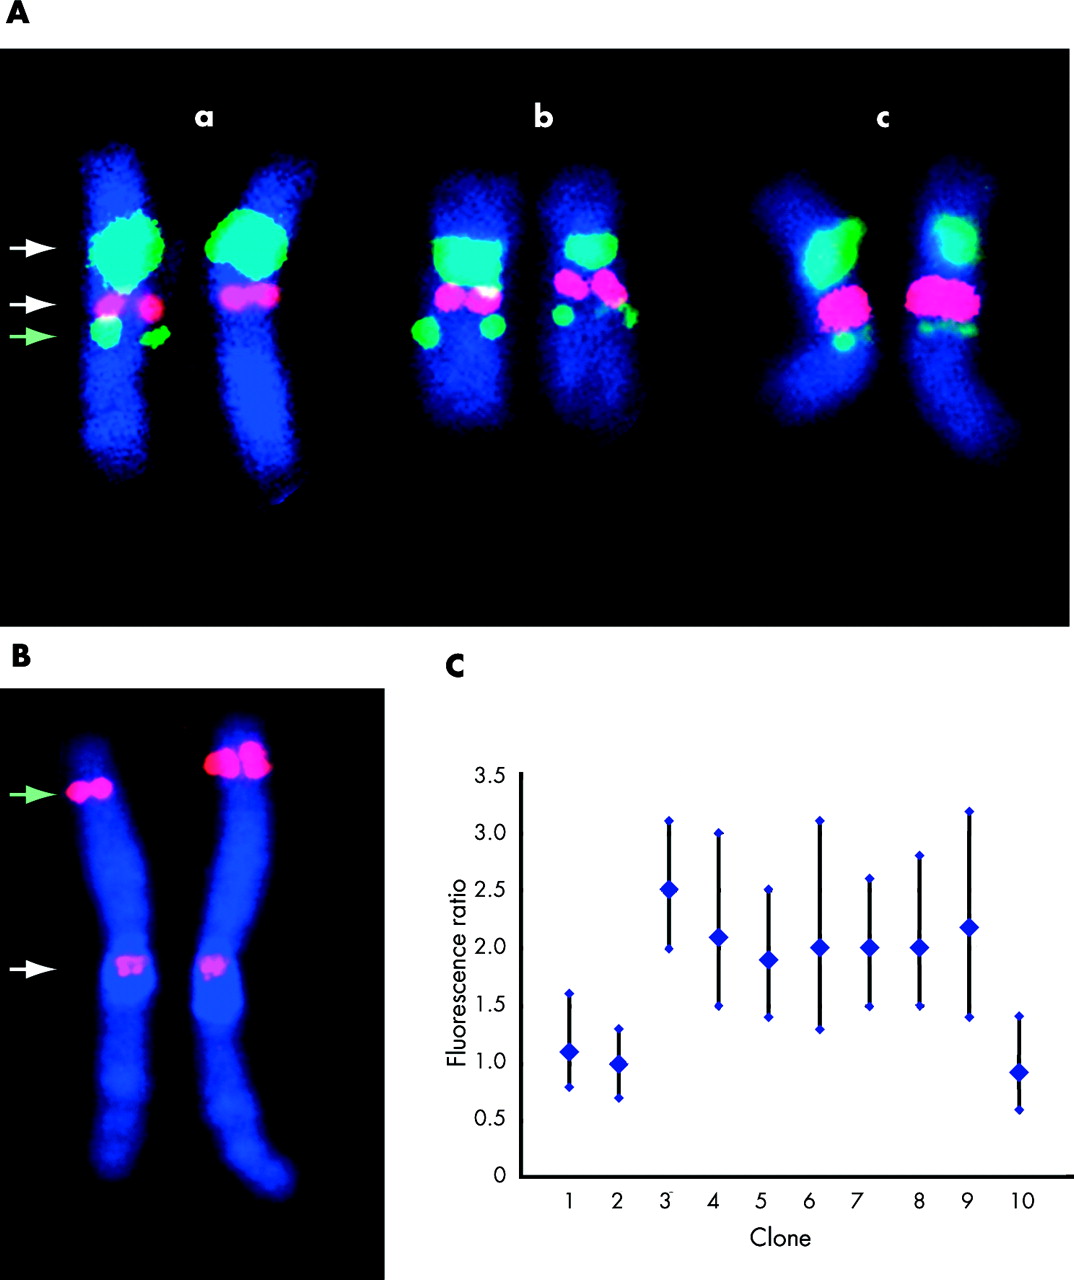
Confirmation of array-CGH results by fluorescent in situ hybridisation: two examples. (A) Confirmation of array-CGH finding in patient 5 (see table 2). A deletion involving a single clone was identified in this patient by array-CGH. Fluorescent in situ hybridisation (FISH) was undertaken on the proband (panel a), mother (panel b), and father (panel c), using three different probes. The white arrows indicate control probes (D17Z1, centromere probe (green) and RP11-94L15, Her2 locus (red)). Both these probes give a similar signal on each chromosome in panels a, b, and c. The green arrow indicates the signal obtained with BAC probe RP5-843B9, the same clone that gave an abnormal result by array-CGH. Signal is observed on both chromosomes in panels b and c, but on one chromosome only in panel a, indicating a de novo deletion. (B) Confirmation of array-CGH finding in patient 2 (see table 2) by quantitative FISH analysis. A duplication involving five clones was identified by array-CGH in this patient. FISH was carried out on the proband using a clone (RP11-187B23) from within the putative duplicated region (green arrow) and a control centromeric probe (white arrow). Results for chromosome 1 are displayed. A difference in signal size and intensity between the putative normal chromosome 1 (left of figure) and the chromosome 1 containing the duplication (right of figure) is observable by inspection. The signal was quantified for clones both from within and adjacent to the putative duplicated region. (C) The results of quantitative FISH analysis. A fluorescence intensity ratio of 2 is consistent with a duplication, and of 1 is consistent with a 1:1 signal ratio (no duplication). Clones from within the putative duplicated region gave a fluorescence ratio consistent with a duplication, while clones outside the region gave a 1:1 intensity ratio. The vertical bars indicate 95% confidence limits. Analysis of parental samples indicated that this duplication was a de novo event. Clones used in the experiment were: (1) RP1-184J9, (2) RP5-1057J7, (3) RP11-10N16, (4) RP11-373M8, (5) RP11-799D16, (6) RP3-469D22, (7) RP1-187B23, (8) RP11-492M19, (9) RP11-40H20, (10) RP1-159A19.
The clinical features of each patient in whom a chromosomal imbalance was detected are summarised in table 2. The band position and the number of clones giving an abnormal result are shown, together with the results of the analysis of parental samples. The names of the two flanking abnormal clones (or of the single clone where appropriate) are also shown.
Summary of copy number changes detected by array-CGH, associated clinical data and parental analysis
Comments on aspects of the individual cases are given below.
Case 1
Case 1 was a 21 year old woman who presented with developmental delay, microcephaly, short stature, seizures, and facial dysmorphism. The clinical phenotype of the patient was strongly suggestive of 1pter deletion syndrome.25 By karyotyping and genotyping, no deletion was detected in this region. However, a deletion involving a single clone at 1p36.33 was detected by array-CGH which was apparently de novo, and was less than 2 Mb in size. Interestingly, the most telomeric clone (CTB-14E10), which is also often used in the FISH based telomeric rearrangement screen, failed to show a deleted ratio. This might explain why this patient was screened negative for telomeric rearrangement using other methods. Further work is in process to fully characterise this microdeletion and to delineate a small subset of candidate genes for this particular recurrent syndrome.
Case 2
Case 2 was a 12 year old girl with microcephaly, severe learning disability, and mildly dysmorphic facial features. A duplication spanning five clones in 1p36.11–12 was identified by array-CGH. This duplication was confirmed by quantitative FISH analysis, and similar studies in the parents indicated that this finding was apparently a de novo event and therefore was the likely underlying cause of the patient’s phenotype. A duplication spanning 1p36.11–12 has previously been reported in conjunction with a deletion of 2q33-qter26—the child, who died at three months, had multiple congenital malformations.
Case 3
Case 3 was a 13 year old girl with severe learning disability, microcephaly, and cleft palate. A deletion of approximately 14 Mb involving 14 clones at 1p31.1–31.3 was identified by array-CGH and confirmed by FISH. FISH studies in the parents indicated that this finding was an apparently de novo event and therefore was the likely underlying cause of the patient’s phenotype. Reanalysis of the G banded karyotype revealed that this deletion, though subtle, could in retrospect be detected. Cytogenetically visible deletions encompassing this region have been reported previously,27–29 though without a clear phenotypic resemblance between individual cases.
Case 4
Case 4 was a three year old boy presenting with severe learning disability, craniosynostosis, microcephaly, and overgrowth. A deletion of 6.5 Mb involving 11 clones at 9q22.3 was identified by array-CGH. Genotyping of parental DNA showed that this deletion was apparently de novo. A cytogenetically visible substantially larger deletion encompassing this region has been reported previously.30 However, the clinical phenotype was quite different, although overgrowth was a common feature.
Case 5
Case 5 was a 17 year old boy with severe learning disability, short stature, mild contractures, and patchy skin pigmentation. An interstitial deletion involving a single clone at 17q21.31 was identified by array-CGH and confirmed by FISH analysis. FISH studies in the parents indicated that this finding was a de novo event and therefore was the likely underlying cause of the patient’s phenotype. There are two previous case reports of visible deletions spanning this region.31,32 Phenotypes and breakpoints are different in all three cases, although all had dysmorphic features and learning disability.
Case 6
Case 6 was a four year old boy who presented with intrauterine growth retardation, developmental delay, and cutis aplasia. A deletion involving a single clone at 19q13.11 was identified by array-CGH and confirmed by FISH. FISH studies in the parents indicated that this finding was a de novo event and therefore it is reasonable to assume that this is likely to be the underlying cause of the patient’s phenotype. No published reports of a similar deletion were identified.
Case 7
Case 7 was a 22 year old girl presenting with learning disability, seizures, microcephaly, and synbrachydactyly. Array-CGH identified a deletion at 21q22, including the minimal critical region duplicated in Down’s syndrome.33 This 7 Mb deletion was not visible cytogenetically and was shown by genotyping to be apparently de novo.
Case 8
Case 8 was a four year old boy presenting with microcephaly, Dandy-Walker malformation, agenesis of the corpus callosum, short stature, and moderate learning disability. A duplication involving two clones at 3p26.2–26.3 was identified by array-CGH. The duplication was confirmed by quantitative FISH analysis, and shown by the same method to be inherited from his phenotypically normal father.
Case 9
Case 9 was a 19 year old boy presenting with severe learning disability, postnatal growth retardation, and facial dysmorphism. A duplication involving one single clone was found at 6q13. We confirmed the presence of this rearrangement and showed that it is about 600 kb in length by using a tiling path BAC microarray covering the whole of chromosome 6 (data not shown). However, the duplication was also detected in the phenotypically normal mother, thus suggesting that its occurrence may be independent of the observed phenotype.
Case 10
Case 10 was a 13 year old boy with microcephaly, learning disability, dysmorphic facial features, and a kyphoscoliosis. Although this patient showed a de novo, apparently balanced, translocation (46, XY, t(1;5)(p32q15)), he was accepted into the study because his phenotype seemed too severe to be explained by the translocation alone. We suspected that a loss or gain of chromosomal material at one or other of the translocation breakpoints might be detected by array-CGH. However, no copy number changes were identified on the array at the breakpoints. A deletion of two clones at 13q33.3–34 was identified and confirmed by FISH analysis. This deletion was inherited from the boy’s phenotypically normal mother. Whether one or both of these chromosomal rearrangements is related to the phenotype is difficult to determine.
Case 11
Case 11 was an eight year old girl presenting with severe learning disability, facial dysmorphism, seizures, ataxia, and hyperphosphatasia. A duplication spanning two clones in Xp22.3 was identified by array-CGH; analysis of parental DNA by the same method indicated that this was inherited from her phenotypically normal father. One brother of this patient, who has the same clinical traits, did not show the Xp22.3 duplication by array-CGH, indicating that this duplication is unlikely to be the cause of the observed phenotype. Interestingly, the locus was previously shown to be deleted in a subset of patients with learning disability.34 The investigators concluded that one member of a gene family, VCX-A, was specifically deleted in patients with learning disability. Our finding suggests that the involvement of the Xp22.3 locus in syndromic learning disability needs to be further investigated.
Case 12
Case 12 was a nine year old boy presenting with developmental delay, facial dysmorphism, cryptorchidism, and a supernumerary nipple. Two distinct rearrangements were identified by array-CGH—a small maternally inherited duplication involving a single clone at Xq11.2, and a deletion of the long arm of the Y chromosome which was apparently de novo. As previously mentioned, the region involved in the Y chromosome deletion is mainly composed of palindromic repeats35; we therefore postulate that the learning disability is more likely to be linked to the Xq11.2 duplication. In support of this hypothesis, the mother showed a bias in chromosome X inactivation (80%/20%; data not shown), although the duplication itself could possibly drive this bias.
DISCUSSION
We have used array-CGH to investigate patients with learning disability and dysmorphic features. We used a whole genome array with an average resolution of 1 Mb (approximately 3500 clones in total) to analyse 50 previously undiagnosed patients with learning disability and dysmorphism. We identified abnormalities of copy number in 12 patients (24% of the total), discounting two Y chromosome rearrangements. Each deletion or duplication was detected in a single experiment without previous knowledge of the genomic region involved. Seven of the abnormalities identified (14% of patients) were autosomal deletions or duplications that had not been inherited, and so were thought likely to account for the phenotype of the patient. In the majority (41/50) of the patients included in the study, a subtelomeric abnormality had been excluded before enrolment; in keeping with this, no subtelomeric abnormalities were identified by array-CGH in the study group.
The diagnostic yield of microdeletions or microduplications we found in our 50 patients is comparable with that obtained in a similar recently published study of 20 patients.18 The proportions of de novo and inherited rearrangements are comparable, and interestingly, there are no imbalances that are common to the two groups of patients.
The identification of non-inherited microdeletions or microduplications in patients with severe phenotypes is presumptive evidence that the rearrangement and the phenotype are causally related. For de novo rearrangements visible by chromosome banding, the causal relation between karyotype and phenotype is usually accepted, even where the abnormality has not been reported previously. However, the abnormalities that we and others18 have identified by array-CGH represent a new class of genomic rearrangement, differing significantly in size from those usually detected by karyotypic analysis. Currently, there is insufficient information available to determine how many of these copy number differences are of pathological significance. Additional data, gained both from the study of patients and from normal individuals, will be needed in order to address this question.
Five of the observed copy number changes were inherited from phenotypically normal parents. In this situation it is probably more likely that the copy number change is an incidental finding, and not the cause of the diagnosed phenotype. It is possible that these rearrangements represent genomic polymorphisms of no pathological significance. This underlines the need for a systematic study of copy number polymorphisms in a large population of normal controls. However, the existence of inherited cytogenetically visible rearrangements involving euchromatic chromosomal regions is well recognised. The following examples have been documented as present in both phenotypically abnormal children and in their phenotypically normal parents: del (5)(p14.3–p14.3); del (7)(q14.3–q14.3); del (11)(q14.3–q14.3); del (13)(q14–q14); dup (1)(q42.11–q42.12); dup (3)(q25–q25); dup (4)(q31.3–q33); dup (6)(q24.2–q24.2); and dup (14)(q24.3–q31) (http://www.som.soton.ac.uk/research/geneticsdiv/anomaly%20register/index.html). Other euchromatic deletions and duplications have been reported in phenotypically normal individuals. Examples include del (2)(q13–q14.1), del (8)(p23.1/2–pter), del (11)(p12); dup(1)(p21–p31), dup (8)(p23.1–p23.3), and dup (18)(p11.2–pter). None of the rearrangements reported here coincides with any of these previously reported examples. Alternatively, it is also possible that the inherited deletions and duplications described are pathogenic but show non-penetrance in the parent or may be imprinted. Non-penetrance has been described previously, for example in the DiGeorge syndrome, where apparently phenotypically normal deletion carriers have been reported.36
The detection rate for abnormalities in this series is 24%. After exclusion of those abnormalities that were inherited, the detection rate is 14%. Although patients with previously detected telomeric rearrangements were excluded from our study, such patients (6%) who would most probably have been detected as telomeric regions are represented on our array. In general use, one may therefore expect array-CGH with a 1 Mb resolution array to detect de novo copy number abnormalities in about 20% of patients. It is likely that the detection rate could be further improved by the introduction of arrays with higher resolution, although diminishing returns with increasing resolution are probable. In our study, the size of the region involved in the copy number abnormality was less than 10 Mb in the majority of cases. It is unlikely that these abnormalities would have been detected by conventional metaphase CGH. Eight of our patients showed rearrangements that were less than 3 Mb in size, which would most probably have remained undetected even using high resolution metaphase CGH.4 Our study shows that array-CGH is a powerful tool for the investigation of chromosomal changes associated with mental disability and dysmorphism.
Acknowledgments
We are grateful to Arnold Munnich, Michel Vekemans, Stanislas Lyonnet, Jeanne Amiel, Valérie Cormier-Daire, and Martine le Merrer for clinical support. We would like to thank Andrew Mungall and Koichi Ichimura for constructing the chromosome 6 tiling path array and the Wellcome Trust Sanger Institute microarray facility for printing arrays. We are grateful to clinicians at Addenbrooke’s and Great Ormond Street hospitals for referring patients. We thank Leeanne Sparnon, James Cox, and Lucy Raymond for expert technical assistance, and Christine Hall, Clare Brady, and Sandra Wombwell for administrative help. This work was supported by the Wellcome Trust and the Programme Hospitalier de Recherche Clinique No AOM 02 122.
REFERENCES
Footnotes
-
↵* These three authors made an equal contribution to the work.
-
Conflicts of interest: none declared