Article Text

Abstract
Chromosome 15q11–q13 is one of the most variable regions of the human genome, with numerous clinical rearrangements involving a dosage imbalance. Multiple clusters of segmental duplications are found in the pericentromeric region of 15q and at the breakpoints of proximal 15q rearrangements. Using sequence maps and previous global analyses of segmental duplications in the human genome, a targeted microarray was developed to detect a wide range of dosage imbalances in clinical samples. Clones were also chosen to assess the effect of paralogous sequences in the array format. In 19 patients analysed, the array data correlated with microsatellite and FISH characterisation. The data showed a linear response with respect to dosage, ranging from one to six copies of the region. Paralogous sequences in arrayed clones appear to respond to the total genomic copy number, and results with such clones may seem aberrant unless the sequence context of the arrayed sequence is well understood. The array CGH method offers exquisite resolution and sensitivity for detecting large scale dosage imbalances. These results indicate that the duplication composition of BAC substrates may affect the sensitivity for detecting dosage variation. They have important implications for effective microarray design, as well as for the detection of segmental aneusomy within the human population.
- chromosomal rearrangement
- dosage imbalance
- array CGH
- segmental duplication
Statistics from Altmetric.com
Human chromosome 15q11–q13 is one of the most unstable regions of the human genome. This is supported by the wide spectrum of clinically recognised rearrangements that involve proximal 15q, including deletions, duplications, triplications, inversions, and translocations. In addition, many types of supernumerary marker chromosome, both dicentric and monocentric, are derived from the region and are found in multiple size classes. Genotype–phenotype correlations of clinically recognised 15q11–q13 rearrangements show that both the gain and loss of material from the region often results in disease. Prader-Willi and Angelman syndromes (PWS/AS) are classic examples of the phenotypic effect of regional loss, while pseudodicentric(15) syndrome (formerly inv dup(15) syndrome) and interstitial duplication of 15q11–q13 are clinically recognised disorders caused by gain of material.1–3 Partial hexasomy of 15q11–q13 has also been reported in one patient with multiple proximal chromosome 15 derived supernumerary marker chromosomes, establishing a wide range of potential dosage imbalances for the 15q11–q13 region.4
Dosage imbalance of the region has been linked to the presence of large blocks of segmental duplications, which comprise approximately 5% of the total human genome sequence.5–7 The presence of segmental duplications in regions prone to dosage imbalance is common,8,9 and an important consideration for employing genome-wide methods of detecting dosage imbalance such as array CGH (comparative genomic hybridisation)—which has the capacity to assess dosage at thousands of genomic loci simultaneously10—is how best to approach variable regions with a high duplication content.
Informative microarray design is dependent on a variety of bioinformatic resources made available through the human genome project. In particular, the detection and analysis of segmental duplications—especially in regions such as 15q11–q13 which are known to contain large blocks of such sequences—is critical in designing the most informative microarray.6,11 Furthermore, the sensitivity of highly duplicated clonal substrates within a microarray experiment has not been systematically explored. Such considerations are important for two reasons. First, genomic areas flanked by duplications show a greater proclivity to rearrange through non-allelic homologous recombination. Therefore, these regions represent ideal targets for the discovery of new segmental aneusomy syndromes. Second, as genomic microarrays move toward complete tiling of the human genome sequence (~30 000 BACs) one will have to understand the sequence content of each bacterial artificial chromosome (BAC) in order to interpret the array result properly. As segmental duplications vary in size and degree of sequence identity, we sought to explore the effects of segmental duplications within the array format and the value of array CGH technology in the detection of large scale structural rearrangements. Specifically, we used well characterised BACs of varying duplication content in addition to unique BACs as array elements in the development of a specialised 15q11–q13 microarray.
In this study, we assessed the effectiveness of our approach to microarray design by focusing on a small unstable region of the genome. By using breakpoint flanking BAC clones as well as testing clones with varying degrees of segmental duplication, we demonstrate the value and limitations of this approach in detecting a wide range of genomic dosage imbalances among normal individuals and clinically characterised patient material.
METHODS
Clinical samples
All array CGH hybridisations were conducted blind to the genotype of the sample. The DNA samples we used were obtained from patient derived cell lines and characterised using a combination of cytogenetic methods and microsatellite analysis. Reference DNA for array hybridisations was obtained from a healthy anonymous blood donor. Normal samples used in these studies were obtained from unaffected individuals from the University Hospitals of Cleveland Center of Human Genetics under appropriate informed consent protocols. For the PWS/AS samples, FISH analysis using BAC RP11-289D12 was used to differentiate class I and class II deletions. The panel of microsatellite markers used to characterise the patient samples included STS D15S541, D15S542, D15S1035, D15S543, D15S1002, D15S1048, D15S1019, and D15S165. Note that not all samples were analysed cytogenetically and characterised with all STS markers; typically a combination of the techniques was employed. The genomic DNA samples in our study were obtained from the resources of the CWRU Center for Human Genetics.
Clone characterisation
DNA for all arrayed clones was isolated (Nucleobond, Clontech) and subjected to BAC end sequencing using standard protocols with vector primers. The end sequences were then used in sequence similarity searches against the set of accessions chosen for the array in order to verify identity. To confirm experimentally the localisation of each BAC selected for the array, DNA from each clone was labelled fluorescently and used as a probe in FISH assays on human metaphase chromosomes, in accordance with standard protocols.12 Twenty metaphase preparations were examined for each hybridisation experiment. The duplication content of the arrayed BAC clones was determined by sequence similarity searches against the NT/HTGS nucleotide databases, published reports of known duplicons, and the segmental duplication database (SDD; http://humanparalogy.gene.cwru.edu).6 To illustrate graphically the relation between clones RP11-483E23, RP11-13O24, RP11-540B6, and RP11-26F2, the program Miropeats was used.13
Array CGH
Microarrays were prepared as previously described.10 Briefly, ligation mediated PCR of MseI digested BAC DNA is used to create a DNA representation of each BAC clone. These DNA solutions are spotted in triplicate on chromium coated slides. For normalisation purposes, 200 unique BAC clones mapping to other regions of the genome were included. Patient genomic DNA extraction and array hybridisation were undertaken as previously described.10,14 Arrays were imaged with a custom CCD camera system and analysed using the UCSF SPOT software package.15,16
Relative DNA dosage was determined by calculating the fluorescence intensity ratio produced by hybridisation of differentially labelled experimental and control genomic DNAs to the array. The ratio of experimental to control fluorescence is linearly proportional to the relative dosage between the two samples over a wide dynamic range.15 Ratio data are normalised so that the median ratio is set to 1.0. Thus the ratio response is linear but the slope of the curve is less than ideal. We also report data as the logarithm to the base 2 of the ratio, which conveniently allows display of data over a wide dynamic range and facilitates calculations. On this scale, the normalisation results in the median log2 ratio being 0. A sequence that is present at half the dosage in the sample relative to the reference sample would ideally have a log2 ratio of −1. A sequence that has a factor of 1.5 increase in dosage (a haploid duplication, for example) would ideally have a log2 ratio of 0.58. The linear and logarithmic data formats are completely equivalent.
RESULTS
Clone selection
Clones were manually selected from the human genome assembly (August 2001 assembly) and in accordance with previous BAC/YAC mapping efforts (fig 1).17,18 The 18 clones used in this study span approximately 10 Mb with a resolution of 1 BAC per 550 kb. The vast majority of clones (17 of 18) were in the sequencing queue at the time of selection. One exception, RP11-219B16, was represented as low pass sequence (phase 0) in the HTGS database; however, subsequent fluorescent in situ hybridisation (FISH) and sequence analysis (Supplemental) indicated that the sequence in accession AC068962 is not representative of the single colony isolate of RP11–219B16 used in this study. The clones can be divided into groups based on the position of the known common rearrangement breakpoints (fig 1; table 1).5,18,19 In terms of duplication content, the clones vary in the amount of duplicated material as a percentage of the total sequence of each accession, the sequence similarity of the duplications, and the interchromosomal or intrachromosomal nature of the duplicated material (table 1). The correlation of array CGH fluorescence intensity ratios with microsatellite genotyping and cytogenetic results was done during the analysis phase of this study, and is discussed below according to genotype.
Properties of the arrayed BAC clones

Map of 15q11–q13 array clones and the extent of common 15q11–q13 rearrangements. Array clones are indicated by horizontal coloured boxes below the line, labelled with the RPCI-11 clone ID and accession number. Blue boxes indicate interchromosomal duplication, red boxes intrachromosomal duplication, and green boxes unique sequence. The common PWS/AS breakpoints, which contain intrachromosomal HERC2 and GLP/LCR15 related sequences, are indicated as the large red boxes labelled BP1, BP2, and BP3. The pseudodicentric(15) breakpoint, BP4, is indicated in purple. The map is not drawn to scale. Depicted above the BAC map are the intervals gained and lost in the most common 15q11–q13 rearrangements.
Hybridisation profiles of normal individuals
We assessed potential structural variation among a set of six normal individuals using the specialised 15q11–q13 array (table 2; N1–N6). For the majority of arrayed BAC clones, limited variation in fluorescence intensity ratios was observed; however, there were two notable exceptions. The two most proximal BAC clones, RP11-219B16 and RP11-509A17, showed log2 ratios inconsistent with theoretical thresholds expected for either equimolar representation or complete gain or loss between the reference and test genomic DNA samples. For example, for RP11-219B16, normal DNA sample N1 yielded a log2 ratio of 0.44, which is short of the theoretical level for the haploid duplication of a BAC (0.58) (Methods); however, the increased ratio is indicative of either a partial duplication of material in this BAC, or an increase in material with substantial sequence similarity (fig 2). Similarly, sample N2 showed log2 ratios of −0.55 for RP11-219B16 and −0.59 for RP11-509A17, which is less negative than the ratio expected for the haploid deletion of an entire BAC (1.0) (fig 2).
Genomic DNA samples assayed by array CGH

Array CGH profiles of normal DNA samples. The log2 relative fluorescence intensity ratios for all normal individuals hybridised to the 15q11–q13 array have been plotted linearly with respect to the proximal–distal position of the 18 BAC clones along chromosome 15 (table 1). BAC clones RP11-219B16 (array element 1) and RP11-509A17 (array element 2), which are located proximally of BP1, vary between normal individuals and appear to contain interchromosomal duplications by sequence analysis, fluorescent in situ hybridisation, and paralogous STS characterisation (table 1; Supplemental). The source of this variation may be altered copy number of the related interchromosomal sites. The remaining 16 clones, in contrast, clustered around a log2 ratio of zero, indicating equal fluorescence intensity resulted from hybridisation of the normal genomic DNA and the reference DNA.
Hybridisation profiles of 15q11–q13 sequence losses
In our analysis of deletion rearrangements we used a spectrum of patient samples, including seven PWS and AS class I deletion patients, three PWS and AS class II deletion patients, and one PWS unbalanced translocation patient (table 2; fig 3). In each case, the extent of a haploinsufficiency as measured by FISH and microsatellite genotyping was consistent with the extent of the deletion determined by array CGH. Patient samples P1–P7 showed a log2 ratio decrease for all clones mapping between BP1 and BP3 (fig 3A), and similarly, samples P9 and P10 presented reduced ratios for clones between BP2 and BP3 (fig 3B), consistent with class I and class II rearrangements, respectively. In particular, clones RP11-26F2 and RP11-289D12, located in the D15S542 region between PWS/AS common deletion breakpoints BP1 and BP2, were useful for distinguishing class I from class II PWS/AS deletions. In general, BACs which map between BP2 and BP3 (clones 5–13 in fig 3) were deleted, with an average log2 ratio of −0.76 (STDDEV = 0.16, n = 10 hybridisations; 89/90 BACs reporting) in all PWS/AS deletions examined, regardless of class. In comparison, the average log2 ratio for the normal genomic DNA samples in the identical interval averaged −0.06 (STDDEV = 0.09, n = 6 hybridisations; 54/54 BACs reporting). The non-overlapping intervals of the respective standard deviations indicate a statistically significant difference in the log2 ratios for probes in the BP2–BP3 region.

Profile of 15q11–q13 losses. Samples showing a loss of material in 15q11–q13 have been divided into subclasses according to genotype. (A) The profile of seven PWS/AS class I patients, showing a loss of material between BP1 and BP3. Note: clone RP11-37J13 (array element 14) for patient sample P1 reported incomplete data and was excluded. (B) Two PWS class II patients, showing loss of material between BP2 and BP3. (C) A PWS patient with an unbalanced translocation breakpoint between array clones 9 and 10. (D) An uncommon PWS deletion in which the BP1–BP2 interval is intact, similar to a class II deletion patient, yet the deletion extends distally to a breakpoint between BP3 and BP4.
For the 15q11.2 translocation patient sample (P11), a reduction in log2 ratios was observed for array elements in the proximal BP2–BP3 region (average log2 ratio = −0.94, STDDEV = −0.12, n = 4/4 BACs reporting). A sharp transition was observed between the four proximal array clones compared with the three distal clones in the BP2–BP3 interval (average log2 ratio = −0.04, STDDEV = 0.03, 3/3 BACs reporting) (fig 3C). Thus the breakpoint of the unbalanced translocation occurred between RP11-131I21 and RP11-10K20, consistent with previous cytogenetic and molecular characterisation of this patient sample.20
Hybridisation profiles of 15q11–q13 sequence gains
We analysed eight patient samples containing gains of 15q11–q13 including four pseudodicentric(15) supernumerary marker chromosome patients (one small, two medium, and one large), one interstitial triplication patient, two pseudotricentric(15) supernumerary marker chromosome patients, and one monocentric supernumerary del(15) marker chromosome patient (table 2). Dosage of the 15q11–q13 region in these samples ranged from three to six copies in select intervals. The array profiles of these samples consistently showed increases in fluorescence intensity ratios for intervals of varying length that correlated with the length of the rearrangement determined by microsatellite analysis and FISH (table 2; fig 4). The analysis of the supernumerary del(15) marker chromosome patient sample revealed somewhat higher background signal, which may have reflected the quality of the input patient DNA (fig 4D).

Profile of 15q11–q13 gains. Samples showing a gain of material in 15q11–q13 have been divided into subclasses according to genotype. (A) The dosage profile of a genomic sample containing a small pseudodicentric(15) marker chromosome with a distal breakpoint at BP2. The apparent lack of differential fluorescent intensity for BACs, RP11-219B16 (array element 1), and RP11-509A17 (array element 2) in this and other pseudodicentric(15) samples may reflect the presence of additional paralogous sequences in the genome, limiting the response of these clones. (B) The profile of two medium pseudodicentric(15) chromosomes, with a distal break at BP3. (C) The profile of a patient sample with a large pseudodicentric(15) marker chromosome with a distal breakpoint at BP4. (D) The profile of a supernumerary del(15) marker chromosome sample, which includes increased dosage of the PWS/AS critical region. (E) Three rare triplication profiles including one interstitial triplication and two pseudotricentric(15) marker chromosome samples. All three triplication patients appear to have a distal breakpoint at BP3. Note: clone RP11-37J13 (array element 14) in sample P18 was excluded owing to incomplete data from this hybridisation.
Correlation of dosage imbalance and log2 ratio
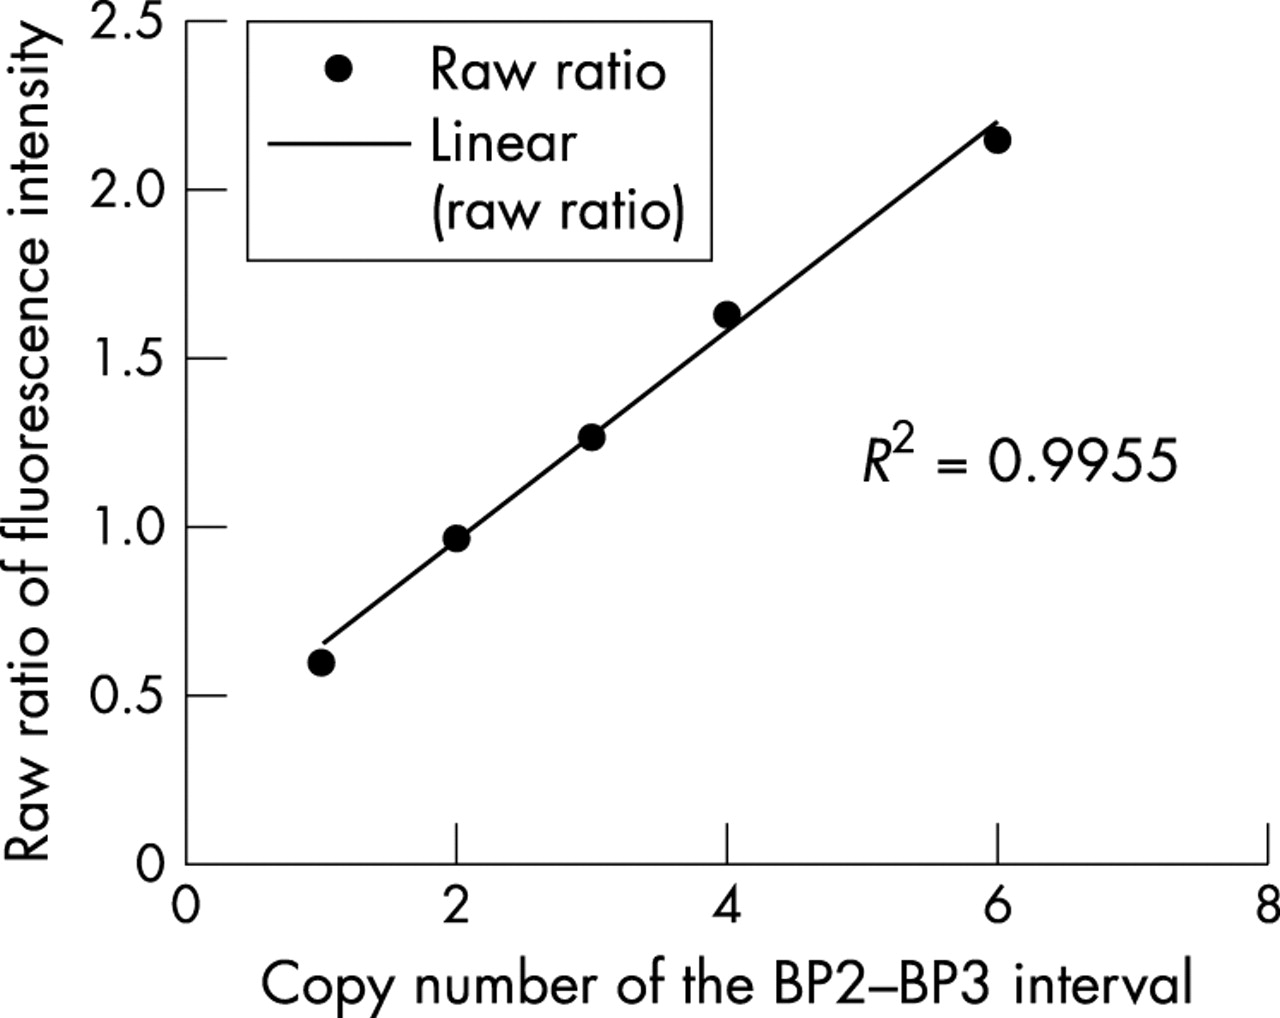
As shown previously, the relation between fluorescence intensity ratio and copy number is linear.15 We undertook a similar regression analysis to assess the behaviour of log2 ratios in clinical samples with 15q11–q13 rearrangements in relation to previous studies. Using samples with one, two, three, four, and six copies of the BP2–BP3 interval (samples P10, N1, P12, P16, and P17), the raw fluorescence intensity ratios were averaged across the interval and plotted (fig 5). The correlation coefficient (R2) of 0.995 shows an excellent fit to the linear model.

Correlation of copy number and fluorescence intensity ratios. The raw fluorescence ratios across the BP2–BP3 interval were averaged for samples known to contain one, two, three, four, and six copies of the region (samples P10, N2, P12, P16, and P17). The data fit a linear regression model with a correlation coefficient of 0.995, confirming a linear relation between copy number and fluorescence intensity, in addition to providing a measure of array performance across independent experiments.
Duplication sensitivity of arrayed clones
It was noted during qualitative analysis of the array CGH profiles that certain BAC clones consistently showed unexpected deviations in fluorescence intensity ratio. These deviations were typically inconsistent with neighbouring clones and not contiguous with the genomic rearrangement in the patient sample. In addition, aside from the variation noted above for the most proximal BAC clones in normal individuals, deviations were only observed in patient samples with dosage imbalances. For example, the profile of the small pseudodicentric(15) sample (P14) showed an increased dosage of material in the BP1–BP2 interval, yet RP11-483E23, and to a lesser extent RP11-540B6—which map distal to the BP1–BP2 region—showed an increase in fluorescence intensity ratio (fig 6). This effect was also observed for the PWS unbalanced translocation (P11) profile, in which BACs RP11-483E23 and RP11-540B6 showed marked decreases in fluorescence intensity ratio despite their position distal of the deleted interval. Both of these clones harbour segmental duplications (HERC2) (fig 7; table 2) which are also present in more proximal sequences such as RP11-13O24.
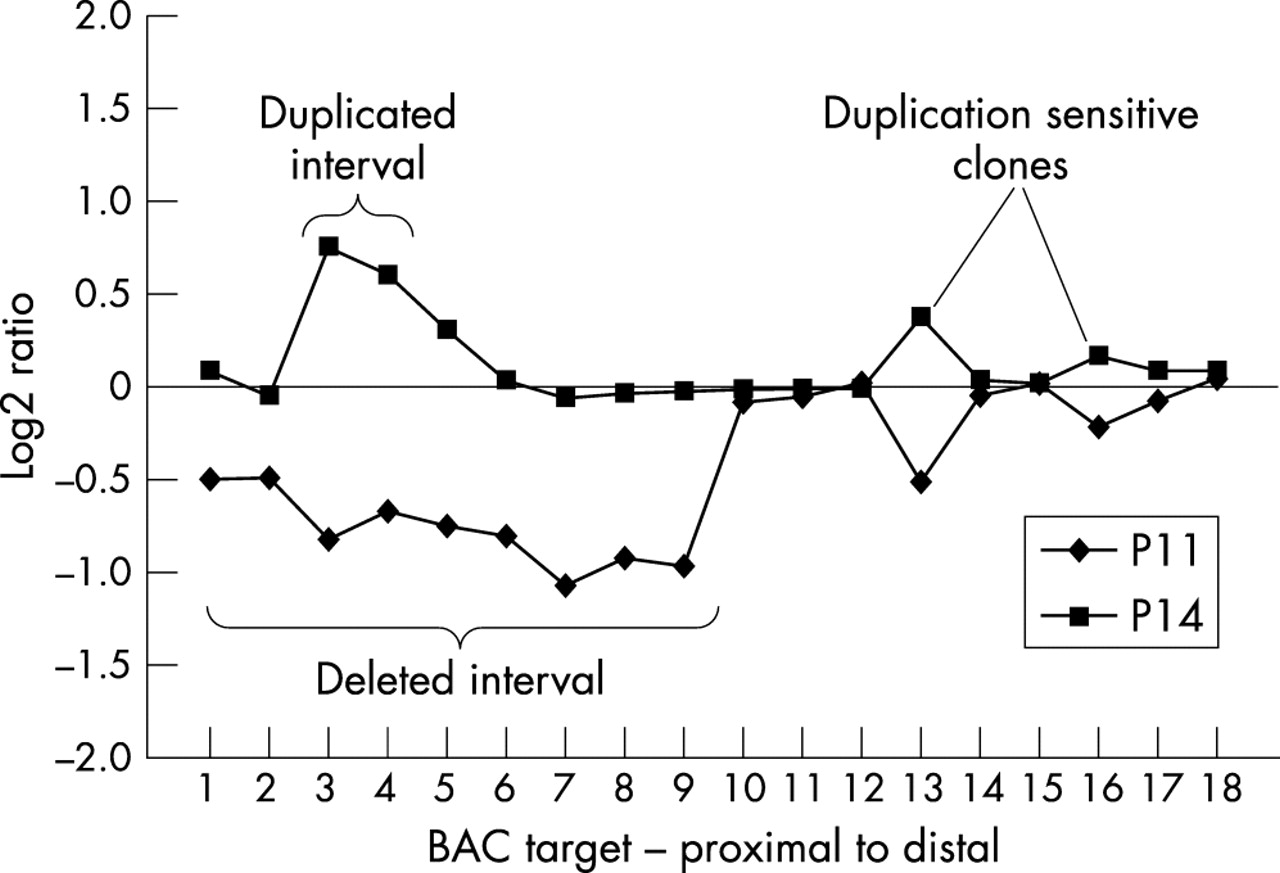
Duplication sensitivity of arrayed clones. RP11-483E23 (array element 13), and to a lesser extent RP11-540B6 (array element 16), appear to be influenced by remote genomic rearrangements, shown by the deviations in log2 ratio observed for these distal clones in samples with proximal 15q11–q13 rearrangements. Our term for the response to the gain or loss of non-contiguous material, probably reflecting the presence of segmental duplications in the distal array BAC clones, is “duplication sensitivity.”
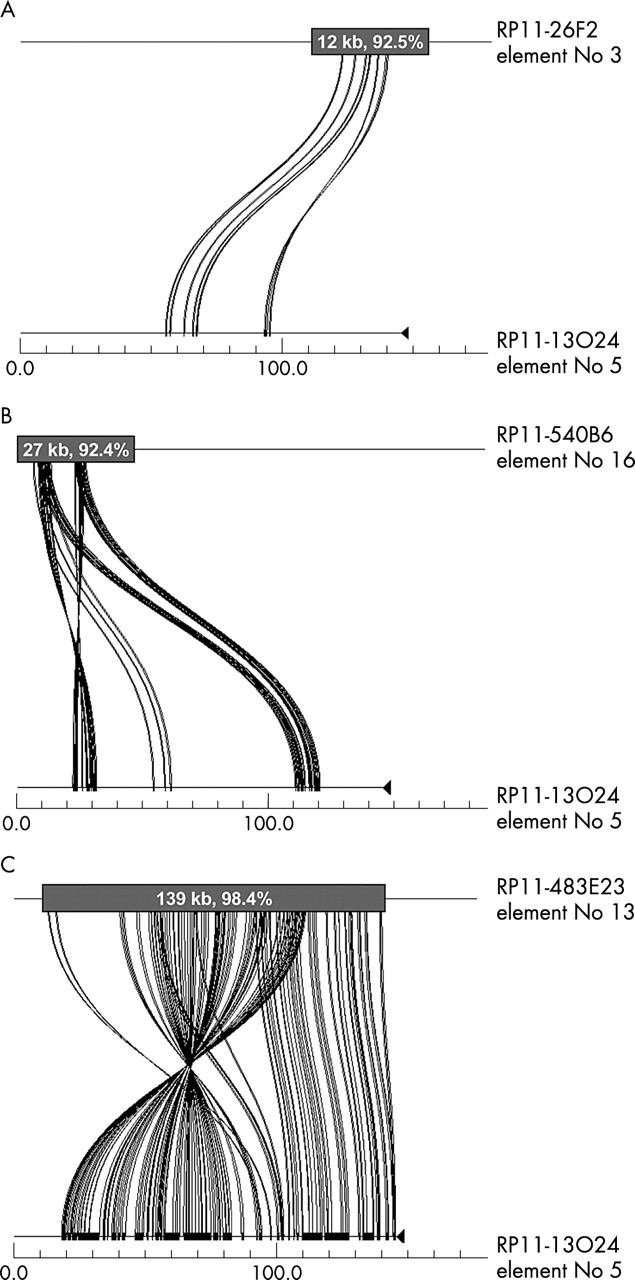
Sequence similarity, duplication content, and duplication sensitivity. The program Miropeats was used to illustrate the relation between clones RP11-26F2, RP11-13O24, RP11-483E23, and RP11-540B6. All four of these clones contain HERC2 and/or GLP/LCR15 related sequences; however, the total fraction of duplicated sequence in each clone, and the degree of similarity of that duplicated sequence to other sites in the genome, varies among the clones. For example, RP11-13O24 and RP11-26F2 (panel A) share 12 kb of sequence (92.5%), RP11-13O24 and RP11-540B6 (panel B) share 27 kb of sequence (92.4%), and RP11-13O24 and 483E23 (panel C) share 139 kb of sequence (98.4%). Therefore the duplication sensitivity seen with RP11-483E23, and to a lesser extent RP11-540B6, is probably a result of the segmental duplications present in these clones.
DISCUSSION
Through the use of a BAC microarray designed specifically for the highly variable 15q11–q13 region, we have shown that array CGH is effective at discerning the extent of dosage imbalance in a wide spectrum of clinical samples. As part of the analysis, we selected BACs that contained segmental duplications. Because these duplicated BACs varied in content, degree of sequence identity, and distribution of segmental duplications, we were for the first time able to assess the effect of paralogous sequences on microarray detection sensitivity. Two effects were noted.
First, it appears that duplicated templates may mimic effects (that is, exaggerate the fluorescence intensity ratios) that are consistent with partial gains or losses, but which involve rearrangement events that have occurred elsewhere in the genome. These secondary regions contain duplicated sequence which, when deleted or duplicated, concomitantly alter intensity levels at all duplicated loci. This was particularly evident for large blocks of segmental duplication with the highest degree of sequence identity (>98%) such as the HERC2 duplication.
Second, fluorescence intensity levels for such sites were generally suppressed when compared with theoretical expectations for a discrete gain or loss of a copy. The most notable example of this was observed among the highly duplicated 15q11 pericentromeric clones where the fluorescence intensity ratios were inconsistent with pseudodicentric(15) rearrangement as predicted by FISH. Such effects were not observed among unique clones that did not contain segmental duplications.
We conclude that the duplication content of BAC templates is an important consideration in the construction of BAC microarrays. Unlike common repeats such as Alus and LINES, duplicated regions cannot be effectively blocked by Cot1 DNA. Consequently significant departures from the expected 1:2 and 3:2 ratios for haploid deletions and duplications can occur. Data interpretation may be particularly compromised when the duplications are large (~50–100% of the BAC) and highly identical (>98%).
Our study also revealed some interesting aspects of 15q11–q13 genomic instability. Among normal individuals, variation in relative fluorescence signal intensity was noted near the pericentromeric region consistent with previously reported large scale structural polymorphism. Such variation among normal individuals should be taken as a cautionary note in a clinical setting. It emphasises the need to consider multiple BACs over the critical region before a final “karyotype” diagnosis is reached. Among patient material, most rearrangements occur, as expected, at the classically defined PWS/AS breakpoints BP1, BP2, and BP3. In this study, distal breakpoint BP3 was the most common breakpoint terminus of all the 15q11 dosage imbalances (15/19). Two samples, however, involved rearrangements that extended distally to BP3. One patient with a large pseudodicentric(15) chromosome showed a breakpoint localisation at BP4. This is in agreement with previous reports of larger 15q11–q13 supernumerary marker chromosomes.18,19 Surprisingly, analysis of one patient sample, a class II AS deletion patient, predicted an atypical breakpoint between BP3 and BP4. This event is probably a rare occurrence, as no deletions beyond BP3 have been documented previously. Interestingly, the distal breakpoint in this sample corresponds to a region recently characterised as the pericentric inversion breakpoint of chromosome 15 in the chimpanzee.21 This site was recently shown to harbour extensive segmental duplication, including copies of the LCR15 duplicon, which have been associated with other PWS/AS breakpoints.21,22 Rearrangements involving this region should be considered in further testing of PWS/AS patients.
Currently, array CGH is one of several techniques being developed to assess genomic dosage imbalance. Other competing technologies, such as multiplex amplifiable probe hybridisation (MAPH) and multiplex ligation dependent probe amplification (MLPA),23,24 involve the design of specific DNA probes ranging from 80 to 600 nucleotides in length. Compared with BAC array CGH, these methods use much smaller target sequences which could, in theory, significantly increase the precision in targeting unique regions of the genome where recurrent rearrangements are likely. A set of probes, for example, has already been developed to detect rearrangements near human subtelomeric regions.25 Complete genome coverage at the level afforded by array CGH may prove difficult to achieve. The expense and the number of required probes are currently rate limiting. In addition, the discrimination of segmental duplications which may be numerous (~40 copies) and highly identical (99.9%) will require methodological advances irrespective of the technology.
For the diagnosis of clinical 15q11–q13 rearrangements we have shown that a single assay measuring dosage across a complex region of the genome may be done accurately and robustly using array CGH technology. Correct interpretation, however, requires sufficient knowledge of the underlying sequence including the behaviour of duplicated sequences in the array format. As duplicated regions show a greater proclivity to rearrange, a consideration of this fact will facilitate the design of future arrays as well as the interpretation of array data. For future experiments, one may wish to avoid such regions, or evaluate array data while employing global segmental duplication analyses. This combined approach will provide clinically relevant information for most of the human genome with minimal error.
Acknowledgments
We would like to thank Julie E Horvath for helpful comments on the manuscript. This work was supported in part by NIH grants HD043569 to EEE and ES10631 to RDN and EEE, in addition to NCI grants CA83040 to DP and CA84118 to DA.