Article Text

Abstract
Methods: The 22q13 deletion syndrome (MIM 606232) is characterised by moderate to profound mental retardation, delay/absence of expressive speech, hypotonia, normal to accelerated growth, and mild dysmorphic features. We have determined the deletion size and parent of origin in 56 patients with this syndrome.
Results: Similar to other terminal deletion syndromes, there was an overabundance of paternal deletions. The deletions vary widely in size, from 130 kb to over 9 Mb; however all 45 cases that could be specifically tested for the terminal region at the site of SHANK3 were deleted for this gene. The molecular structure of SHANK3 was further characterised. Comparison of clinical features to deletion size showed few correlations. Some measures of developmental assessment did correlate to deletion size; however, all patients showed some degree of mental retardation and severe delay or absence of expressive speech, regardless of deletion size.
Conclusion: Our analysis therefore supports haploinsufficiency of the gene SHANK3, which codes for a structural protein of the postsynaptic density, as a major causative factor in the neurological symptoms of 22q13 deletion syndrome.
- 22q13
- deletion
- syndrome
- SHANK3
Statistics from Altmetric.com
Chromosome 22 is involved in numerous chromosomal syndromes. In particular, 22q11 is involved in partial tetrasomy (cat eye syndrome, CES), partial trisomy (the der(22) syndrome), and deletion (velocardiofacial syndrome/DiGeorge syndrome, VCFS/DGS, also referred to as the 22q11 deletion syndrome).1 With a frequency of approximately 1 in 5600 live births,2 the 22q11 deletion syndrome has also occasionally been called “the 22q deletion syndrome”. However, a second, equally important deletion syndrome exists involving 22q13.
The first case of the 22q13 deletion syndrome3 was identified cytogenetically and was the result of a rearrangement of a familial pericentric inversion of chromosome 22. Since this first case, approximately 70 patients with the 22q13 deletion syndrome have been reported.4 In most cases the patients were cytogenetically identified as having a simple 22q13 deletion. Despite a lack of phenotypic similarity to VCFS/DGS, a number of microdeletions were identified fortuitously by the absence of signal from the 22q13 control probe from commercially available VCFS/DGS fluorescence in situ hybridisation (FISH) probe kits.5–8 A percentage of 22q13 deletions are the result of unbalanced translocations and therefore their phenotype is complicated by the presence of duplicated material from a second chromosome (8/37 patients4). Deletions of 22q13 are also associated with ring chromosome 22,9 which is usually complicated by mosaicism of the r(22).
A recent clinical review of the 22q13 deletion syndrome compared the phenotype of 37 patients with 24 published cases.4 All 37 cases identified in this report presented with global developmental delay and absent/severely delayed expressive speech. Hypotonia was present in 97% of cases and 95% showed normal to accelerated growth. Other less common features associated with this syndrome include: increased tolerance to pain, abnormal, dysplastic toe nails, chewing behaviour, large, fleshy hands, dysplastic ears, a pointed chin, dolichocephaly, ptosis, tendency to overheat, and epicanthic folds. Many of these features have also been reported in the published cases. Very few organ malformations have been reported in patients with the 22q13 deletion syndrome.
The study of rare 22q13 abnormalities led us and others to propose that haploinsufficiency of the gene SHANK3/PROSAP2 (hereafter referred to as SHANK3) is responsible for the major neurological features (mental retardation, delay of expressive speech) of the 22q13 deletion syndrome.10–12SHANK3 is located within 200 kb of the chromosome 22 telomere, and is partially deleted in both 100 kb12 and 130 kb13 deletions associated with the 22q13 deletion syndrome phenotype. SHANK3 was also found to be disrupted in a child with a t(12;22) balanced translocation and features of the 22q13 deletion syndrome.11 SHANK3 is a structural protein found in the postsynaptic density.14–16 Thus, the chromosomal location and protein localisation of SHANK3 make it an excellent candidate for affecting neurological functions. However, its role in the 22q13 deletion syndrome is still uncertain, since the sizing of relatively few 22q13 deletions by molecular analysis has been published.5,12,13,17–19 The most comprehensive report on deletion size compared only seven patients with cytogenetically visible deletions,18 representing deletions between 5 Mb and 8 Mb. The region containing SHANK3 has been analysed in even fewer patients.12,13
If SHANK3 haploinsufficiency is responsible for most neurological features in the 22q13 syndrome, then all such deletions should include the gene and the size of the deletion should not strongly correlate with the phenotype. We have therefore determined the size of the 22q13 deletions of over 50 patients using minisatellite, microsatellite, and FISH analysis. The deletions were found to vary in size from 130 kb to greater than 9 Mb, but all cases that could be analysed for the terminal 130 kb region containing SHANK3 showed a deletion of this gene (45/56). A single patient with a slightly different phenotype and an interstitial 22q13 deletion is described elsewhere (Wilson et al, manuscript in preparation). Using a large group of patients, many of whom were examined by the same team of developmental paediatricians/geneticists, we detected few correlations between the size of the deletion and the clinical features observed. Although some measures of developmental assessment did correlate to deletion size, all patients showed the cardinal features of mental retardation and delay of expressive speech regardless of the deletion size. Our analysis therefore supports haploinsufficiency of SHANK3 as the major causative factor in the neurological symptoms of 22q13 deletion syndrome.
MATERIALS AND METHODS
Selection of patients
Patients were selected based on having a visible cytogenetic abnormality of the terminal region of chromosome 22q, a deletion detected via FISH analysis with the VCFS/DGS FISH probe (absence of signal from the 22q13 control probe), or a previously characterised deletion of 22q13. Control 22q13 probes used were D22S39 from Oncor (located between D22S1170 and D22S526, fig 1), ARSA from Vysis, or N85A3 from Cytocell. Local cytogeneticists made the identification of the 22q13 deletion. Nine of the patients in this study had been previously published: 1/NT and 10/LM in Flint et al20; 1/NT also in Wong et al13; 15/CH, 17/AJ, 18/JT, 22/QM, 35/CB, 39/FB, and 49/NS in Nesslinger et al18; 39/FB also in Phelan et al21; 22/QM also in Zwaigenbaum et al22; 13 in Eydoux et al23; 20 in Feldman et al24; and 30 in Powell et al.25 Blood samples or cell lines were obtained on all of the patients and many of the parents.

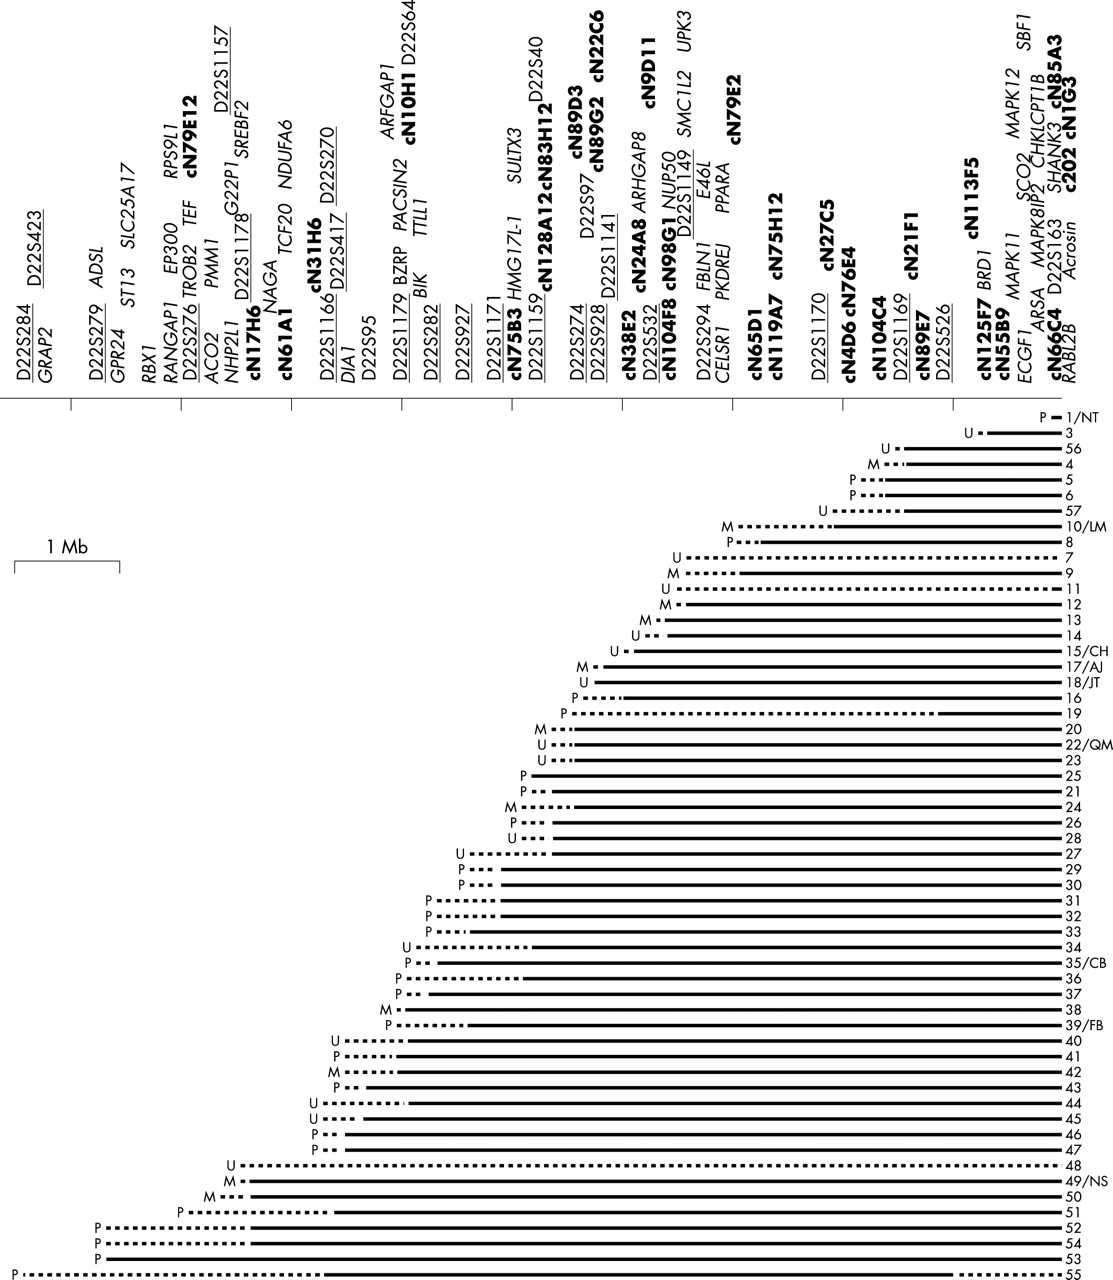
Summary of the sizes of 56 patient deletions and map of the genes and probes in the 22q13 deletion region. Each patient is represented by a horizontal line. A solid line indicates a confirmed deletion, whereas a dotted line indicates an uninformative region of the deletion. To the left of each line, a P represents a paternal deletion, an M represents maternal deletion, and a U indicates that the parent of origin is unknown. The numbers on the right side of each line indicate individual patients. Initials refer to identifiers in previously published cases. The line at the top represents chromosome 22. The microsatellite markers used in this study are labelled by underlined text above the line. Cosmids used in FISH analysis are labelled in bold text, and other markers used are in plain text. Known genes in the region are labelled in italics. A wide range of sizes of deletions is observed in these patients, from 130 kb to >9 Mb. Size bar indicates a distance of 1 Mb. There are 56 patients represented (1–57, there is no patient 2).
Patients 6, 9, 12, 14, 16, 19–22, 24–29, 31, 32, 34, 35, 38–42, 44, 46–50, and 52–55 were all examined by the same group of clinicians and the clinical features were summarised in Phelan et al.4 All of these patients and their families are part of the Deletion 22q13 Support Group.
The remaining patients in the study were obtained through contact with the parents, physicians, or other clinicians. The clinical features in these patients were obtained through examination of the medical records. Thus, the information regarding the clinical features of these patients was not necessarily as comprehensive.
The Faculty of Science Research Ethics Board of the University of Alberta approved this study, and informed consent was obtained from participants.
Developmental assessment
The Developmental Profile II (DPII) is an 186 item scale designed to assess a child’s functional developmental level.26 It was administered as a parent interview. The DPII consists of five scales: (1) Physical, fine and gross motor skills; (2) Self Help, daily living skills such as eating, dressing, and toileting; (3) Social, interpersonal relationship abilities; (4) Academic, including pre-academic skills; and (5) Communication, expressive and receptive communication including verbal and non-verbal language skills. The Intelligence Equivalence is a composite of these five scales.
The Scales of Independent Behaviour-Revised - Full Scale (SIB-R)27 is a comprehensive measure of adaptive and problem behaviours. It is a parent interview consisting of 259 items that are organised into four adaptive behaviour clusters: (1) Motor skills, gross and fine motor; (2) Social Interaction and Communication Skills, social interaction, language comprehension, and language expression; (3) Personal Livings Skills, eating and meal preparation, toileting, dressing, personal self-care; and (4) Community Living Skills, time and punctuality, money and value, work skills, and home/community orientation. The Broad Independence Scale is a composite of the four clusters. In addition, parents also completed the Maladaptive Behaviour Index Profile. This index measures problem behaviours that interfere with daily functioning including self-harm, repetitive habits, withdrawal, uncooperative behaviour, socially offensive behaviour, destruction of property, disruptive behaviour, and harm to others.
Analysis of patient deletions
DNA was extracted using the protocol of Gustincich et al28and metaphase cell preparations were done on many of the patients using the protocol of Arakai and Sparkes.29 Minisatellite analysis was done with the probe D22S163.30 Genomic DNA of the patients and parents was digested with Sau3A, electrophoresed, and transferred to a membrane for Southern blot analysis (modified from Sambrook et al31), probed with D22S163 labelled either using a random priming method31 or Ambion® Strip-EZ DNA kit, and hybridised in a variation of the Church and Gilbert hybridisation solution.32
Twenty-two microsatellite loci (fig 1) were selected throughout the region of the largest previously characterised deletion patient NS from Nesslinger et al18 and were ordered from Research Genetics. The forward primer was end labelled with either [32P]dATP, [33P]dATP, or a fluorescent label. PCR reactions were carried out on patient samples and parental samples if available (39/56 patients) using a modification of Research Genetics’ protocol and electrophoresed on either a 6% or 8% polyacrylamide gel. Microsatellites were analysed either by using autoradiographs or ABI 377 Automated Sequencer (Applied Biosystems).
DNAs were used as probes for FISH analysis of metaphase cell preparations of 45/56 patients. The DNA was isolated using QIAGEN® Maxi Kit and was labelled using GIBCOBRL® BioNick Labelling system. The biotinylated probes were detected using the protocol described in McTaggart et al33 with FITC-avidin and anti-avidin purchased from either Oncor or Vector Laboratories.
Expression of SHANK3
Northern blots were purchased from Clontech Laboratories Inc. Probes for Northern Blot analysis were labelled using the Ambion® Strip-EZ DNA or PCR kits. Northern blots were hybridised overnight in 50% formamide, 0.02% SDS, 0.4 mg/ml herring sperm DNA, 5 × SSPE, 10 × Denhardt’s at 42°C. The final washes of the blots were in 0.1 × SSPE, 0.1% SDS.
RNA was isolated from tissues using TRIZOL® from GIBCOBRL® and mRNA was isolated from total RNA using the Promega PolyATtract® System IV. GIBCOBRL®’s THERMOSCRIPT RT-PCR System was used to create cDNAs from the RNA templates. Primers for RT-PCR were designed throughout the gene to identify the transcript of SHANK3. Products obtained were sequenced using either a LI-COR IR2 with fluorescently labelled primers (ThermoSequenase® Amersham Pharmacia Biotech Limited) or ABI Prism 377 Automated Sequencer (Applied Biosystems) with the DYEnamic ET Terminator Cycle Sequencing Kit (Amersham Pharmacia Biotech Limited).
RESULTS
Cytogenetic analysis of patients
Eleven patients had deletions that arose from an unbalanced translocation; three were familial translocations (two maternal, patients 9 and 12, and one paternal patient 31) (table 1). In addition to a t(22;acro) in patient 32, the child was also mosaic for a marker chromosome of unknown origin. Patient 43 was mosaic for the 22q13.3 deletion with 90% of his cells showing the deletion. One patient (No 13) was found with a complex chromosomal rearrangement involving chromosomes 21 and 22. No loss of chromosomal material from chromosome 21 was observed cytogenetically, but a deletion of material from 22q13 was observed cytogenetically and verified molecularly.
Summary of unusual patient karyotype and cytogenetic information
Developmental analysis of the patients
All participants were in the moderate to profound mentally retarded range of functioning. The mean age equivalent on the DPII is 19.7 months and on the SIB-R is 14.2 months (table 2). Functional performance can be compared to the mean chronological ages of the sample of 33.9 months. There were no participants in the study with an overall age equivalent greater than 23 months on any non-motor variable. Severe language and social deficits are a hallmark of 22q13 deletion. Children with 22q13 have no efficient or functional semiotic medium. No participants of any age have cognitive ability greater than an age equivalent of 23 months. However, participants had fewer maladaptive behaviours than children of a similar level of cognitive ability. The Maladaptive Behavior Index has a range from +5 to −70, with a mean of 0 and a standard deviation of 10. The sample had a mean of −4.6. This indicates a normal level of problematical behaviour. No child had a score of less than −14. Compared with most children with severe to profound mental retardation, children with 22q13 deletion syndrome have far less frequency and severity of problematical behaviour.34 Overall, there were no exceptions to the finding that all children with 22q13 deletion syndrome have moderate to profound mental retardation.
Scales of Developmental Profile II (DPII) and Independent Behaviour-Revised (SIB) Results
Verifying the loss of SHANK3 in 22q13 deletion patients
The polymorphic minisatellite D22S16335 is located approximately 130 kb from the telomere of 22q (fig 1). It marks the site of the 1/NT deletion breakpoint and also falls within intron 7 of SHANK3. All of the patients tested with this probe (50/56) showed a single band at this locus, indicating either hemizygosity or homozygosity. Of the patients where parent DNA samples were available, 38% were informative for this locus (15/38 patients tested) and the deletion of this region could be verified in each informative case. If D22S163 was uninformative, the terminal deletion of 22q was verified using FISH analysis with cosmids c202, cN1G3, cN85A3, and cN66C4, which span 130 kb directly adjacent to the 22q subtelomeric repeats13 (fig 1). Results were obtained for a total of 30 patients with at least one of these cosmids. Using D22S163 and FISH, the terminal deletion of 22q has been confirmed in all patients that we were able to test (45 out of 56 patients, 80%). In the remaining patients, parental samples were either not available or uninformative and metaphase preparations were unavailable for FISH analysis.
Determining deletion size
In order to determine the size of the deletion in the 56 patients, PCR analysis of a variety of microsatellite markers (fig 1) was carried out using the patient DNA and the parental DNA if available (39/56). When parental samples were not available or were uninformative, a single band in the patient was considered uninformative while two alleles showed that the locus was not deleted. The number of uninformative results, where parental DNA was available, ranged from 0% (D22S272) to 59% (D22S1159). Some patients showed large regions of uninformative microsatellites, such as patient 19. For these cases, as well as patients without parental DNA samples and the patients with smaller deletions, further analysis was carried out by FISH if metaphase cell preparations were available (45/56 patients).
By combining the minisatellite, microsatellite, and FISH analysis, we have obtained the approximate sizes of the 22q13 deletions in 56 patients (fig 1). These deletions show a wide range of size from the 130 kb of the 1/NT deletion to the >9 Mb deletion found in patient 53. In some cases the deletion could only be partially characterised. For instance, patients 7, 11, 19, 48, and 55 had large regions of uninformative microsatellites and no metaphase cell preparations. However, patient 19 was confirmed as having a terminal deletion using D22S163 and patient 11 was confirmed by FISH analysis. Cytogenetically identified deletions in patients 7 and 48 have not been confirmed at the molecular level since neither parental DNA nor metaphase cell preparations were available. In these cases only the maximum size of the deletion, based on microsatellite heterozygosity, could be determined.
Parental of origin of the deletions
Parental origin of the deletions could be determined from the minisatellite and microsatellite analysis if parental DNA samples were available (fig 1). In all 39 cases, the parent of origin of the deletion was consistent over all informative probes. There were considerably more paternal germline deletions (27/39) than maternal germline deletions (12/39) observed. A chi-square analysis with the null hypothesis that both types of deletions should occur in equal frequency yielded a chi-square value of 5.76 and a p value of 0.0163, suggesting that significantly more paternal germline deletions exist in this sample population.
Analysis of the phenotype of the 22q13 deletion syndrome patients
Phenotypic information on these patients was obtained through a variety of sources, although comprehensive phenotype information was not available for all patients. All patients were described as having mental retardation and severely impaired expressive speech. Most of the patients also presented with hypotonia and several mild dysmorphic features. Patients 9, 10/LM, 12, 31, and 57 were removed from the phenotype analysis since their deletions were known to be the result of an unbalanced translocation with a duplication of material on another chromosome that could contribute to the phenotype. Other patients listed in table 1 were included in the analysis because there was no evidence of additional gain or loss of DNA except for acrocentric p arms. The parents of the patients in this study did not show any detectable clinical features of the 22q13 deletion syndrome.
Linear regression was used to obtain a coefficient of correlation to deletion size for each feature (table 3). The coefficient of correlation ranged between 0 and 0.6. The F value was examined to determine if the coefficient of correlation was significant. For most features no correlation to deletion size was found. However, several clinical features were found to have a statistically significant correlation with the size of the deletion, including 4/12 components of the developmental assessments, hypotonia, head circumference, recurrent ear infections, pointed chin, and dental anomalies. At a significance level of 0.05, one would expect 1 in 20 significant correlations by chance, whereas 9/50 (18%) correlations were observed in this population.
Comparison of clinical features and the size of the 22q13 deletion, using linear regression to obtain a coefficient of correlation. Measures used for developmental assessment include the Scales of Independent Behaviour (SIB) and the Developmental Profile II (DPII). Number of patients indicates the number of patients for whom data was available in that category. AE - age equivalent
The clinical features were also compared to the parent of origin of the deletion to determine if there is any subtle imprinting effect. Contingency tables and chi-square analysis was used to see if the two variables were independent (table 4). In some of the chi-square analyses, the null hypothesis that the two variables are independent of each other was rejected on a p value of less than 0.05, suggesting some effect of the parent of origin on the clinical feature. Two components of the developmental assessment showed rejection of the null hypothesis with paternal deletions having lower scores on the developmental assessment than maternal deletions. High palate also showed rejection of the null hypothesis with a higher incidence found in paternal deletions. However, by chance, at a significance of 0.05, 1 in 20 rejections of the null hypothesis would be expected. In this sample 3/49 rejections of the null hypothesis were observed (6%), similar to the number expected by chance.
Comparison of clinical features and the parent of origin, using chi-square analysis. Measures used for developmental assessment include the Scales of Independent Behaviour (SIB) and the Developmental Profile II (DPII). AE - age equivalent.
Characterisation of SHANK3, a gene in the NT deletion region
RT-PCR, screening of cDNA libraries, and identification of ESTs were used to obtain a partial cDNA sequence of the gene interrupted by the 1/NT microdeletion. The gene was identified as SHANK3 (formerly known as PROSAP2) based on the similarity to the orthologue identified in rat14 and has been previously partially characterised.11 Alignment of the predicted proteins of the rat and human SHANK3 shows more than 90% amino acid similarity over the entire protein. All the key binding domains were conserved and in the same order found in rat Shank3, including an ankyrin repeat domain, a PDZ domain, a SH3 domain, a Homer binding domain, a SH3 binding domain, and a sterile alpha motif (SAM) domain.15 There is nearly 100% similarity between the rat and human amino acid sequence of these domains.
The alignment of the rat cDNA sequence (AF133301) to the human genomic sequence confirmed the structure of the gene (fig 2), but also identified differences between the orthologues. Analysis of human cDNAs and RT-PCR products showed two exons (22 and 23) not previously described in rat or human.11 Exon 24, which encodes the SAM domain and presumably corresponds to “exon 22” in Bonaglia et al,11 is found in the human ESTs AB051437 and AK074038 as well as the rat sequence. There is a stop codon 595 bp into exon 24, giving a predicted human protein of 1814 amino acids. ESTs AB051437 and AK074038 link the large, GC rich exon 21 directly to exon 24. Exon 21 was also joined to exon 22 by a 584 bp RT-PCR product (forward primer GCCTGAAGAC GACAAACCAA, reverse CTCAGGGGTCTGGTCCTGTA) from both fetal brain and fetal liver RNA. Exon 22 was first isolated as a 524 bp cDNA from a fetal liver library. There is a stop codon 270 bp into exon 22, giving a 1706 amino acid predicted protein which lacks the SAM domain. A 659 bp RT-PCR product (forward TTCAGGGACCCGCTGCTG, reverse ACAC CCCACGCATGCACAC) from both heart and skeletal muscle RNA connects exon 21 to exon 23, which then splices to a site 1423 bp into exon 24 (fig 2). Exon 23 spliced to an internal site in exon 24 was first seen in an 1160 bp cDNA from an adult heart library. The coding region extends through exon 23 to end at a stop codon 1574 bp into exon 24, giving a predicted protein of 1702 amino acids. This protein would also lack the SAM domain.

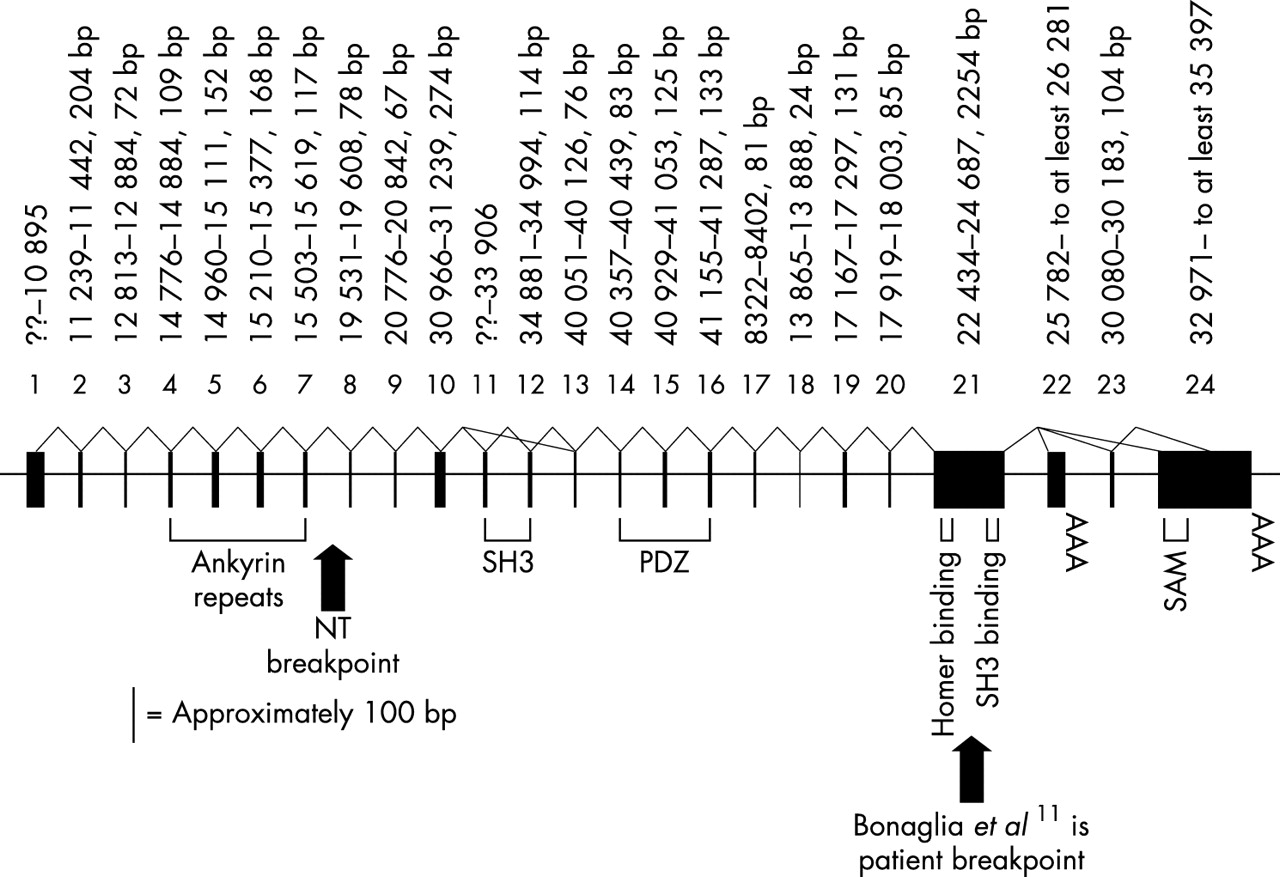
The structure of human SHANK3. Exons (black boxes) are drawn to scale but introns are not drawn to scale. The size of the exons and their location coordinates on cosmid N66C4 (AC000050, exons 1–16) or cosmid N85A3 (AC000036, exons 17–25) are given above the exons. Protein domains and two patient breakpoints are labelled below the gene. Splicing confirmed by identification of cDNAs or by RT-PCR is indicated by solid, bent lines connecting exons. Size bar of approximately 100 bp represents the scale of the individual exon’s width.
The rat cDNA sequence (AF133301) from 1535–1589 bp is predicted to be present between human exons 10 and 11, but these 55 bp were not found in human genomic sequence and there were no cDNAs that covered this region. However, Southern blot analysis using the rat 55 bp as an oligonucleotide probe showed hybridisation to both human cosmid cN66C4 (AC000050, which contains the 5′ end of SHANK3) and human genomic DNA. An approximately 1.2–1.3 kb PstI fragment that hybridised to the rat probe was cloned from cN66C4. The sequenced ends of the 1.2–1.3 kb insert mapped to a 919 bp region in the human genomic sequence that flanked the 5′ end of exon 11, suggesting that the genomic sequence was missing 300–400 bp. Sequence of the cloned insert showed that 23 bp of the human genomic sequence (between 33732 and 33754 of AC000050) is not present in the insert and 310 bp of new sequence takes its place. Comparison of this new human sequence to the rat cDNA showed that the missing 55 bp was indeed present and located directly 5′ to known sequence of human exon 11. The sequence of human exon 11, with the new sequence in bold, is: cccgagcgggcccg gcggccccggccccgcgcccggccccggcgccccccccgcaccgccgccccgg ggcccgaagcggaa actttacagcgccgtccccggccgcaagttcatcgccgtgaag gcgcacagcccgcagggtgaaggcgagatcccgctgcaccgcg gcgaggccgtgaagg. A 5′ splice site was found immediately preceding this newly extended exon. Comparison of the extended human exon 11 to the mouse genomic sequence (NW_000106.1) showed similar intron/exon structure.
Expression of SHANK3
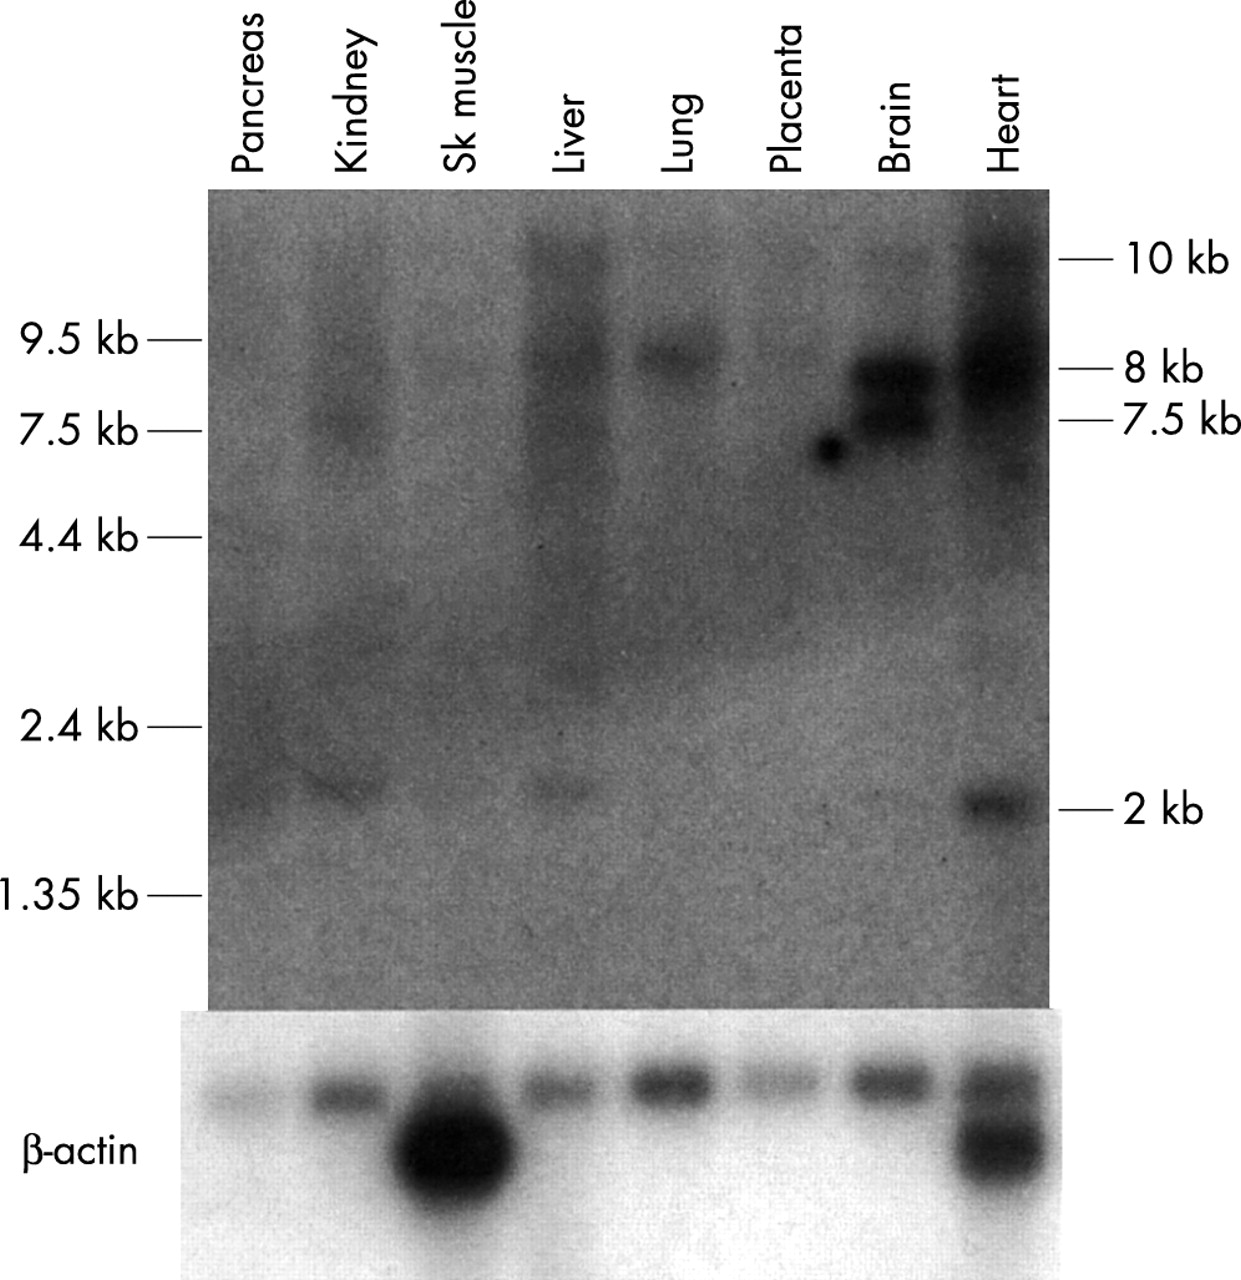
Northern blot analysis was used to determine the spatial expression pattern of SHANK3. Multiple transcripts were observed with varying levels of expression in the different tissues tested, similar to that previously described.11 The cDNA probe used, from within exon 11 to within exon 15, overlaps with the probe used previously11 (within exon 10-within exon 12). An 8 kb transcript, originally seen only in brain, also showed strong expression in heart with weaker expression in other tissues tested (fig 3). A 10 kb transcript was present in most tissues tested, but at very low levels. A 2 kb transcript was observed with strong expression in heart and weaker expression in kidney and liver. A brain predominant transcript of 7.5 kb also showed very weak expression in kidney and liver. Similar to Bonaglia et al,11 analysis of different regions of the brain showed strong expression of the 10 kb transcript in the cerebellum with lower levels in the other brain tissues tested (results not shown). The 7.5 kb and 8 kb transcripts showed moderate expression in all brain tissues tested with the exception of a lower level of expression in the spinal cord and medulla. However, the 8 kb transcript was absent from the cerebellum. The Northern blot analysis of SHANK3 in humans shows that expression of this gene is complex with many different transcripts at different levels in different tissues. The analysis of ESTs also supports expression in tissues other than the brain, since cDNAs were found originating from brain, uterus, lung, heart, prostate, kidney, spleen, germ cell, colon, placenta, and pancreas, using the exon 22 or exon 23/24 alternate 3′ ends.

Multiple tissue northern blot analysis of SHANK3 in humans. The probe used contains human SHANK3 exons 11 to 15. An 8 kb band is observed in most lanes and showed strongest expression in brain and heart. A 7.5 kb band is observed strongly in brain and weaker in kidney. A weak band of 2 kb is observed in most lanes, as well as a large 10 kb band showing a similar pattern of expression. The blot was stripped and reprobed with β-actin as a loading control, shown below.
DISCUSSION
The size of the 22q13 deletion shows little correlation with the severity of the phenotype
We have determined the 22q13 deletion size in 56 patients using microsatellite analysis and FISH. These deletions showed considerable variation in size from 130 kb to over 9 Mb. The smallest deletion patient (1/NT) showed only mild developmental delay and absence of expressive speech with none of the dysmorphic features commonly observed in the 22q13 deletion syndrome. This led us to compare the occurrence and severity of the clinical features with the size of the deletion in the larger group of patients studied. Our previous study18 compared only seven patients and did not look at different aspects of developmental delay. With the current larger group, many patients were examined and tested by the same team of developmental clinicians, allowing more subtle comparison.
All 56 of our patients were found to have the main neurological findings of developmental delay and delay or absence of expressive speech. However, four measures of developmental assessment showed a statistically significant correlation with the size of the deletion, with larger deletions scoring lower on these measures, while eight other measures of developmental assessment showed no significant correlation (table 2). The four measures with statistically significant correlations with deletion size are the most reliable subscales. There does not appear to be any relationship among these four correlations that implicates a specific locus of the brain or functional unit. Nearly all measures approached statistical significance. This is notable given the fairly small sample size and restricted variance on all measures in this sample. Another limitation is that few measures in psychology and education are designed to differentiate skills among children in the moderate to profound range of mental retardation, thus leading to restricted range, which results in reduced correlation coefficients. These results suggest that a major gene affecting neurological development is located in the NT 130 kb critical region, since this region is deleted in all patients with the 22q13 deletion syndrome. However, the data also suggest that other more proximal genes show additional effects in mental development, as might be expected over such a large region (up to 9 Mb).
Other clinical features also show a higher incidence or increased severity with the larger deletions, including hypotonia, head circumference, recurrent ear infections, pointed chin, and dental anomalies. Therefore, several genes that contribute to these features may be located in the more proximal region of 22q13. However, for most clinical features, there was no significant correlation with the size of the deletion, including most components (9/13) of developmental assessment. The statistical analysis suggests that the NT 130 kb terminal deletion contains a gene that has broad effects on mental development, as well as speech development, because neither the words spoken nor words recognised correlate with the size of the deletion.
Although subjects with deletions known to be the result of translocations were eliminated from the above analysis, it is possible that some other patients have undiscovered cryptic translocations. Therefore, it is possible that some correlations are confounded by increased severity owing to the presence of an unbalanced translocation, resulting in the duplication of the terminal end of another chromosome. Only the patient with the smallest deletion (patient 1 or NT) has undergone analysis of other subtelomeric regions. Patient 1 was confirmed to be a pure deletion.20
Parent of origin
The parent of origin of the deletions was obtained in 39/56 cases. There were significantly more paternal germline deletions (27/39, 69%) observed than maternal germline deletions (chi-square=5.76, 1 df, p=0.163). However, this phenomenon has been seen in other terminal deletion syndromes: paternal origin was found in 29/34 (83%) of 18q− syndrome cases36 and 17/19 (89%) of Wolf-Hirschhorn syndrome cases.37–39 It has been hypothesised that an overabundance of paternal deletions reflects a higher frequency of chromosomal breakage in male compared to female germ cells.36 Our data fit with this hypothesis. If imprinting were causing a female specific decrease in viability during development, one would expect the maternal deletions to be smaller, implicating imprinted genes in the more proximal region. Like the 18q− deletion cases,36 this is clearly not the case for maternally derived 22q13 deletions, which are scattered throughout the size range (fig 1).
The presence, absence, or severity of the clinical features of the 22q13 deletion syndrome were also analysed for a correlation with the parent of origin of the deletion (39/57 patients). For most of the clinical features, no correlation was found. Although a correlation was seen in 3/49 features, this is approximately the number of correlations expected by chance using a p value of 0.05 as a significance level. Therefore, this analysis supports the lack of imprinting on chromosome 22.40–42
The role of haploinsufficiency of SHANK3 in the neurological features of 22q13 deletion syndrome
SHANK3, ACR, and RABL2B are the only genes deleted in patient 1/NT’s 130 kb deletion as well as a recently described similar deletion.12Acrosin (ACR) is a proteinase found in the acrosome of mature spermatozoa43,44 and thus an unlikely candidate gene for the neurological features of the 22q13 syndrome. RABL2B is a widely expressed member of the RAB family of GTPases involved in vesicular trafficking in cells.45 However, the presence of a related active locus on chromosome 2, RABL2A, with only five nucleotides difference from RABL2B, makes it less likely that the loss of one of the four RABL2 genes would be responsible for abnormalities in the 22q13 deletion syndrome. Although the expression of genes proximal to the breakpoint could be affected through position effect, this does not appear to be the case for the NT microdeletion. ARSA, approximately 54 kb proximal to the deletion breakpoint in 1/NT, was shown to be expressed from both alleles in this patient.46SHANK3 (SH3 and multiple ankyrin repeat domains 3), originally identified in the rat,14–16 shows high sequence similarity to its human orthologue. The gene has also been called ProSAP2 and Spank-2. There are two other closely related genes identified in rat, Shank1 (also called synamon, SSTRIP, and Spank1)16and Shank2 (also called ProSAP1, Spank3, and CortBP1).14,15 In rat these proteins have been localised to the postsynaptic density of excitatory synapses, and are important in linking the metabotropic glutamate receptors through the interaction with a Homer homodimer and NMDA receptors through the interaction of PSD-95 and GKAP/SAPAP to the actin cytoskeleton.47 Because the Shank structural proteins interact directly with four other proteins (Homer, Cortactin, Sharpin, and GKAP/SAPAP) as well as forming homodimers in a continuous protein network in the postsynaptic density,48 any alteration of the relative proportions of such a protein could alter synapse formation and function. Overexpression of SHANK1 or SHANK3 in cultured hippocampal neurones results in alterations of dendritic spine morphology and maturation.49 Such changes in vivo could affect spine plasticity, hypothesised to be involved in memory and learning. Thus, the deletion of SHANK3, as in the patients with the 22q13 deletion syndrome, would probably contribute to abnormal brain function. Several patients have had neurological imaging studies done with abnormalities in the brain noted, including decreased/delayed myelination, reduced white matter, low density white matter, asymmetrical ventricles, enlargement of ventricles (four patients), generous extracerebral spaces, PNET aggressive malignant brain tumour, brain atrophy, prominent sulci, agenesis of the corpus callosum, hypoplastic corpus callosum, thin corpus callosum, partial absence of the corpus callosum, hypoplastic cerebellum, hypoplasia of the optic nerve, and prominent occipital and temporal horns.
The function of SHANK3, therefore, makes it an excellent candidate to be responsible for the major neurological features of the 22q13 syndrome. SHANK3 is disrupted in a patient with a t(12;22) balanced translocation.11 This child shows all the typical features of the 22q13 deletion syndrome, including mild mental retardation, severe delay of expressive speech, hypotonia, joint laxity, dolichocephaly, epicanthic folds, and bulbous nose. We have now shown SHANK3 to be deleted in all 22q13 deletions tested. All of these patients show a similar phenotype, although the degree of developmental delay appears to worsen somewhat with the increased size of the deletion. This is supported by the fact that the two smallest reported deletions12,13 and the translocation case11 all show milder mental retardation.
Because SHANK3 is a member of a family of proteins that are similar in sequence and structure, redundancy of function is a possibility. However mRNA in situ hybridisation of Shank2 and Shank3 have shown slightly different patterns of expression in rat brain.15 Using mRNA in situ hybridisations, Shank3 appears to co-localise with Shank2 in the cerebral cortex and the hippocampus. However, in the cerebellum, Shank3 is expressed only in the granular cell layer, whereas Shank2 is expressed primarily in the Purkinje cells. Thus this family of proteins may have a similar function but the complementary expression observed between Shank2 and Shank3, particularly in the cerebellum, indicates that their function may not be redundant.
At a recent support group for parents of children with 22q13 deletion, 17 of 48 children were reported to have significant regression in skills. Parents reported progress in teaching a skill for several months or years, and then the skill suddenly disappeared. The skill then returned slowly or not at all. In no case was there evidence of a neurodegenerative process as detected by an MRI, metabolic changes, or increased seizure activity as detected by an EEG. Such a regression in skills without physical evidence of changes in the brain occurs in children with autism and some other developmental disabilities. A possible hypothesis for participants in this study is that haploinsufficiency for SHANK3 may contribute to the regression. Synapses formed with half the amount of the SHANK3 protein are likely to be inefficient. As new skills are learned through experience, development, and training, there is presumed to be increased dendritic branching and development of new synapses. As complex neural pathways are developed based upon an increasing number of synapses with decreased SHANK3 protein, the likelihood of network failure grows. Eventually, there are enough inefficient synapses that neural signals are unable to traverse neural networks without failure of the system. Signal to noise ratio eventually becomes so greatly reduced that there is a collapse of the entire neural network associated with a given skill, resulting in the functional regression of the skill. Although only a hypothesis, SHANK3 may play a significant role in regression of skills in these patienst and requires further study.
Further characterisation of the human orthologue of rat SHANK3
SHANK3 is composed of 24 exons that span approximately 60 kb of genomic sequence. This complex gene shows a number of alternate splice products, including an alternate splice between exons 10 and 13 which removed the SH3 domain (fig 2). In addition, three alternate 3′ ends of SHANK3 were identified through cDNAs. However, only exon 24 contains the SAM domain of the SHANK3 protein, which allows for the formation of homodimers. Therefore the alternate 3′ ends containing exons 22 and 23/34, which do not contain the SAM domain, may be common but aberrant transcripts. Alternatively, they may represent an alternative function that does not require the SAM domain. Other members of the rat Shank genes have been shown to have alternative splicing, including variants of Shank2 affecting the N-terminal end14 and variants of Shank1 and Shank2 which lack the SAM domain.50
We have shown evidence of a deletion in the published human genomic sequence that corresponds to an extension of the predicted exon 11 to cover a 55 bp region of the rat cDNA, which is not currently found in the predicted human gene. This region of the gene is just 5′ of the SH3 domain, but does not include a known domain itself.
Our expression analysis of SHANK3 showed results similar to that of Bonaglia et al,11 although we saw low levels of transcripts in more varied tissues, particularly in the heart. In the rat, Shank3 is also expressed in non-neuronal tissues, especially in the heart.50 The expression of SHANK3 in non-neuronal tissues was confirmed by analysis of the EST database. In particular, the alternate 3′ ends (exons 22 and 23/24) are found in only non-neuronal tissues. Expression in other tissues may represent leaky expression without associated function, or it may represent an alternate function for this protein.50,51 It would be interesting to determine if the protein was expressed in non-nervous tissues.
The significance of the deletion of SHANK3
Small deletions of 22q13, undetectable by cytogenetics, may often be missed because the clinical features associated with this syndrome are not very distinct. For example, developmental delay and delay of expressive speech are found in many other disorders, including Angelman syndrome, FG syndrome, and fragile X syndrome. In fact, many of the published cases, as well as in this study, were originally tested for other syndromes.5,7,52 The dysmorphic features observed in the 22q13 deletion syndrome are mild and not present in all subjects and thus do not allow for a definitive diagnosis. If the syndrome is suspected, then commercial FISH probes produced for the DGS/VCFS syndrome (22q11 + 22q13 probe combination) may be used for identification.
There is now strong evidence that haploinsufficiency of SHANK3 plays a major role in the majority of neurological abnormalities observed in the 22q13 deletion syndrome. Therefore, mutations in the SHANK3 gene may be responsible for a percentage of cases of idiopathic mental retardation in combination with delay/absence of expressive speech, hypotonia, and mild facial dysmorphic features. Although most such patients will have other aetiologies, it may be worth screening patients for these mutations. Using polymorphic markers, a recent study found no submicroscopic deletions in 44 patients with atypical Angelman syndrome.53 However small deletions could have been missed in some patients and mutations in SHANK3 were not tested for. Patients with idiopathic mental retardation have been screened for subtelomeric deletions, with deletion of 22q13 as one of the most common findings.20,54–59 These same patients might now be screened for mutations in SHANK3, using rapid methods such as denaturing high performance liquid chromatography (DHPLC). The finding of SHANK3 mutations in patients with idiopathic mental retardation would also suggest that the other members of the SHANK family of proteins, or the proteins interacting with the SHANK3 in the postsynaptic density, could also be considered as candidate genes for idiopathic neurological abnormalities.
Acknowledgments
We wish to thank all the families and clinicians that participated in this research and The Deletion 22q13 Support Group. We thank Dana Shkolny and Helen Cheung for technical assistance. This research was supported by grants from the Medical Research Council of Canada/Canadian Institutes of Health Research and the Canadian Genome Analysis and Technology Program.