Article Text

Abstract
Background: A variety of abnormalities have been demonstrated at chromosome 11p15 in individuals with overgrowth and growth retardation. The identification of these abnormalities is clinically important but often technically difficult. Methylation-specific multiplex ligation-dependent probe amplification (MS-MLPA) is a simple but effective technique able to identify and differentiate methylation and copy number abnormalities, and thus is potentially well suited to the analysis of 11p15.
Aims: To customise and test an MS-MLPA assay capable of detecting and distinguishing the full spectrum of known 11p15 epigenetic and copy number abnormalities associated with overgrowth and growth retardation and to assess its effectiveness as a first line investigation of these abnormalities.
Methods: Five synthetic probe pairs were designed to extend the range of abnormalities detectable with a commercially available MS-MLPA assay. To define the normal values, 75 normal control samples were analysed using the customised assay. The assay was then used to analyse a “test set” of 24 normal and 27 abnormal samples, with data analysed by two independent blinded observers. The status of all abnormal samples was confirmed by a second technique.
Results: The MS-MLPA assay gave reproducible, accurate methylation and copy number results in the 126 samples assayed. The blinded observers correctly identified and classified all 51 samples in the test set.
Conclusions: MS-MLPA robustly and sensitively detects and distinguishes epigenetic and copy number abnormalities at 11p15 and is an effective first line investigation of 11p15 in individuals with overgrowth or growth retardation.
Statistics from Altmetric.com
Chromosome 11p15 contains a cluster of imprinted genes that are important in growth regulation. The imprinted genes are arranged in two domains, each controlled by a differentially methylated imprinting centre.1 Imprinted domain 1 includes the paternally expressed IGF2 gene, the maternally expressed but non-translated H19 gene, and a differentially methylated region (DMR) upstream of H19, referred to as the H19 DMR, DMR1 or imprinting centre 1. The H19 DMR is normally methylated on the paternal but not the maternal allele, maintaining imprinted expression in imprinted domain 1. Imprinted domain 2 includes the maternally expressed CDKN1C gene and the paternally expressed but non-translated KCNQ1OT1 gene. The KCNQ1OT1 promoter is normally methylated on the maternal but not the paternal allele and is referred to as KvDMR1, DMR2 or imprinting centre 2. Differential methylation at KvDMR1 is associated with the maintenance of normal imprinted expression in domain 2.
A variety of constitutional epigenetic and genetic defects affecting one or both of these imprinted domains are associated with disturbance of growth, resulting in overgrowth or growth retardation (table 1). Abnormalities in which there is hypermethylation at the H19 DMR and/or loss of methylation at KvDMR1, a relative increase in paternal 11p15 copy number or mutation of CDKN1C are associated with overgrowth, most characteristically manifesting as Beckwith–Wiedemann syndrome.1–3 Loss of methylation at the H19 DMR and maternal 11p15 duplications are associated with growth retardation phenotypes such as Silver–Russell syndrome.4–6
Abnormalities at 11p15 are identifiable in up to 80% of individuals with Beckwith–Wiedemann syndrome, an overgrowth syndrome characterised by macroglossia, anterior abdominal wall defects, neonatal hypoglycaemia, hemihypertrophy, and an increased risk of childhood tumours, particularly Wilms tumour.7 11p15 abnormalities have also been reported in individuals with features of the condition but who do not fulfil full diagnostic criteria.8 Approximately 85% of individuals with Beckwith–Wiedemann have no family history of the condition and epigenetic 11p15 abnormalities are the most frequently identifiable cause. These include isolated loss of methylation at KvDMR1 (up to 50% of cases), mosaic paternal uniparental disomy (UPD) of 11p15 (10–20% of cases), and isolated hypermethylation at the H19 DMR (2–5%) (table 1).1 Phenotypic differences between these epigenetic subgroups exist.9 For example, individuals with hypermethylation at the H19 DMR (such as those with UPD or isolated H19 DMR hypermethylation) have a clearly increased risk of Wilms tumour, while those with isolated loss of methylation at KvDMR1 do not.10 11
Truncating mutations in CDKN1C cause familial Beckwith–Wiedemann syndrome when maternally inherited and account for approximately 40–50% of familial cases. A variety of copy number abnormalities have also been reported, including paternal 11p15 duplications, and maternally inherited microdeletions of IC1 and of IC2.1–3 These account for an undetermined fraction of familial and isolated Beckwith–Wiedemann pedigrees.
Silver–Russell syndrome is a predominantly sporadic condition associated with pre- and postnatal growth retardation, facial dysmorphism and growth asymmetry.12 Recently, it has been identified that up to 60% of cases fulfilling diagnostic criteria for Silver–Russell syndrome have isolated loss of methylation at the H19 DMR.5 Loss of methylation at the H19 DMR has also been reported in individuals with features of Silver–Russell syndrome but who do not fulfil the full diagnostic criteria, but not in individuals with other growth retardation phenotypes.13 Maternally inherited duplications of 11p15 have been described in a number of individuals with a Silver–Russell-like growth retardation phenotype.4
The identification and correct classification of 11p15 abnormalities is clinically important for a number of reasons. It provides molecular confirmation of the underlying diagnosis. Differentiation of heritable from non-heritable abnormalities allows more accurate estimation of recurrence and offspring risks. This is particularly pertinent in the light of recent descriptions of inherited copy number defects in individuals that may previously have been classified by methylation analysis as having isolated methylation defects.2 3 Identification of 11p15 abnormalities also impacts on management. For example, in Beckwith–Wiedemann syndrome, it allows the targeting of Wilms tumour surveillance only at those at increased risk of the tumour.14
A number of different strategies have been employed by diagnostic and research laboratories to identify abnormalities at 11p15. No single technique is capable of detecting and distinguishing the full range of reported abnormalities. As a result, testing of the region often requires numerous separate analyses and is rarely comprehensive.
Methylation-specific multiplex ligation-dependent probe amplification (MS-MLPA) is a recently described technique capable of assaying CpG methylation status and copy number at >30 sequences in a single experiment.15 The technique is therefore suited to the simultaneous assessment of samples for the range of recognised 11p15 methylation and copy number defects.
We sought to define the normal values, optimise and test a commercially available MS-MLPA 11p15 assay. Following customisation—with the addition of five synthetic H19 DMR probes—the probe set is capable of detecting and distinguishing the full spectrum of epigenetic and copy number abnormalities at 11p15 known to cause overgrowth or growth retardation. The assay was validated with in a blinded analysis of a “test set” of 24 normal and 27 abnormal samples.
METHODS
DNA samples
Genomic lymphocyte DNA samples from 99 different randomly chosen British Caucasian blood donors were obtained from the European Collection of Cell Cultures (ECACC, Porton Down, UK). Genomic DNA from an individual with constitutional duplication of 11p15 and from a Wilms tumour harbouring a deletion of 11p15 were used as controls for copy number analyses. An additional 26 genomic DNA samples known to have 11p15 defects were analysed. These consisted of: one sample with a microdeletion affecting the H19 DMR, four samples with isolated hypermethylation at the H19 DMR, three with isolated loss of methylation at the H19 DMR, seven with isolated loss of methylation at KvDMR1, and 11 with paternal UPD 11p15. Sixteen were anonymised and provided by external laboratories and had been identified by Southern, CoBRA, microsatellite analysis or sequencing (table 2). Eleven were identified in our laboratory by microsatellite analysis or bisulfite Pyrosequencing. These samples were from patients recruited to the Childhood Overgrowth and Factors Associated with Childhood Tumours studies, which have been approved by the London Multicentre Research Ethics Committee (MREC01/2/44 and MREC05/02/17), and consent was obtained from all cases or their parents.
MS-MLPA probe set
The SALSA MLPA Kit ME030 lot 0207 (MRC Holland, Amsterdam, The Netherlands), was used for MS-MLPA analyses. The probe set contained target probes for 27 test sequences at 11p15 and 18 control probes for sequences on other chromosomes to produce fragments of unique size (supplementary table 1, fig 1). Thirteen of the test probes and three of the control probes contained an HhaI site, allowing assessment of the methylation status of the CpG dinucleotide at the restriction site. We designed a further five synthetic probes that targeted additional sequences in the H19 DMR (supplementary table 1, fig 1) avoiding SNPs held on publicly available databases, as previously described, to produce fragments of a unique size.16 17 Two of these probes contain an HhaI site. The additional probes were used in all MS-MLPA experiments.

MS-MLPA assay
MS-MLPA reactions using 100 ng DNA were performed as previously described,15 with the following modification: five pairs of additional synthetic probe oligonucleotides (1 fmol each, in a total volume of 0.055 μl Tris; Biomers.net GmbH, Ulm, Germany) were added to the SALSA MLPA buffer/MLPA probe mix. We included a known 11p15 duplication and/or deletion sample in all experiments. As in conventional MLPA analysis, MS-MLPA probes were hybridised to denatured genomic DNA. Each hybridised sample was then divided into two aliquots. One aliquot was ligated and its pair was ligated and digested with the methylation-sensitive restriction enzyme HhaI. Ligated probes were amplified by polymerase chain reaction (PCR) using fluorescently labelled primers producing a uniquely sized product. Following restriction digestion, probes targeting sequences containing unmethylated HhaI sites could not be amplified. PCR products were analysed on an ABI3130 automated sequencer (Applied Biosystems, Foster City, California, USA).
MS-MLPA data analysis
Copy number quantification was performed by comparison of quantified PCR products of test probes in each undigested sample with those in other samples. This was carried out using GeneMarker v1.51 software (SoftGenetics, State College, Pennsylvania, USA) according to the manufacturer’s instructions. Briefly, using the “population normalisation” mode, peak heights were normalised according to the median height of all (test and control) peaks of similar fragment size. The normalised peak heights were then compared with those of at least four normal samples. Default analysis parameters were used, identifying peak height ratios >1.3 as indicative of duplication and <0.75 of deletion. To ensure detection of copy number abnormalities affecting large numbers of test probes, analysis was repeated using normalisation according only to control peaks.
Methylation analysis was performed by comparison of the restriction digested aliquot with the paired undigested aliquot from each sample. Sample peak heights were exported from GeneMarker to Excel. Normalisation was performed by dividing the peak heights of each fragment by the sum of the peak heights of the control probes lacking an HhaI site in the same aliquot. The corrected peak height of each fragment in each digested aliquot was then divided by that of the corresponding fragment in the undigested aliquot from the same sample. For fragments containing an HhaI site, this figure is referred to as the “MS-MLPA methylation index”. Fragments with a value >1 were assigned a methylation index of 1. The mean methylation index of two target sites in the H19 DMR (probes 6266-L5772 and ICR1) and four target sites in KvDMR1 (probes 7171-L6780, 6276-L5782, 7172-L6781 and 7173-L6782) were calculated for each sample. These were referred to as the H19 DMR and KvDMR1 methylation indices, respectively. To provide a measure of data quality, the standard deviation of the values of digested divided by undigested corrected peak heights of all fragments without an HhaI site was calculated for each sample. Where this value was >0.19, samples were not analysed further. Finally, a visual check of trace and data quality was performed with GeneMarker.
Establishment of MS-MLPA assay
In order to determine the reliability and normal values for probes in the MS-MLPA assay, 75 normal control DNA samples, a sample with 11p15 duplication and a sample with 11p15 deletion were analysed using the method described. Samples with a methylation index greater than two standard deviations from the population mean at either the H19 DMR or KvDMR1 on initial analysis underwent repeat analysis. To determine further the reproducibility of the methylation indices, four samples were analysed in triplicate (in three separate experiments).
Blinded MS-MLPA analysis of test set
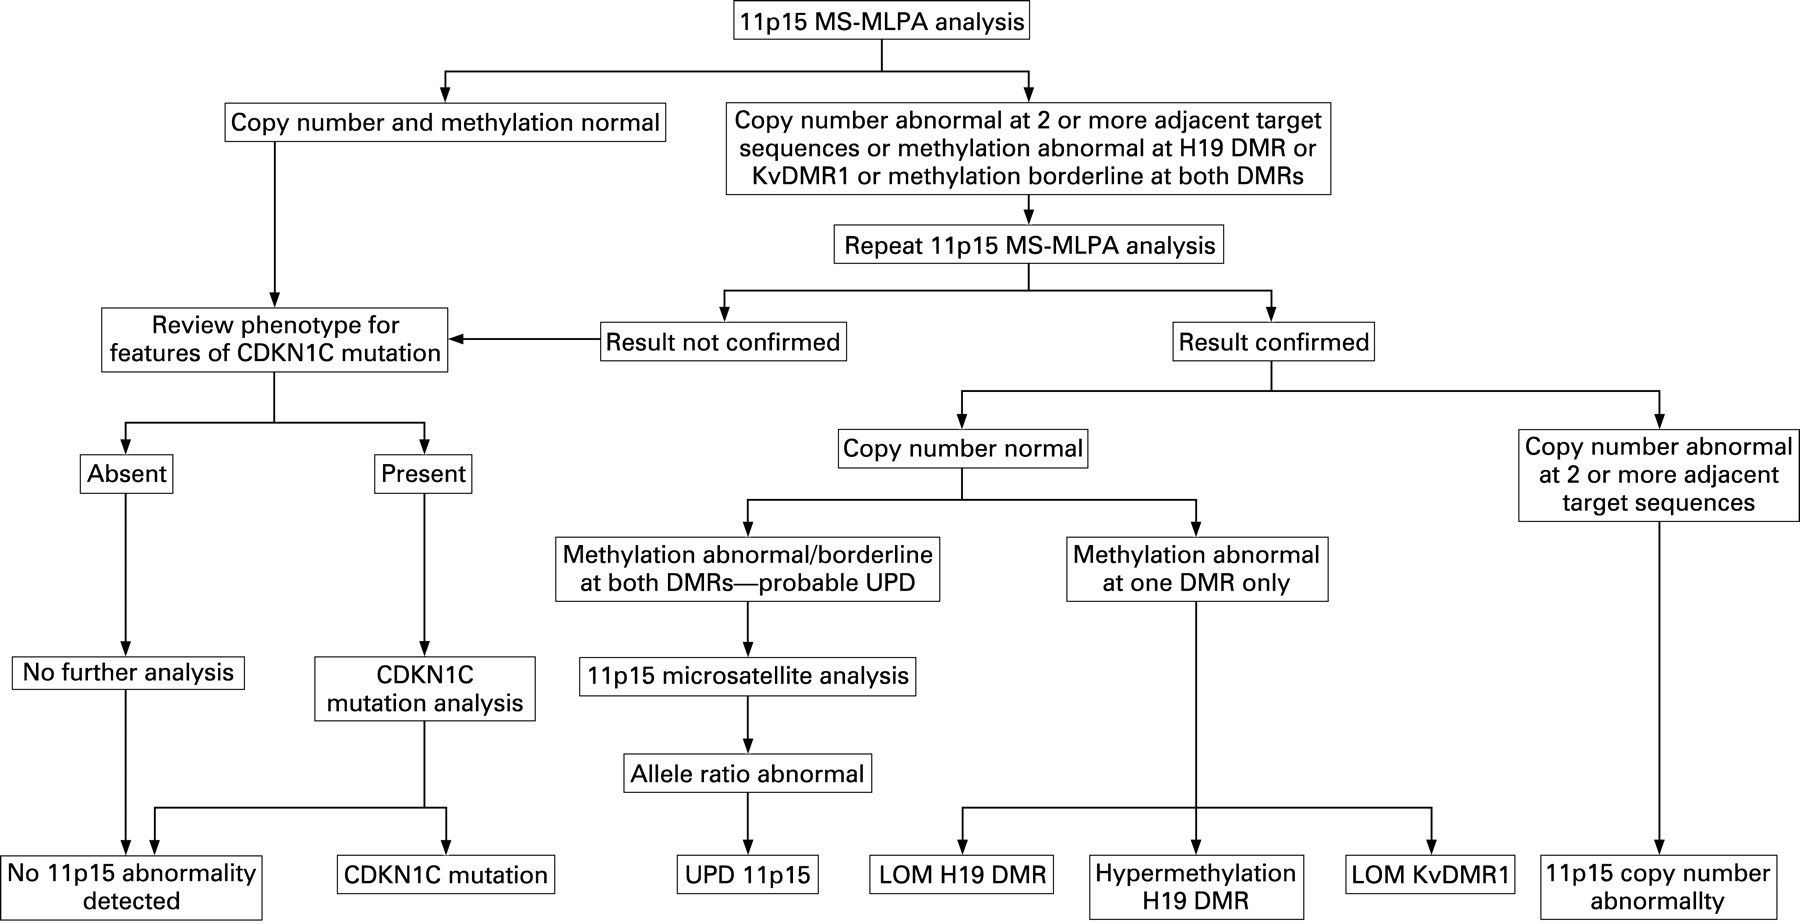
Using the methods described above, MS-MLPA analysis was performed on a test set of 51 samples, consisting of 24 normal and 27 abnormal samples (table 1). Samples with abnormal copy number results, abnormal methylation indices at either the H19 DMR or KvDMR1 or borderline methylation results at both DMRs underwent repeat analysis to confirm their status (fig 2). Data analysis was performed by two independent observers who were blinded to the status of samples and presented with the data in a random order. During analysis, samples were assigned different identifiers for each assay, further blinding the observers to the results of their own previous analyses on each sample.
Confirmatory analyses
The status of all abnormal samples was confirmed by analysis with a second, independent technique. Quantitative microsatellite analysis was used to confirm the presence of paternal UPD and bisulfite Pyrosequencing to confirm isolated methylation defects.
Microsatellite analysis
Quantitative PCR of four 11p15 microsatellite markers, D11S1984, TH01, D11S2362 and D11S1997, was performed using a fluorescently labelled forward primer (supplementary table 2) with the following reaction conditions and a total reaction volume of 25 μl: 50 ng genomic DNA, 1.4 μM forward and reverse primers (Invitrogen, Paisely, UK), 0.2 mM dNTPs, 1.5 mM MgCl2, 0.35 μl bovine serum albumin, 2 U Thermoprime Taq DNA polymerase and 2.5 μl Reaction Buffer IV (ABgene, Epsom, UK). The PCR protocol consisted of a denaturation step of 95°C for 5 min; 24 cycles at 94°C for 30 s, 57°C for 30 s, 72°C for 30 s; 72°C for 5 min; and 60°C for 20 min. We included a known UPD sample in all experiments and parental samples where available. PCR products were run on an ABI3130 automated sequencer (Applied Biosystems, Foster City, California, USA). Alleles were called and peak areas quantified using GeneMarker and exported to Excel. The ratio of paternally:maternally inherited allele peak areas at heterozygous markers was calculated. For non-informative markers or where no parental samples were available, the ratio was calculated as the ratio of greater:lesser peak areas. These values were referred to as the “allele ratio”. To determine the normal ranges of allele ratio values, analysis was performed on 10 control samples.
Bisulfite Pyrosequencing
Pyrosequencing primers complementary to bisulfite modified DNA and avoiding known SNPs were designed using PSQ Assay Design Software v1.0.6 (Pyrosequencing AB, Uppsala, Sweden) to target CpGs in the sixth CTCF binding site in the H19 DMR (five CpGs assayed) and KvDMR1 (six CpGs assayed; supplementary table 2). Primers and assayed CpGs did not overlap with the MS-MLPA target sequences.
Bisulfite modification of 500 ng DNA was performed using the EZ DNA modification kit (Zymo Research, Orange, California, USA) according to the manufacturer’s instructions and eluted in 10 μl buffer. PCR was performed for each target region with the following conditions and 25 μl total reaction volume: 1 μl modified DNA, 5 pmol forward and reverse primers (Biomers.net GmbH, Ulm, Germany), 0.2 mM dNTPs, 3 mM MgCl2, 0.5 U Thermo-Start Taq DNA polymerase (ABgene, Epsom, UK), 2.5 μl Thermo-Start PCR buffer. For the H19 DMR assay, 10 pmol (that is, an additional 5 pmol) of reverse PCR primer was used to ensure maximal incorporation of the (biotinylated) forward primer. The PCR protocol for the H19 DMR assay consisted of a denaturation/activation step at 95°C for 15 min; 50 cycles at 95°C for 30 s, 57°C for 30 s, 72°C for 30 s; and 72°C for 4 min. For the KvDMR1 assay, an extension time of 15 s per PCR cycle was used. Preparation of single-stranded DNA template and Pyrosequencing were performed according to the manufacturer’s instructions using streptavidin-coated Sepharose High Performance beads (Amersham Biosciences, Piscataway, New Jersey, USA), a PyroMark Vacuum Prep Workstation, PyroGold Reagents and a PSQHS96A system (Pyrosequencing AB, Uppsala, Sweden). Data were analysed using Pyro Q-CpG software v1.0.9 (Pyrosequencing AB, Uppsala, Sweden). The “Pyrosequencing methylation index” at each locus was calculated for each sample as the mean value of the fraction of methylated cytosines divided by the sum of unmethylated and methylated cytosines for all CpGs Pyrosequenced at that locus. The polymorphic C/TpG site (rs10732516) within the H19 DMR target sequence was excluded from these analyses.
Normal methylation index values for the two loci were established by analysis of 20 normal control samples. In subsequent experiments, to correct for small variations in methylation index between bisulfite modification batches, at least five normal control samples were modified with each set of test samples. The Pyrosequencing methylation index of unknown samples was then corrected by the difference of the mean methylation index of these control samples from the methylation index of the normal control samples when defining the reference range.
RESULTS
Optimisation and normal values of MS-MLPA assay
Analysis of 75 control samples revealed reproducible results from the probe set both for copy number and methylation, with the exception of four probes in the ME030 probe mix—H19 DMR probes 6265-L5771, 6264-L5770, N0213-L9402 and 7177-L6786 (supplementary table 1, fig 1). Probes 6265-L5771 and 6264-L5770 gave inconsistent results for copy number analysis and resultant skewing/unreliability of methylation indices. Probe N0213-L9402 contains a common SNP within the HhaI restriction site and gave inconsistent methylation indices. The fragment corresponding to probe 7177-L6786 amplified with greater efficiency in restriction digested samples, rendering its methylation index unreliable.
Given the variability at a number of H19 methylation probes, we designed a synthetic probe to target a further HhaI site in the H19 DMR (probe ICR1; supplementary table 1, fig 1). In order to extend the spectrum of identifiable copy number abnormalities, four additional synthetic probes were designed for target sequences in and centromeric to the minimal region of deletion in reported imprinting centre 1 microdeletion cases (probes ICR2-5; supplementary table 1, fig 1).18
After exclusion of data from the four probes noted above, and inclusion of the five synthetic probes, all probes consistently gave copy number peak height ratios >1.3 in the duplication sample and <0.75 in the deletion sample. None of the 75 control samples had ratios <0.75 or >1.3 at two or more adjacent probes. In subsequent analyses these cut-offs were used to indicate deletion (<0.75 at two or more adjacent probes) and duplication (>1.3 at two or more adjacent probes).
Methylation indices at both the H19 DMR and KvDMR1 were also consistent and reproducible (table 3). In the triplicate analysis experiment, mean per sample standard deviations of methylation indices were 0.03 and 0.02 for the H19 DMR and KvDMR1, respectively (ranges 0.02–0.05 and 0.01–0.03). Following a single analysis, 68 of the 75 control samples had a methylation index less than two standard deviations from the population mean at the H19 DMR or KvDMR1. A second MS-MLPA analysis was performed on the seven samples with a methylation index greater than two standard deviations from the mean at either DMR. In each of these samples, the second analysis produced a methylation index within two standard deviations of the population mean. In subsequent analyses, methylation indices repeatably greater than three standard deviations above the mean were considered indicative of hypermethylation and those greater than three standard deviations below the mean indicative of loss of methylation. Methylation indices between two and three standard deviations above or below the mean were considered borderline (table 3).
MS-MLPA analysis of test set
In the MS-MLPA analysis of the test set of 51 samples both blinded observers correctly identified and classified all of the 24 normal and 27 abnormal samples (table 2 and supplementary table 3).
All of the 24 normal samples were correctly identified after a single analysis. All of the 27 abnormal samples had abnormal MS-MLPA results on the first analysis. Repeat analysis was therefore performed. This confirmed the abnormal result in all cases. All of the 14 samples with isolated methylation defects had abnormal methylation indices at the relevant DMR. All of the 11 samples with UPD had abnormal methylation indices at the H19 DMR and 10 of 11 had abnormal methylation indices at KvDMR1. One sample with UPD (TEST51), with microsatellite allele ratios of ∼1.4, had a borderline methylation index at KvDMR1.
Copy number analysis identified MLPA peak height ratios >1.3 in all test probes in the two analyses of the sample with 11p15 duplication and <0.75 in the relevant test probes in the two analyses of the sample with a H19 DMR microdeletion. There was no evidence of copy number abnormality in other samples.
Confirmatory analyses
Microsatellite analysis
All of the 10 control samples analysed were heterozygous at two or more microsatellite markers. Individual markers gave allele ratios of 0.90 to 1.16, with standard deviations of 0.05 to 0.08 (supplementary table 4). In subsequent analyses, allele ratios >1.3 were considered abnormal and indicative of allelic imbalance.
Microsatellite analysis identified abnormal allele ratios at two or more markers in all of the samples with UPD and in the sample with 11p15 duplication (table 2, supplementary table 3). Four UPD samples had microsatellite allele ratios of 1.3–2.0, indicating that the abnormality was present at a relatively low level of mosaicism. The allele ratio was approximately two in the sample with duplication.
Bisulfite Pyrosequencing
Bisulfite Pyrosequencing of 20 control samples gave consistent methylation indices at the H19 DMR and KvDMR1 (supplementary table 5). No sample had a methylation index more than two standard deviations above the mean or three standard deviations below the mean at the H19 DMR. No sample had a methylation index more than two standard deviations above or below the mean at KvDMR1. In subsequent experiments, methylation indices outside these limits were considered abnormal (supplementary table 5).
All of the test set samples with isolated methylation defects had abnormal bisulfite Pyrosequencing methylation indices at the relevant DMR (table 2, supplementary table 3).
DISCUSSION
The identification and correct classification of 11p15 defects in individuals with overgrowth and growth retardation phenotypes is important clinically as it informs management and allows accurate estimation of recurrence and offspring risks.1–3 14 The customised MS-MLPA assay we describe is capable of identifying and distinguishing the spectrum of epigenetic and copy number abnormalities reported at 11p15 in association with these phenotypes (table 1) and is well suited to use as a first-line investigation of the region.
The large majority of identifiable 11p15 defects are associated with abnormal methylation at the H19 DMR and/or KvDMR1 (table 1). Identification of abnormal methylation is therefore central to analysis of the region. Our data demonstrate that the MS-MLPA assay we describe robustly detects normal and abnormal patterns of methylation at 11p15. Many abnormalities at 11p15 including UPD and isolated methylation defects occur in mosaic form, and their detection requires a high degree of sensitivity. Paternal uniparental disomy 11p15 results in hypermethylation at the H19 DMR and loss of methylation at KvDMR1. The data from samples with UPD—in which the microsatellite allele ratio provides a measure of the degree of mosaicism—indicate that the MS-MLPA assay has good sensitivity to abnormal methylation at each of the DMRs, even at relatively low levels of mosaicism (supplementary table 3). To date we have not seen false positive methylation results using the approach we describe (fig 2).
The use of multiple MS-MLPA probes to assess methylation provides highly reproducible methylation results. The ME030 probe set used includes four reliable methylation sensitive probes at KvDMR1, but only one targeting the H19 DMR. Inclusion in the customised assay of an additional methylation sensitive probe targeting the H19 DMR resulted in good reproducibility of the methylation index at this locus. Addition of further methylation sensitive probes at the H19 DMR in the ME030 probe mix may further improve performance of the assay.
A variety of copy number defects are recognised at 11p15 and account for an unknown proportion of familial and isolated occurrences of overgrowth and growth retardation. Analysis for these abnormalities is a necessary part of comprehensive testing of the region. MLPA is well validated and widely used in the identification of deletions and duplications and our data indicate that the MS-MLPA assay described is capable of identifying small genomic duplications and deletions at 11p15.19 We have not seen false positive results for deletions affecting two or more adjacent probes. The addition of four synthetic probes in and centromeric to the minimal region of deletion in reported IC1 microdeletion cases expands the spectrum of copy number abnormalities detectable with the assay to include all those previously reported at 11p15 in overgrowth and growth retardation (fig 1, table 1).
In the sample series we present, isolated methylation defects were confirmed first by repeat MS-MLPA analysis and then bisulfite Pyrosequencing. However, abnormal MS-MLPA methylation indices identified by duplicate analysis are highly specific, and laboratories may choose not to use a second technique to confirm isolated methylation defects as part of a routine 11p15 testing strategy (fig 2).
Copy number defects affecting two or more adjacent probes are reliably and specifically identified by MLPA and do not routinely require confirmation with a second technique. Polymorphisms within probe target sites can affect the performance of individual probes. Therefore, apparent copy number abnormalities affecting a single MLPA probe merit further evaluation.
Key points
A wide variety of constitutional epigenetic and copy number defects at 11p15 are associated with overgrowth and growth retardation phenotypes.
We describe the optimisation and use of a methylation-specific multiplex ligation-dependent probe amplification (MS-MLPA) assay that robustly detects and distinguishes these abnormalities.
MS-MLPA is an effective and simple first line investigation of 11p15 in individuals with overgrowth or growth retardation.
Microsatellite analysis in samples with methylation disturbance suggestive of UPD 11p15 confirms the underlying cause of the abnormality. It is likely that most laboratories would choose to confirm the presence of UPD in this way. In addition to testing of the proband, identification of UPD by microsatellite analysis is complicated by the need to analyse parental samples, which may be unavailable. The use of MS-MLPA as a first line investigation of 11p15 targets microsatellite analysis to those likely to harbour UPD, reducing the total number of analyses and the need for parental samples (fig 2).
CDKN1C mutations, other than whole gene deletions, are not detectable with the assay we describe. A strategy for comprehensive analysis of the region (fig 2) should therefore include CDKN1C mutation analysis in individuals with normal 11p15 MS-MLPA results and features suggestive of a mutation, such as overgrowth with an abdominal wall defect or a family history of Beckwith–Wiedemann syndrome.
A wide variety of approaches have previously been employed to identify abnormalities at 11p15 associated with overgrowth and growth retardation phenotypes.2 5 9 18 20 21 These often involve multiple analyses which are in some cases technically difficult, costly and/or require large quantities of input DNA. Analysis is rarely comprehensive, particularly in respect of copy number analysis, which is made difficult by the wide range of genomic sizes of known 11p15 copy number abnormalities and the variety of loci they affect. A number of techniques used to analyse methylation at 11p15 identify abnormal methylation in samples with copy number defects, but fail to distinguish them from those with isolated epigenetic abnormalities. This distinction is important because of the heritability of copy number defects.
MS-MLPA is simple to perform, relatively inexpensive and yields methylation and copy number data at multiple sequences from small quantities of input DNA. In addition, the assay can be performed in 96-well format, making it suitable for high throughput analysis and requires only equipment widely available in molecular genetics laboratories. A particular strength of MS-MLPA is its ability in a single experiment to identify and distinguish the range of epigenetic and copy number abnormalities reported at 11p15 in overgrowth and growth retardation phenotypes. These practical and clinical advantages make the assay well suited for use as a first line investigation of the region in laboratories irrespective of their prior expertise in methylation analysis.
Acknowledgments
We thank the patients and families involved in the research. We thank Sahar Mansour and Kathy Pritchard-Jones for providing samples. The research was carried out as part of the Childhood Overgrowth (COG) study and the Factors Associated with Childhood Tumours (FACT) study, which is a Children’s Cancer and Leukaemia Group study. These studies were approved by the London Multicentre Research Ethics Committee (MREC01/2/44 and MREC05/02/17).
REFERENCES
Supplementary materials
web only table 45/2/106
Files in this Data Supplement:
Footnotes
Additional data are published online only at http://jmg.bmj.com/content/vol45/issue2
Funding: This work was supported by the Institute of Cancer Research (UK). RHS is supported by a grant which forms part of the Michael and Betty Kadoorie Cancer Genetics Research Programme.
Competing interests: None.