


Abstract
Expression quantitative trait locus (eQTL) analysis, which links variations in gene expression to genotypes, is essential to understanding gene regulation and to interpreting disease-associated loci. Currently identified eQTLs are mainly in samples of blood and other normal tissues. However, no database comprehensively provides eQTLs in large number of cancer samples. Using the genotype and expression data of 9196 tumor samples in 33 cancer types from The Cancer Genome Atlas (TCGA), we identified 5 606 570 eQTL-gene pairs in the cis-eQTL analysis and 231 210 eQTL-gene pairs in the trans-eQTL analysis. We further performed survival analysis and identified 22 212 eQTLs associated with patient overall survival. Furthermore, we linked the eQTLs to genome-wide association studies (GWAS) data and identified 337 131 eQTLs that overlap with existing GWAS loci. We developed PancanQTL, a user-friendly database (http://bioinfo.life.hust.edu.cn/PancanQTL/), to store cis-eQTLs, trans-eQTLs, survival-associated eQTLs and GWAS-related eQTLs to enable searching, browsing and downloading. PancanQTL could help the research community understand the effects of inherited variants in tumorigenesis and development.
INTRODUCTION
Single nucleotide polymorphisms (SNPs), the most common type of human genetic variation, play important roles in human complex traits and diseases (1–3). Genome-wide association studies (GWAS) identified more than 10 000 SNPs associated with susceptibility of human traits or diseases (4,5). Most GWAS-detected risk SNPs are located in the genome's non-coding regions (6), indicating that these SNPs mainly exert their functional roles via regulating gene expression. Therefore, understanding SNP regulation of gene expression is essential for interpreting disease related SNPs.
Expression quantitative trait locus (eQTL) analysis, which links variations in gene expression to genotypes, has been demonstrated as a powerful approach to understanding the effects and molecular mechanism of functional SNPs (7–10). Previous studies identified eQTLs mainly from lymphoblastoid cell lines and normal human tissues (9,11–13). For example, the Genotype-Tissue Expression (GTEx) consortium identified eQTLs from 7051 tissue samples of 44 tissues from 449 donors (13). Due to the significance of eQTLs, several databases have been developed to collect eQTLs, including the GTEx Portal (13), ExSNP (14), seeQTL (15) and SCAN (16). However, no database comprehensively provides eQTLs in large number of cancer samples. The majority of eQTLs identified from cancer samples are cancer-specific through a comparison between tumor and normal samples (17). Therefore, it is necessary to analyze eQTLs from large-scale cancer samples to further understand the functional effects of eQTLs in cancer. Furthermore, the majority of studies and databases neglected trans-eQTLs, which are highlighted with significant functions in recent studies (7,18). Collectively, systematic and large-scale investigations of both cis- and trans-eQTLs in multiple cancer types would provide the research community with a further understanding of inherited variant effects in tumorigenesis and development.
The Cancer Genome Atlas (TCGA) generated a large amount of omics data, including RNA sequencing, genotype data and clinical survival information from more than 10 000 cancer samples. These data provide a valuable source for eQTL analysis and further integrative analysis across different cancer types.
DATA COLLECTION AND PROCESSING
Genotype data collection, imputation and processing
To comprehensively identify eQTLs across different cancer types, we obtained genotype data from the TCGA data portal (https://tcga-data.nci.nih.gov/tcga/), which detected the genotypes using Affymetrix SNP 6.0 array containing 898 620 SNPs. To increase the power for eQTL discovery, we imputed autosomal variants for all samples in each cancer type using IMPUTE2 (19), with 1000 Genomes Phase 3 (20) as the reference panel. To improve computation efficiency, we used the two-step procedure of IMPUTE2, which includes pre-phasing, and the imputation of the phased data. After imputation, we used the following criteria to select SNPs (13): (i) imputation confidence score, INFO ≥ 0.4, (ii) minor allele frequency (MAF) ≥ 5%, (iii) SNP missing rate <5% for best-guessed genotypes at posterior probability ≥0.9 and (iv) Hardy–Weinberg Equilibrium P-value > 1 × 10⁻⁶ estimated by Hardy–Weinberg R package (21) (Figure 1A).
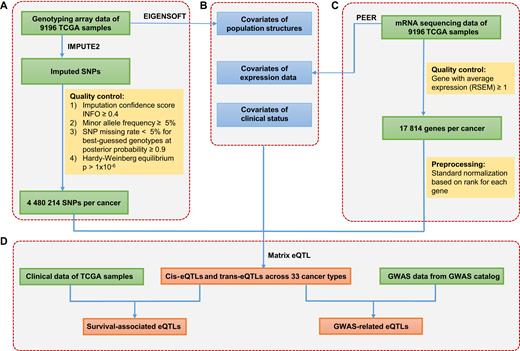
Identification of eQTLs in PancanQTL database. (A) Genotyping data collection and processing. (B) Covariates analyzed in eQTL mapping. (C) Gene expression data collection and processing. (D) eQTL analyses of cis-eQTLs, trans-eQTLs, survival-associated eQTLs and GWAS-related eQTLs.
Gene expression data collection and processing
The gene expression profiles were obtained from the TCGA data portal (https://gdc-portal.nci.nih.gov/), which contains 20 531 genes for each sample. In each cancer type, genes with average expression (RSEM calculated by Expectation-Maximization (22)) of ≥1 were retained. To minimize the effects of outliers on the regression scores, the expression values for each gene across all samples were transformed into a standard normal based on rank (13) (Figure 1C).
Covariates
Previous studies showed that factors affecting global gene expression may reduce the eQTL-identifying power (23,24). To remove the global effects on gene expression, covariates are usually included in eQTL analyses (9,13). To remove the effect of population structure on gene expression, we used smartpca in the EIGENSOFT program (25) to perform principal component (PC) analyses for each cancer type, and selected the top five PCs in genotype data as covariates. To remove the hidden batch effects and other confounders in the expression data, we used PEER software (26) to select the first 15 PEER factors from expression data as covariates. To remove the potential effects of clinical status on gene expression, age (9), gender (13) and tumor stage (17) were included as additional covariates (Figure 1B).
Identification of eQTLs
For each cancer type, the genotype data, expression data and covariates were processed to three N (genotype, expression or covariates) × S (samples) matrix files with matched sample order. The gene location (hg19) was downloaded from Genomic Data Commons (https://gdc.cancer.gov/). The SNP location (hg19) was downloaded from dbSNP (https://www.ncbi.nlm.nih.gov/projects/SNP/) (v137). eQTL analysis was performed by Matrix eQTL (27) in linear regression model. SNPs with false discovery rates (FDR) < 0.05 were defined as eQTLs. Cis-eQTLs were defined if the SNP was within 1 Mb from the gene transcriptional start site (TSS) (13), and trans-eQTLs were defined if the SNP was beyond that point (Figure 1D).
Survival-associated eQTLs
Many genes are associated with cancer prognoses (28), and eQTLs may influence the prognosis by altering gene expression. To identify survival-associated eQTLs, we examined the associations between eQTLs and patient overall survival. For each eQTL, samples were classified into three groups: homozygous genotype AA, heterozygous genotype Aa and homozygous genotype aa (A and a represent two alleles of one SNP). The log-rank test was used to examine the differences in survival time, and Kaplan–Meier (KM) curves were plotted to represent the survival time for each group. eQTLs with FDR < 0.05 were defined as survival-associated eQTLs (Figure 1D).
GWAS-related eQTLs
Risk SNPs identified in GWAS studies were downloaded from the GWAS catalog (http://www.ebi.ac.uk/gwas/) (5). GWAS linkage disequilibrium (LD) regions were extracted from SNAP (https://personal.broadinstitute.org/plin/snap/ldsearch.php) (29) with parameters (SNP dataset: 1000 Genomes; r2 (the square of the Pearson correlation coefficient of linkage disequilibrium) threshold: 0.5; population panel: CEU (Utah Residents with Northern and Western European Ancestry); Distance limit: 500 kb). eQTLs that overlap with GWAS tagSNPs and LD SNPs (r2 ≥ 0.5) were identified as GWAS-related eQTLs.
DATABASE CONTENT AND USAGE
Samples in PancanQTL
PancanQTL included 9196 tumor samples from 33 cancer types. The sample size of each cancer type ranged from 36 in cholangiocarcinoma (CHOL) to 1092 in breast invasive carcinoma (BRCA) (Table 1). For the genotype data, we obtained on average 4 480 214 SNPs for each cancer type after imputation and quality control, ranging from 2 765 921 for BRCA to 5 245 402 for acute myeloid leukemia (LAML). After removing lowly expressed genes (RSEM < 1), there were on average 17 814 genes for each cancer type, ranging from 16 758 for uveal melanoma (UVM) to 18 790 for testicular germ cell tumors (TGCT).
Summary of eQTLs for each cancer type in PancanQTL
| Cis | Trans | ||||||||
|---|---|---|---|---|---|---|---|---|---|
| Cancer typea | No. of samples | No. of genes | No. of genotypes | Pairs | egenes | eQTLs | Pairs | egenes | eQTLs |
| ACC | 77 | 17, 562 | 3 678 145 | 4610 | 222 | 4558 | 984 | 60 | 957 |
| BLCA | 408 | 18 171 | 4 242 910 | 142 562 | 5573 | 120 374 | 9199 | 1575 | 3114 |
| BRCA | 1092 | 17 991 | 2 765 921 | 438 476 | 11 859 | 317 935 | 73 124 | 6013 | 20 466 |
| CESC | 300 | 17 975 | 4 367 017 | 95 702 | 4165 | 84 484 | 2209 | 674 | 971 |
| CHOL | 36 | 17 767 | 4 106 282 | 11 | 2 | 11 | 5011 | 127 | 4436 |
| COAD | 286 | 17 500 | 4 576 984 | 164 356 | 5048 | 145 461 | 3085 | 373 | 2359 |
| DLBC | 48 | 17 245 | 4 945 365 | 391 | 15 | 391 | 5 | 3 | 5 |
| ESCA | 184 | 18 372 | 4 563 674 | 39 358 | 1603 | 36 589 | 425 | 56 | 410 |
| GBM | 150 | 17 650 | 4 660 522 | 59 788 | 1901 | 55 855 | 481 | 55 | 465 |
| HNSC | 518 | 17 985 | 4 302 347 | 267 797 | 6502 | 228 069 | 9285 | 1064 | 7389 |
| KICH | 66 | 17 212 | 3 902 792 | 7264 | 320 | 7038 | 5826 | 157 | 4669 |
| KIRC | 527 | 17 812 | 4 632 879 | 521 072 | 8739 | 410 720 | 13 978 | 943 | 12 200 |
| KIRP | 290 | 17 715 | 4 981 141 | 186 310 | 4920 | 164 159 | 2712 | 302 | 2516 |
| LAML | 123 | 17 099 | 5 245 402 | 70 375 | 1758 | 64 696 | 580 | 38 | 397 |
| LGG | 515 | 17 563 | 4 688 205 | 578 617 | 9177 | 437 580 | 21 236 | 1804 | 13 084 |
| LIHC | 369 | 17 816 | 4 218 042 | 151 613 | 5723 | 128 956 | 16 675 | 2230 | 3963 |
| LUAD | 514 | 18 190 | 4 435 432 | 259 475 | 6834 | 220 709 | 6157 | 745 | 4513 |
| LUSC | 500 | 18 277 | 3 787 605 | 204 145 | 6367 | 173 856 | 11 934 | 1050 | 10 487 |
| MESO | 87 | 17 742 | 4 904 165 | 16 527 | 475 | 16 140 | 474 | 43 | 471 |
| OV | 301 | 18 137 | 3 018 011 | 92 743 | 7100 | 74 419 | 6196 | 2028 | 2245 |
| PAAD | 178 | 18 021 | 5 099 858 | 113 810 | 2468 | 104 058 | 1221 | 110 | 978 |
| PCPG | 178 | 17 552 | 4 836 419 | 93 679 | 3203 | 83 517 | 1146 | 241 | 985 |
| PRAD | 494 | 17 646 | 4 887 130 | 691 299 | 10 152 | 514 457 | 15 730 | 1105 | 11 589 |
| READ | 94 | 17 427 | 4 653 098 | 22 788 | 781 | 22 114 | 72 | 14 | 72 |
| SARC | 258 | 18 183 | 4 156 361 | 70 201 | 4194 | 61 193 | 5704 | 1055 | 4115 |
| SKCM | 103 | 17 645 | 4 968 336 | 15 046 | 720 | 14 487 | 348 | 45 | 299 |
| STAD | 415 | 18 478 | 4 362 659 | 161 271 | 4913 | 142 709 | 2470 | 391 | 1994 |
| TGCT | 150 | 18 790 | 4 927 197 | 71 832 | 1959 | 67 882 | 653 | 39 | 599 |
| THCA | 503 | 17 277 | 4 936 390 | 927 678 | 10 766 | 659 323 | 13 592 | 745 | 8908 |
| THYM | 120 | 17 785 | 5 036 992 | 85 627 | 2090 | 78 507 | 436 | 43 | 379 |
| UCEC | 176 | 18 195 | 5 111 002 | 25 426 | 1188 | 24 721 | 251 | 35 | 248 |
| UCS | 56 | 18 314 | 4 036 518 | 488 | 25 | 488 | 6 | 2 | 6 |
| UVM | 80 | 16 758 | 4 812 283 | 26 233 | 890 | 25 260 | 5 | 4 | 5 |
aThe full names of cancer types are shown in Supplementary Table S1.
| Cis | Trans | ||||||||
|---|---|---|---|---|---|---|---|---|---|
| Cancer typea | No. of samples | No. of genes | No. of genotypes | Pairs | egenes | eQTLs | Pairs | egenes | eQTLs |
| ACC | 77 | 17, 562 | 3 678 145 | 4610 | 222 | 4558 | 984 | 60 | 957 |
| BLCA | 408 | 18 171 | 4 242 910 | 142 562 | 5573 | 120 374 | 9199 | 1575 | 3114 |
| BRCA | 1092 | 17 991 | 2 765 921 | 438 476 | 11 859 | 317 935 | 73 124 | 6013 | 20 466 |
| CESC | 300 | 17 975 | 4 367 017 | 95 702 | 4165 | 84 484 | 2209 | 674 | 971 |
| CHOL | 36 | 17 767 | 4 106 282 | 11 | 2 | 11 | 5011 | 127 | 4436 |
| COAD | 286 | 17 500 | 4 576 984 | 164 356 | 5048 | 145 461 | 3085 | 373 | 2359 |
| DLBC | 48 | 17 245 | 4 945 365 | 391 | 15 | 391 | 5 | 3 | 5 |
| ESCA | 184 | 18 372 | 4 563 674 | 39 358 | 1603 | 36 589 | 425 | 56 | 410 |
| GBM | 150 | 17 650 | 4 660 522 | 59 788 | 1901 | 55 855 | 481 | 55 | 465 |
| HNSC | 518 | 17 985 | 4 302 347 | 267 797 | 6502 | 228 069 | 9285 | 1064 | 7389 |
| KICH | 66 | 17 212 | 3 902 792 | 7264 | 320 | 7038 | 5826 | 157 | 4669 |
| KIRC | 527 | 17 812 | 4 632 879 | 521 072 | 8739 | 410 720 | 13 978 | 943 | 12 200 |
| KIRP | 290 | 17 715 | 4 981 141 | 186 310 | 4920 | 164 159 | 2712 | 302 | 2516 |
| LAML | 123 | 17 099 | 5 245 402 | 70 375 | 1758 | 64 696 | 580 | 38 | 397 |
| LGG | 515 | 17 563 | 4 688 205 | 578 617 | 9177 | 437 580 | 21 236 | 1804 | 13 084 |
| LIHC | 369 | 17 816 | 4 218 042 | 151 613 | 5723 | 128 956 | 16 675 | 2230 | 3963 |
| LUAD | 514 | 18 190 | 4 435 432 | 259 475 | 6834 | 220 709 | 6157 | 745 | 4513 |
| LUSC | 500 | 18 277 | 3 787 605 | 204 145 | 6367 | 173 856 | 11 934 | 1050 | 10 487 |
| MESO | 87 | 17 742 | 4 904 165 | 16 527 | 475 | 16 140 | 474 | 43 | 471 |
| OV | 301 | 18 137 | 3 018 011 | 92 743 | 7100 | 74 419 | 6196 | 2028 | 2245 |
| PAAD | 178 | 18 021 | 5 099 858 | 113 810 | 2468 | 104 058 | 1221 | 110 | 978 |
| PCPG | 178 | 17 552 | 4 836 419 | 93 679 | 3203 | 83 517 | 1146 | 241 | 985 |
| PRAD | 494 | 17 646 | 4 887 130 | 691 299 | 10 152 | 514 457 | 15 730 | 1105 | 11 589 |
| READ | 94 | 17 427 | 4 653 098 | 22 788 | 781 | 22 114 | 72 | 14 | 72 |
| SARC | 258 | 18 183 | 4 156 361 | 70 201 | 4194 | 61 193 | 5704 | 1055 | 4115 |
| SKCM | 103 | 17 645 | 4 968 336 | 15 046 | 720 | 14 487 | 348 | 45 | 299 |
| STAD | 415 | 18 478 | 4 362 659 | 161 271 | 4913 | 142 709 | 2470 | 391 | 1994 |
| TGCT | 150 | 18 790 | 4 927 197 | 71 832 | 1959 | 67 882 | 653 | 39 | 599 |
| THCA | 503 | 17 277 | 4 936 390 | 927 678 | 10 766 | 659 323 | 13 592 | 745 | 8908 |
| THYM | 120 | 17 785 | 5 036 992 | 85 627 | 2090 | 78 507 | 436 | 43 | 379 |
| UCEC | 176 | 18 195 | 5 111 002 | 25 426 | 1188 | 24 721 | 251 | 35 | 248 |
| UCS | 56 | 18 314 | 4 036 518 | 488 | 25 | 488 | 6 | 2 | 6 |
| UVM | 80 | 16 758 | 4 812 283 | 26 233 | 890 | 25 260 | 5 | 4 | 5 |
aThe full names of cancer types are shown in Supplementary Table S1.
eQTLs in PancanQTL
For each cancer type, the average associations of ∼81 billion SNP-gene pairs were tested for cis- and trans-eQTL mapping. In cis-eQTL analysis, we identified 5 606 570 eQTL-gene pairs in 33 cancer types at a per-tissue FDR < 0.05, which corresponded to a median P-value < 9.22 × 10⁻⁵ (Supplementary Table S1). There were 11 cis-eQTLs identified in CHOL, while 659 323 cis-eQTLs were identified in thyroid carcinoma (THCA). The number of cis-eQTLs was significantly correlated with the number of samples (Spearman correlation Rs = 0.93, P-value = 2.97 × 10⁻¹⁵). The number of cis-eQTL regulated genes (egenes) ranged from two in CHOL to 11 859 in BRCA (Table 1). For trans-eQTL analysis, we identified 231 210 eQTL-gene pairs in 33 cancer types at a per-tissue FDR < 0.05, which corresponded to a median P-value < 1.54 × 10⁻⁹ (Supplementary Table S1). The number of trans-eQTLs ranged from five in lymphoid neoplasm diffuse large B-cell lymphoma (DLBC) and uterine carcinosarcoma (UCS) to 20 466 in BRCA, while the number of egenes ranged from two in UCS to 6013 in BRCA (Table 1). The number of trans-QTLs is also significantly correlated with the number of samples (Rs = 0.74, P-value = 6.84 × 10⁻⁷).
Among the cis- and trans-eQTLs, we identified 22 212 eQTLs associated with patient overall survival in the different cancer types at FDR < 0.05. The number of survival-associated eQTLs ranged from one in UCS to 4330 in THCA. To identify GWAS-related eQTLs, we extracted 28 345 trait/disease-related SNPs from the GWAS catalog and obtained 1 167 961 SNPs located in GWAS LD regions. Among these, 337 131 SNPs are eQTLs in at least one cancer type.
Web design and interface
Results were organized into a set of relational MySQL tables (30), with the website constructed using HTML and PHP. We designed four modules to display cis-eQTLs, trans-eQTLs, survival-associated eQTLs and GWAS-related eQTLs (Figure 2A). Users could browse each eQTL module simply by clicking the corresponding module. On the home page, we designed an advanced search box for a comprehensive query across four modules (Figure 2B). For example, the user can select a cancer type (e.g. STAD) and input an SNP ID (e.g. rs2351010), gene symbol (e.g. ERAP2) or genomic region (e.g. chr1:1–1000000) to search eQTLs in four modules. A quick search option is available on each page (top right) to search by SNP ID, gene symbol or genomic region. Users can download cis-eQTLs and trans-eQTLs for each cancer type from the ‘Download’ page. The ‘Help’ page provides information for data collection and processing. PancanQTL welcomes any feedback by email on the ‘Contact’ page.
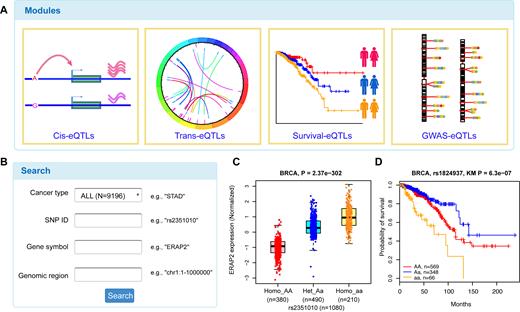
Overview of PancanQTL database. (A) Four modules in PancanQTL, including cis-eQTLs, trans-eQTLs, survival-associated eQTLs and GWAS-related eQTLs. (B) Advanced search box in PancanQTL. (C) Example of an eQTL boxplot in cis-eQTL page. (D) Example of a KM plot in survival-eQTL page.
Data browsing and querying of four modules
Using the homepage browser bar or clicking directly on the ‘cis/trans-eQTLs’ module, users can enter cis/trans-eQTLs page. A table with SNP ID, SNP genomic position, SNP alleles, gene symbol, gene position, beta value (effect size of SNP on gene expression) and eQTL P-value are displayed on the cis/trans-eQTLs page. When the user selects a specific cancer type or enters a gene or SNP ID, the table will be rebuilt to display the query results. For each record of SNP-gene pairs, a vector diagram of boxplot is provided to display the association between SNP genotypes and gene expression. For example, our analysis showed that ERAP2 expression in individuals carrying the homozygote rs2351010 aa is significantly higher than that in individuals carrying the homozygote rs2351010 AA and heterozygous rs2351010 Aa (P-value = 2.37 × 10−302) (Figure 2C).
On the survival-eQTLs page, the SNP information and median overall survival time of each genotype are provided. Search boxes are designed for retrieving specific cancer types and SNPs. For each SNP, a vector diagram of KM plot is provided to display the association between SNP genotypes and overall survival. For example, our analysis showed that patients with the rs1824937 aa genotype have worse prognoses than other breast cancer patients (P-value = 6.3 × 10⁻⁷) (Figure 2D).
On the GWAS-eQTLs page, the SNP information, regulated gene information and related GWAS traits are displayed. Search boxes are designed for retrieving specific cancer types and SNPs. In addition, users can select a different LD threshold from the dropdown box to prioritize SNPs.
SUMMARY AND FUTURE DIRECTIONS
We systematically identified cis-eQTLs, trans-eQTLs, survival-associated eQTLs and GWAS-related eQTLs in 33 cancer types. We constructed a user-friendly database, PancanQTL, for users to query, browse and download eQTLs. Millions of vector diagrams of eQTL box plots and KM plots are provided. PancanQTL could serve as an important resource for human cancer genetics and provide opportunities to bridge the knowledge gap from variants in sequence to phenotypes. PancanQTL could also contribute to understanding the effects of inherited variants in tumorigenesis and development. Cancer genomics is a rapidly developing field (31), and we expect that the number of cancer samples with genotype and gene expression profiles will increase dramatically. We will update PancanQTL to include more cancer samples and will maintain it as a useful resource for the research community. Previous studies demonstrated the complicated mechanisms for regulating gene expression by eQTLs, including altering RNA sequence, RNA structure, transcription factor binding, miRNA binding, methylation and histone modification (32,33). It will be very interesting to further investigate the regulating mechanisms of eQTLs through integrative analysis if multi-dimensional data are available.
SUPPLEMENTARY DATA
Supplementary Data are available at NAR Online.
ACKNOWLEDGEMENTS
The authors gratefully acknowledge Xianchun Tu for helping design and debug the website, and Carol K. Kohn for proofreading of the manuscript. We thank the support from the Cancer Prevention & Research Institute of Texas (CPRIT RR150085).
FUNDING
National Natural Science Foundation of China [81402744 to J.G.]; Cancer Prevention & Research Institute of Texas [RR150085 to L.H.]; UTHealth Innovation for Cancer Prevention Research Training Program Post-doctoral Fellowship (Cancer Prevention and Research Institute of Texas) [RP160015]; China Scholarship Council [201606160058 to C.L., 201606275095 to J. F.]. Funding for open access charge: National Natural Science Foundation of China [81402744].
Conflict of interest statement. None declared.

Comments