Article Text

Abstract
Single-cell sequencing is a powerful approach that can detect genetic alterations and their phenotypic consequences in the context of human development, with cellular resolution. Humans start out as single-cell zygotes and undergo fission and differentiation to develop into multicellular organisms. Before fertilisation and during development, the cellular genome acquires hundreds of mutations that propagate down the cell lineage. Whether germline or somatic in nature, some of these mutations may have significant genotypic impact and lead to diseased cellular phenotypes, either systemically or confined to a tissue. Single-cell sequencing enables the detection and monitoring of the genotype and the consequent molecular phenotypes at a cellular resolution. It offers powerful tools to compare the cellular lineage between ‘normal’ and ‘diseased’ conditions and to establish genotype-phenotype relationships. By preserving cellular heterogeneity, single-cell sequencing, unlike bulk-sequencing, allows the detection of even small, diseased subpopulations of cells within an otherwise normal tissue. Indeed, the characterisation of biopsies with cellular resolution can provide a mechanistic view of the disease. While single-cell approaches are currently used mainly in basic research, it can be expected that applications of these technologies in the clinic may aid the detection, diagnosis and eventually the treatment of rare genetic diseases as well as cancer. This review article provides an overview of the single-cell sequencing technologies in the context of human genetics, with an aim to empower clinicians to understand and interpret the single-cell sequencing data and analyses. We discuss the state-of-the-art experimental and analytical workflows and highlight current challenges/limitations. Notably, we focus on two prospective applications of the technology in human genetics, namely the annotation of the non-coding genome using single-cell functional genomics and the use of single-cell sequencing data for in silico variant prioritisation.
- genetic variation
- single cell
- sequencing
- variant annotation
- variant prioritization
- functional genomics
This is an open access article distributed in accordance with the Creative Commons Attribution Non Commercial (CC BY-NC 4.0) license, which permits others to distribute, remix, adapt, build upon this work non-commercially, and license their derivative works on different terms, provided the original work is properly cited, appropriate credit is given, any changes made indicated, and the use is non-commercial. See: http://creativecommons.org/licenses/by-nc/4.0/.
Statistics from Altmetric.com
Introduction
Cells are unique—differing from one another in terms of their copy numbers, transcriptional landscape, physiological functions and spatiotemporal locations.1 The recent advances of single-cell sequencing (sc-seq) technologies have revolutionised how we profile genetic, epigenetic, transcriptional or proteomic variations in individual cells. Named ‘Method of Year’ by Nature Methods in 2013 and ‘Breakthrough of the Year’ by Science in 2018,2 sc-seq approaches have so far enabled the identification of new cell types, building of cellular atlases of human, mouse, zebrafish and frog embryos (https://www.humancellatlas.org/),3–11 identification of disease mechanisms,12 detection and tracing of cancer progression and therapy13 as well as the screening of genomic regions at scale.14 15 Organismal-level atlases provide insights into the development, the cell type constitution of mature organs and the spatial context of every cell. They provide a framework to readily investigate developmental disorders as well as pleiotropism arising from ubiquitous cell types present across multiple organs. Merged atlases combining mouse and human data also provide a bridge to link human diseases to mouse models.3 By mapping the entire human body in adults and in embryonic stages as part of the Human Cell Atlas initiative, sc-seq technologies can also help decipher the cellular-level changes that occur during a specific disease and monitor subsequent anomalies in cellular differentiation.3
Of primary importance to human geneticists is the identification of genes, pathways or mechanisms that give rise to disease phenotypes, as well as the detection, monitoring and prediction of disease, its progression or the response to an intervention, which may be confined to a subpopulation of cells within a tissue or an organ. This necessitates characterisation of biopsies and understanding of mechanisms at a cellular resolution. Unlike bulk-sequencing (bulk-seq), which only informs on the tissue averages, sc-seq enables identification and quantification of cellular heterogeneities, such as in the case of neurological diseases16 or cardiac failure.17 Moreover, the introduction of high-throughput sequencing approaches in the clinic has led to a massive growth in the number of variants of uncertain significance, new candidate genes and new phenotypes.18 Screening of unannotated genomic regions and resulting phenotypes using traditional low throughput methods is unfeasible. Sc-seq approaches, in combination with gene-editing technologies, make it now possible to screen thousands of genomic regions in a single experiment 19 and to identify phenotypes, previously overlooked by other technologies.20 For these reasons, sc-seq is finding increasing interest in human genetics research.
In this review article, we provide an overview of the current sc-seq technologies with an emphasis on the methods relevant to human genetics. To define the scope, we consider sc-seq as a congregation of methods that enables the profiling of individual cells by applying sequencing technologies. In this overarching definition, we include the profiling of the cellular genome, epigenome, transcriptome and proteome. But we exclude technologies that use immunofluorescence, in situ hybridisation, mass-spectroscopy or other readout schemes, such as MERFISH (multiplexed error-robust fluorescence in situ hybridization), or CyTOF (cytometry by time of flight), which are reviewed elsewhere.21 22 We mainly focus our discussions on well-established methods, but have strived to point out promising recent developments in the field. At first, we discuss the progress made in the experimental workflow and then describe how diverse computational methods help to extract relevant information and construct models. In the latter half, we focus on two prospective applications, chosen for their immediate relevance to human genetics. These include the experimental screening of genomic regions and the prioritisation of variants using computational approaches.
The aim of this review article is (i) to provide a comprehensive overview to a human geneticist entering the field, (ii) to generalise and simplify concepts, where possible, so as to help understand and interpret the literature, (iii) to provide an overview of the current use case scenarios of sc-seq in human genetics basic research and (iv) to forecast on prospective applications of the technology in the human genetics clinic. For focused information beyond the scope of this comprehensive review, we recommend several review articles that discuss the current trends on various topics in detail, including the different sequencing modalities, such as genome,23–26 epigenome,27–29 transcriptome,30–34 multiome35–37 as well as their applications in cancer,38 cardiovascular diseases39 and neurological diseases.40
How does single-cell sequencing work?
The workflow of single-cell sequencing
Contemporary sc-seq, be it genome, transcriptome or another modality, entails dissociating tissue into cells, capturing and tagging the molecules within each cell with a unique nucleotide sequence (cellular barcode), creating a sequencing library and sequencing. Ground-breaking innovations have been made in all these aspects of the workflow over the last decade (figure 1). As a result, improvements have occurred in the cellular throughput, the diversity of sequence-able molecular species (modalities) as well as many other characteristics (eg, sensitivity, quality, depth and cost) (online supplemental figure 1).41 In this section, we provide a brief overview of the workflow and summarise the current capabilities and any associated limitations. An exhaustive list of sc-seq techniques and analysis workflow is accessible in several recent reviews.26 30–32 35 42
Supplemental material
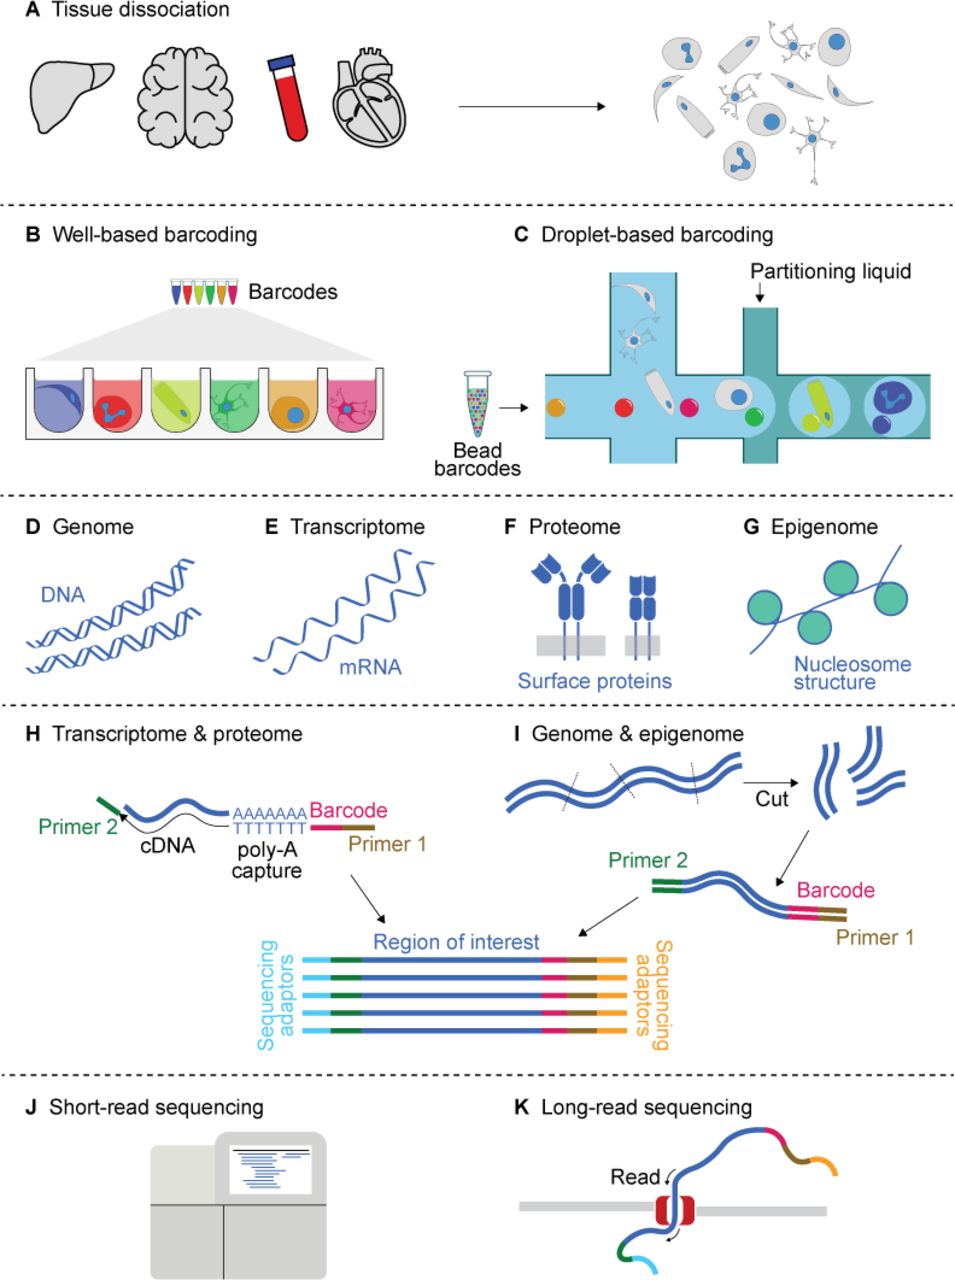
Five stages of single-cell sequencing (sc-seq) experimental workflow. (A) Dissociation of the desired tissue into a cellular suspension is the first step in the sc-seq experimental workflow. (B–C) Cellular barcoding of all required molecules within a cell is realised by segregating individual cells in (B) wells or (C) droplets. Barcodes (demarcated by various colours) are introduced in a solution form or as beads, depending on the technology used. (D–G) The sc-seq allows interrogation of the cellular genome, transcriptome, proteome as well as the epigenome—referred to as sequencing modalities. (H, I) Construction of a sequencing library from the barcoded molecules. (H) The transcriptome and proteome are generally captured by taking advantage of poly-A sequences. This is either the 3’ poly-A tail in the case of mRNA or is part of oligonucleotide sequences conjugated to the antibodies used to recognise the proteins of interest. (I) Genome and epigenome sequencing requires DNA fragmentation, amplification and additional steps depending on the feature of interest. (J, K) Short-read sequencing offers high-accuracy and speed, but is limited to <200 bp read lengths, whereas long-read sequencing generally offers sequence lengths reaching tens of kilo bases.
From complex tissues to single cells
The first step in all sc-seq approaches is the dissociation of the tissue into single cells (figure 1A). It is normally achieved by mechanical (eg, cutting, crushing, mincing) and/or enzymatic (eg, trypsin) means, unless a more straightforward cellular separation is possible, like in the case of blood.16 43–45 This key step influences the outcome of all downstream results, because tissues respond differently to the processing, due to the differences in the cellular composition and the extracellular matrix. This is especially the case in complex tissues (eg, brain), where such biases may give rise to skewed representation of cell types in the final data. For example, cryopreservation has been shown to result in the selective loss of epithelial cells.46 Enzymatic methods can also affect the omics-profile of the cell by inducing stress responses.46 FACS sorting may often be required to enrich specific cell types as well as to reduce debris.16 Due to the difficulty of obtaining intact cells from certain tissues (eg, mature brain, frozen tissue), single-nuclei sequencing (for simplicity collectively denoted hereafter as sc-seq) has been gaining popularity, because intact nuclei are more easily suspended and barcoded than cells.46–49 For this reason, many large-scale consortia, such as the Human Cell Atlas,3 50 mainly use single-nuclei sequencing for unbiased sampling.
Labelling the content of each cell by cellular barcoding
Barcoding the molecular contents of each cell allows tracing every sequencing-read back to its cell-of-origin. This is achieved by segregating the dissociated cells or nuclei into small ‘reaction microchambers’ represented either by microwells (figure 1B) or microdroplets within a microfluidic system (figure 1C).51 Each reaction chamber contains a reagent cocktail, including enzymes, antibodies and/or primers, in order to permeabilise the cell/nuclear membrane, capture the molecules of interest and to impart a cellular barcode to every captured molecule within the reaction microchamber. The cellular barcodes are 6–20 base nucleotide sequences in length and unique to each microchamber. In many of the high-throughput well or droplet technologies, the reagents for molecular capture and barcoding are either anchored to the bottom of the wells, added to the individual wells or encapsulated in microbeads. Cells are placed into such microchambers at random by means of microfluidics or pipetting. By minimising cases in which more than one cell ends up in a single microchamber (usually below 10%), all of the molecules within each cell, in most cases, receive a unique barcode. This allows in silico allocation of every sequencing-read back to its cell-of-origin.
Among the numerous advances over the years, the cellular throughput—the number of cells that can be barcoded at once—has seen a remarkable increase from a few cells since the initial demonstration52 to many thousands of cells using well-based and droplet-based techniques.53–57 Cellular throughput in the order of millions of cells, for example, to sequence organs or even entire embryos, is possible with ‘combinatorial indexing’ or ‘split-pool’ barcoding.7 58–60 The cellular throughput is only one of the many differences between these cellular barcoding approaches. Other differences include the levels of automation and convenience, cost, cellular capture efficiency, molecular capture efficiency, doublet-rate, remote-processing (eg, compatibility with formaldehyde-fixed tissue) and customisation options.33 61 While generally low in throughput, well-based or plate-based methods allow cellular visualisation by microscopy and are more amenable to customisation.56 In contrast, droplet-based methods offer higher cellular throughput with automation, where the cell/nuclear lysis, molecular capture and barcoding occur ‘on-the-flow’.
Modalities of sc-seq
While the vast majority of sc-seq experiments assay the transcriptome of each cell (figure 1E),52 62 63 the technology has now been expanded to other omics-modalities, including the genome, epigenome and proteome (figure 1D, F and G). These modalities provide information at the different levels of the central dogma: sc-genome-seq helps identify somatic mutations and mosaicism; sc-epigenome-seq measures features such as chromatin accessibility, histone modifications, DNA methylation profile, three-dimensional (3D) genome architecture, etc, which regulate transcription, cellular differentiation and disease progression; sc-transcriptome-sq quantifies the gene-expression, which often is used as a proxy for cell state or type and the sc-proteome-seq provides information about translated products, usually cell-surface proteins.
The innovation in single-cell proteome and epigenome sequencing lies in library preparation, where information of interest (eg, the presence of a protein or the chromatin architecture) is converted to a sequence-able DNA library with cellular barcoding. Stoeckius et al,64 Shahi et al65 and Peterson et al66 demonstrated sc-proteome-seq by using oligonucleotide-conjugated antibodies targeted against various proteins of interest. These oligonucleotides contained adaptor sequences required for library preparation as well as molecular barcodes unique to the antibodies to enable in silico proteome re-construction. sc-proteome-seq offers unmatched scalability (at least theoretically) when compared with other methods with inherent limitations on the bandwidth (eg, microscopy, flow cytometry or mass cytometry): a 10-base oligonucleotide generates sufficient unique molecular barcodes that exceed the number of known human-proteins.64 In practice, however, the number of detectable proteins is limited by antibodies available. For epigenome sequencing, Cusanovich et al58 and Buenrostro et al67 developed sc-ATAC-seq (assay for transposase-accessible chromatin) to elucidate the mechanisms that give rise to intercellular heterogeneity, despite harbouring the same genetic code. Other epigenomic modalities, such as DNA methylation, 3D genome architecture and histone marks, have also been demonstrated,68–73 which are discussed in recent reviews.27 Recent advances have been focused on the combined sequencing of multiple modalities,36 74 such as co-assays to simultaneously profile chromatin accessibility and gene expression.60 75 76 Such methods allow linking regulatory elements to gene-expression patterns within the same cell and help delineate gene regulatory networks, and are becoming increasingly popular techniques for basic research in genetics.
Library preparation and sequencing technologies
The conversion of the molecules of interest within each cell into a barcoded, sequence-able DNA library is at the crux of sc-seq (figure 1H,I). Transcriptome and proteome sequencing usually take advantage of poly-A terminations of transcripts or oligonucleotide-tags on the antibodies to capture the fragments, after which RT and PCR amplifications are performed to generate a sequencing library (figure 1H). To account for bias induced by exponential PCR amplification, certain protocols tag every captured molecule with a unique molecular identifier (UMI—a short random nucleotide sequence) prior to PCR. All sequencing reads from a cell (ie, cellular barcode) associated with a single UMI are pooled.
In general, for genomic and epigenomic sc-seq modalities, including whole genome sequencing, chromatin accessibility, methylation and other epigenetic information, the DNA is segmented, barcoded and amplified (figure 1I). Except for the additional cellular barcoding steps, these procedures are similar and often adapted from developments in bulk-seq. Specifically, several methods have been developed for single-cell whole genome amplification, such as random/degenerate oligonucleotide primed PCR, multiple displacement amplification, multiple annealing and looping-based amplification cycles, linear amplification via transposon insertion, which all result in sequencing libraries with lengths in the range of several hundred bases.26 A recent development has also demonstrated sc-genome-seq with high-fidelity reads reaching kilobase lengths with the use of a transposase to fragment the DNA.77 The library preparation varies across the different sc-epigenome-seq techniques,27 28 depending on the feature of interest. In the case of chromatin accessibility, enzymes such as DNase,78 Tn5 transposase58 67 are used to fragment the genome at open chromatin regions, followed by barcoding and adaptor ligation. In the case of profiling histone-marks, earlier methods used free enzymes, such as MNase,73 to non-specifically fragment the DNA, followed by barcoding and pooled immunoprecipitation. More recent approaches to profile histone-marks without the additional step of immunoprecipitation use antibody-directed cleavage/tagmentation, such as in single-cell CUT&TAG79 or CoBATCH.71
The sc-seq libraries thus generated are sequenced by short-read sequencing technologies (figure 1J) or less often by long-read sequencing methods (figure 1K) for read lengths of tens of kilo bases to up to a few million bases, at the expense sequencing accuracy, duration or cost.77 80 81 One of the primary challenges in sc-seq library preparation is the imperfect molecular capture efficiency, whereby only a subset of molecules in each cell is represented in the sequencing library. Referred to as ‘dropout’ events, this can result in bias, misclassification of cell types or batch effects. Further advances in library preparation as well as data analysis strategies are to be expected in the near future, resolving most of these limitations.
Recording additional cellular metadata
In addition to the profiling of the four omics modalities, recent advances also allow the recording of other cellular metadata. Technologies, such as sci-space,6 transcriptome in vivo analysis82 and in situ sequencing,83 84 enable recording of spatial location of each cell, which is lost in the cell suspension-based library preparation described above. Preserving the spatial context can help in understanding intercellular communication and its alteration in disease contexts by simultaneously describing the cellular subtypes and their physical proximities.6 Despite limitations in single-cell resolution, techniques such as slide-(RNA-)seq,85 slide-DNA-seq86 and spatial-ATAC-seq87 demonstrate the value of capturing spatial information in characterising diseases. For example, slide-DNA-seq of a cancer model revealed that clonal populations are confined to distinct spatial regions—a discovery not possible with mainstream bulk-seq or sc-seq. Indeed, a recent publication reported on the development of Stereo-seq, which uses a DNA nanoball technology to sequence the sc-transcriptome with submicrometre spatial resolution and map the mouse embryo development to generate a Mouse Organogenesis Spatiotemporal Transcriptomic Atlas.11 Developmental cell lineage information can be computationally extracted from the omics-profiles in developmentally heterogeneous cellular populations8 88–92 or it may be measured in individual cells by longitudinally ‘recording the cell states’.93 Niche techniques such as Patch-seq enable associating a neuron’s electrophysiological profile with its expression profile. Thus, it is currently possible to profile single cells at many omics-modalities, in parallel and in association with cellular meta-features. Commercial offerings of such multi-omics sc-seq kits are also beginning to appear (Mission Bio and 10x Genomics), foreshadowing the possibility of being able to mix-and-match the modalities and cellular meta-features of interest at ease in the near future.
Considerations when performing sc-seq experiments
The goals of a particular project/experiment, the nature of the sample to be studied, budget, available expertise both in the laboratory and in analysis, available infrastructure, samples variability can all dictate the numerous choices that need to be made in the above described steps of the sc-seq workflow. Here, we summarise a few key considerations that can provide preliminary guidance to a reader planning an sc-seq experiment.
The choice of the sequencing modality is dictated by the goal of the study. However, given the abundance of methods (including commercial kits) and analysis pipelines that enable multimodal sc-seq experiment and analysis, studies may often benefit from the combined data (eg, epigenome, transcriptome and proteome), which has facilitated more accurate cell type annotation and establishing regulatory networks.94 However, the trade off often includes increased costs and reduced data quality compared with single modality sc-seq. The sample, whether fresh, frozen or fixed, imposes further constraints on the choice of methodology. For example, tissue dissociation into single cells (as opposed to nuclei) is often only possible from fresh tissues. Moreover, the use of fixed cells/nuclei for sc-transcriptome-seq is only possible with a subset of technologies and may require further optimisation.95 96 The choice of sequencing cells or nuclei can in turn impact downstream analyses, such as RNA velocity, which draws inferences from the difference between spliced and unspliced transcriptome.97 In terms of time, cost and expertise required to establish and perform the assays, comercial end-to-end solutions often perform better than non-commercial solutions. Another crucial trade off, particularly in sc-transcriptome-seq, is between the number of cells sequenced versus the number of genes detected per cell (online supplemental figure 1). Many well-based methods are aimed at deeper sequencing of a smaller number of cells and combinatorial indexing-based methods fall on the other end of the spectrum, capable of sequencing millions of cells, although at a lower number of transcripts detected per cell. In this regard, the droplet based barcoding methods offer middle ground. Online supplemental figure 1 also provides an overview of the cost of preparing the sequencing libraries per cell, where non-commercial methods often have the edge. However, when the additional sequencing costs are considered, commercial kits may be on par with the non end-to-end solutions.
Analysis and visualisation
The sc-seq produces large volumes of data (20–120 GB per sample),98 which necessitates sophisticated computational and statistical techniques for analysis. After sample collection, processing and sequencing as described in the previous section (figure 2A), the sequenced reads are first demultiplexed using the cellular barcodes, tracing each read back to the cell-of-origin, thus effectively creating an omics-profile for each cell. The demultiplexed reads are aligned to the reference genome (sc-genome-seq, sc-epigenome-seq, sc-transcriptome-seq) or feature tag (sc-proteome-seq) and quantified. This is organised into a matrix in which each row contains the feature information and each column the cellular identity, forming the feature-barcode matrix. Due to biological variations, diverse microenvironments and the statistical nature of and inherent biases in the sc-seq experimental workflow (eg, PCR), no two cells, even of the same cell type, will have identical omics-profiles. Normalisation of the feature-barcode matrix makes the data comparable between cells by accounting for the variations, such as the sequencing depth, (PCR) amplification bias, the number of molecules identified and dropout events. At this stage, the feature-barcode matrix is ready for biological variance interpretation. Various computational tools are available for the analysis workflow.99–104

Workflow of single-cell sequencing (sc-seq) data analysis and visualisation. (A) The cell or nuclei suspension from a tissue biopsy is subjected to sc-seq of the desired modality(-ies). After data quality control, (B) cells are clustered and visualised in a map (eg, Uniform Manifold Approximation and Projection), where each cell is represented by a dot and coloured by its cluster identity. The coordinates of the map are arbitrary and represent non-linear reductions of the omics-features. Each cluster may be further subclustered. Cell type or state of each cluster or subcluster is identified by differential features analysis, that is, features which differentiates it from the others. (C) The differential features can be visualised using dot plots, where the size and opacity of the dots scale with the percentage of cells and the quantity at which a feature is present in a cluster. (D) Pseudotime-trajectories enable the visualisation of biological processes, including differentiation or disease development. Early identification of disease-forming, ectopic trajectories (eg, lymphoma, black) is one of the promises of the sc-seq technology. (A–D) Synthesised data, purely for illustrative purposes. (D) Represents a hypothetical scenario adapted from Rajewsky et al.111
Clustering
Clustering refers to the grouping of cells with similar features, for example, accessible chromatin and methylation profiles in the case of epigenome sequencing, mutational landscape in the case of genome sequencing or expression profile in transcriptome or proteome sequencing (figure 2B). For clustering, the features (often several thousands) are condensed, using methods like principal component analysis (PCA), which reduce the data-dimensionality.105 These condensed data are then clustered using methods like k-means, network clustering, which are adopted and implemented in the single-cell analysis workflows. The clustering results are commonly visualised in a further dimensionality reduced fashion, where the principal features (PCA components) are condensed into two or three dimensions, using methods—Uniform Manifold Approximation and Projection (McInnes,106 Uniform Manifold Approximation and Projection for Dimension Reduction, 2018, http://arxiv.org/abs/1802.03426, accessed 5 July 2021) or t-distributed stochastic neighbour embedding107. Both these methods result in scatter plots, where each dot represents a cell and the cells in a cluster are characterised with a similar cellular profile. The visualisation methods are rapidly evolving and there is still ambiguity about how to infer the underlying biology from the high dimensional data.108 Annotation of the cell type corresponding to each cluster is then carried out by identifying cluster-specific features (or differential features) that distinguish it from the other clusters.
Differential features
Differential feature analysis helps in identifying the source of variability between clusters as well as across samples. Within a sample, the differential feature analysis is typically used to identify cell types, states or clones based on the cluster-specific features. This is either performed manually based on the literature on the identified cluster-specific features (eg, differential features or gene enrichment analysis) or using automated methods based on correlation-based, probabilistic or supervised machine learning models, as reviewed elsewhere.109 Whereas across samples, it is used to compare the differences between, for example, the control and a diseased tissue, in order to establish genotype-phenotype relationships as discussed below. Thus, sc-seq is able to capture differences stratified into cell types, unlike bulk-seq where the differences are averaged over all cells and often miss smaller changes between cells. There are multiple methods and algorithms available for the differential feature analysis—the choice of the right method will reduce the false discovery rates.110 Dot plots, heatmap and violin plots are the widely used visualisation methods to portray the differences in features like methylation status, mutational landscape, gene and protein expression between the cell types and also across samples. Figure 2C shows a dot plot, where the hypothetical subclusters of haematopoietic cells are compared to identify features that differentiate lymphoma cells from normal cells.
Trajectory analysis
The omics-profiles of cells even within a cluster (cell type) exhibit diversity, although at a finer level than between clusters. While experimental artefacts may account for some of this, it also contains biologically relevant information, such as their differentiation state, cell cycle state and somatic evolution. Trajectory analysis is an approach to organise cells within a cluster based on their progress along an expected/apparent biological process. The analysis assumes that certain features in these cells vary continuously along a gradient with the progression of biological processes. Therefore, these gradients are represented as branches, showing the minute differences in the state of the cells. Insightful information can often be gained from trajectory analyses and the so-called pseudotime plots, which assign a timestamp to each cell based on its progression along the feature gradient103 (figure 2D). In the case of genomic data, such an analysis can help trace the accumulation of somatic mutations within a cell type (eg, cancer) to study clonal evolution. Figure 2D shows the hypothetical organisation of cells from stem cells to mature haematopoietic cell types. Also depicted is a diseased lymphoma trajectory that deviates from normal lymphoid cells. Research initiatives, such as LifeTime, expect that such trajectory analyses can help in early disease detection by monitoring trajectories that deviate from a reference trajectory.111 Another analysis that extracts temporal information from the static sc-transcriptome-seq data is RNA velocity. It captures the transcriptional dynamics in the cells, for example, a cell differentiating from a progenitor state to a mature state. It infers each cell’s future state by comparing the proportion of unspliced versus spliced transcripts of every gene within a cell.112
What can we do with sc-seq technologies in human genetics?
Current implementations of sc-seq in human genetics basic research
Human genetics is in part the identification of the causative reasons behind a diseased state. Before sc-seq, bulk-seq was often used for the molecular phenotyping of genetic disease by comparing the average omics-profiles of the diseased and the control samples. While this approach has been successful in some cases, the resolution of bulk-seq is too low to detect changes in cellular heterogeneity during development. With the advent of sc-seq, such investigations are being performed at a much higher resolution to understand the cellular-level changes pertaining to diseases. sc-genome-seq has been applied in studying genetic mosaicism,26 aneuploidy113 and clonal evolution.114 As an example, sc-genome-seq in patients with acute myeloid leukaemia helped to detect significantly more mutations and also mutations exclusive to clones compared with the bulk-genome-seq, because of its sensitivity to filter at a subpopulation level.114 Sc-epigenome-seq and sc-transcriptome-seq have been demonstrated to track regulatory and transcriptional cellular heterogeneity, respectively, in patients and control profiles in various diseases,16 115–121 and therapy strategies,122 123 which would have been missed with bulk-seq. Sc-ATAC-seq of mitochondrial DNA revealed the kinetics in the levels of heteroplasmy in mitochondrial disorders across cell types, which were difficult to interpret from bulk-seq data.124 Singh et al125 combined short-read sequencing with targeted long-read sequencing of T cell receptor and B cell receptor at single-cell level. Towards this aim, the cDNA library was split before the usual fragmentation step required for short-read sequencing to allow parallel short-read and long-read sequencing on the same sample. This enabled them to characterise the isoforms due to alternative gene splicing. Various modalities and approaches of sc-seq discussed earlier can help uncover the complexity of diseases as well as monitor therapeutic effects (figure 3). The multiplexing of different sc-seq modalities lends itself for more specific questions to be addressed.95 126 127 For example, linking gene regulators with the gene regulation is facilitated by combining sc-epigenome-seq with sc-transcriptome-seq.95 128–131 This can enhance the interpretation of the regulatory pathways involved in development and maturation of cells in a disease perspective. Overall, sc-seq has established itself in human genetics as a tool to characterise diseases, where cellular heterogeneity (at any level of the central dogma) plays a role, as well as to disseminate regulatory mechanisms by taking advantage of the rich data. However, the application of the technology remains confined to exploratory research settings and yet to make its way into routine clinical use.

Current use cases of single-cell sequencing (sc-seq) in the field of human genetics. Sc-seq enables unbiased molecular phenotyping of diseases. (A) The mutational landscape leading to clonal evolution can be studied using sc-genome-seq. It provides insight into somatic mutations such as CNVs and single nucleotide variants (SNVs), particularly in cancer. (B) The activities of cis-regulatory elements and transcription factors related to disease progression can be explored using sc-epigenome-seq. (C) The cellular composition of a diseased tissue can be uncovered using sc-transcriptome-seq and sc-proteome-seq (not shown). They allow quantification of differential expression at both transcript and protein levels. (A–C) Synthesised data based on Smajić et al, Morita et al and Corces et al.16 114 115
Prospective applications in human genetics
Here, we describe two prospective applications in human genetics, which take advantage of the latest developments and promises of sc-seq to address current challenges in human genetics. The first relates to our quest to understand the non-coding genome. Specifically, the functional annotation of cis-regulatory elements. Here, sc-seq in combination with functional genomics allows thousands of functional experiments to be performed in a single, multiplexed assay (prospective application 1). The second addresses the challenges spawned by next-generation sequencing (NGS), namely the thousands of rare variants in each genome, and the vast majority of them being located in the >98% of the human genome that is non-coding.132 Here, the richness of the sc-seq data combined with machine learning models help prioritise variants based on biological characteristics, such as gene expression and chromatin accessibility (prospective application 2).
Prospective application 1: single-cell functional genomics—annotating the non-coding genome
Delineating the function of the 98% of the genome that is non-coding and deciphering the pathogenicity of the variants identified in these non-coding regions is the central challenge of human genetics in the next decade. However, we are far from this goal, because: first, the ‘regulatory code’ of the non-coding sequence is still unknown; second, an important aspect of physiological gene regulation by cis-regulatory elements and enhancers lies in the 3D architecture of the genome and lastly, the number of non-coding variants per generation is so high that traditional functional tests have reached their limit. This underscores the urgent need for high-throughput functional screening technologies to study the endogenous functions of the non-coding genome. Until recently, annotating a non-coding region in a native context (cf. their identification in plasmids, eg, STARR-seq133) faced trade-offs between the number of regions simultaneously screened versus the complexity of phenotypes assayed.134 On the one hand, pooled genetic screens, for example, with CRIPSR/Cas9, have mostly been associated with hypothesis-driven assays of simple phenotypes (eg, proliferation/survival screens, reporter expression).135–138 This precludes the systematic investigation of the enhancer-driven phenotypes. On the other hand, the unbiased phenotype screening offered by sc-seq has been mostly applied to investigate a handful of mutations or diseases, but often in a non-multiplexed fashion.139 Here, the effect of one or a few genomic perturbation(s) is assayed separately or at best in an arrayed format, which requires a separate experiment per enhancer and severely restricts scalability.
The integration of sc-seq with CRISPR/Cas9 has resulted in a new set of technologies that eliminate this trade-off, enabling the screening of non-coding (as well as coding) regions and their phenotypic consequences in a multiplexed fashion, at an unprecedented scale. Gasperini et al used this approach to functionally characterise ~6000 human candidate enhancers.19 They used a pool of CRISPR/Cas9-based genetic perturbations to inactivate these candidate enhancers (CRISPRi) in a collection of ~250 000 cells, followed by sc-seq to measure the functional consequence in terms of expression >10 560 genes. In total, they could interrogate ~80 000 potential cis-regulatory relationships in a single experiment. The innovation of the technology is in the ability to identify the perturbation(s) present (ie, the enhancer targeted) in each cell from the sc-seq data, such that the effect of the perturbations on the omics-profile could be quantified. This is achieved by including a transcribable barcode (guide barcode, unique guide index or the gRNA sequence itself) along with every CRISPR guide RNA (gRNA), which gets integrated into the genome (figure 4A,B). Thus, the read-out of the guide barcode along with the rest of the cell’s sequencing library by sc-seq, made it possible to associate the omics-profile of every cell to the perturbation present in that cell (figure 4C). In effect, the technology enabled the transformation of each perturbed cell into a patient harbouring (non-)coding variant(s), from an expression quantitative trait loci (eQTL) perspective.

Single-cell sequencing (sc-seq) CRISPR screening of cis-regulatory elements. (A) To perturb the various (non-coding) genomic regions of interest, a CRISPR library is created by inserting guide RNAs (gRNAs) targeting these regions, along with barcodes unique to each gRNA, a fluorescence protein (eg, GFP - green fluorescent protein), and necessary promoters into a (lentiviral) vector. Perturbing non-coding regions, such as enhancers, followed by sc-transcriptome-seq can help establish enhancer-gene relationships. The method can also be used to reveal the functions of unannotated regions (not shown), which can help prioritise variants in that region. (B) Transfection/Transduction is followed by the integration of the gRNA library (and the CRISPR/Cas9 machinery; not shown) into the genome of the cells. Depending on the multiplicity of infection (MOI), the number of gRNAs (therefore, perturbations) per cell can be tuned. For simplicity, the figure depicts a maximum of one gRNA per cell. Multiple perturbations within a cell can be used to assess functional cooperativity between regulatory elements (eg, enhancer compensation) or to reduce the number of cells. FACS-sorting or selection for antibiotic resistance enables filtering out cells without any perturbation. (C) The identity and the number of gRNA barcodes per cell detected is identified from the sc-seq data. Cells (columns) can be ordered based on the perturbations they harbour for downstream analysis purposes. Note: each row would have traditionally been a separate experiment and each column would have been a sample or an experimental repeat, which can now be pooled into a single experiment. (D) Enhancer screening—the cis-regulatory functions of non-coding loci on the expression profiles of genes of interest can be investigated using sc-transcriptome-seq. Here, perturbation of the enhancer 2, results in the downregulation of gene 1. (E) The entire transcriptome can be assessed for changes in expression on individual (or cooperative) perturbations to establish enhancer-gene relationships. (A–E) Synthesised data based on Gasperini et al and Xie et al.19 150
The initial demonstrations of the technology (called Perturb-seq,15 140 CRISP-seq14 and CROP-seq141) were focused on elucidating gene functions (as opposed to non-coding regions). They perturbed the genes in a loss-of-function manner by implementing CRISPR/Cas9 in a knockout fashion (CRISPRko) and measured their trans-effects on the entire transcriptome. Dixit et al knocked out 24 transcription factors in bone marrow-derived dendritic cells and investigated the effect of these perturbations in the single-cell transcriptome. These initial studies screened tens of genes and assessed their trans-effect on the transcriptome of thousands of cells in a single experiment. Since these pioneering demonstrations, the technology has been optimised and adapted, for example, to improve the efficiency,142 to study the effect of upregulation using CRISPR-activation,143 to read out the effect of perturbations on the epigenome 144 or proteome145 to dissect the function of protein domains (sc-Tiling),146 as well as to elucidate gene functions147 and gene regulatory networks related to development, diseases148 or DNA-chromatin structure.149
Xie et al demonstrated that this approach can be used to measure the function of enhancers (figure 4D,E).150 They used the CRISPR/dCas9-KRAB system and sgRNAs to epigenetically suppress the activity of 15 super-enhancers (containing a total of 71 constituent enhancers) in topologically associated domains containing highly expressed genes and quantified their function. They dissected the contribution of the individual constituent enhancers within these super-enhancers and concluded that often only a few constituent enhancers contribute to the regulation of target-gene expression. Moreover, by targeting multiple enhancers per cell (3.2 sgRNAs per cell on average), they could evaluate combinatorial enhancer activity and observed evidence of enhancer compensation. However, the design of this pioneering study was limited to quantifying the function of enhancers with known gene associations. Gasperini et al extended the approach with a goal to functionally characterise ~5779 candidate enhancers, where each perturbation was found in a median of 900 cells and each cell contained on average 28 gRNAs. They used an eQTL-inspired analysis framework to establish ~600 new enhancer-gene pairs. A similar use of the dCas9-KRAB system was recently demonstrated by Lopes et al151 to evaluate the ~15 000 putative regulatory elements engaged by oestrogen receptors in the context of breast cancer. By combining the sc-seq data, HiC maps and functional assays (cell proliferation), they could map the oestrogen receptor-driven oncogenic programme and decipher the role of the respective non-coding regions.
In the above-mentioned studies, the perturbations were introduced in a particular cell type followed by omics-profiling at a particular time-point or, at best, within a time-window. This could, however, lead to missing enhancer functions, because of their time-dependent and cell type-dependent activity. That is, the perturbation of an enhancer active during the development of a specific cell type would go unnoticed if it is perturbed in an unrelated cell type. To overcome this challenge, Jin et al applied the Perturb-Seq technology in utero, in the developing brain at E12.5, to study the function of a panel of 35 neurodevelopmental delay-related genes.12 As a result, a wide variety of cell types, including neurons, microglia and oligodendrocytes, were targeted and the effect of the perturbations on the expression of 14 gene modules could be assessed. Another advantage of this approach was the feasibility to query the effect of the otherwise lethal genetic perturbations, since only 0.1% of the cells were perturbed at a time. Application of this approach to screen the function of non-coding regions relevant to development or in an in vivo context is, however, yet to be demonstrated.
Taken together, it is currently possible to screen the effects of perturbing multiple coding or non-coding genomic regions on the transcriptome, epigenome or the proteome, with single-cell resolution in a single experiment. While most studies have used this multiplexed screening technology to evaluate the functions of genes, a handful of studies have already applied it to establish regulatory relationships. The technology can be performed in cultured cells or within a developing organism. Commercial kits are readily available from vendors such as 10x Genomics for similar experiments. In human genetics, the functional characterisation of unannotated genomic regions will assist in interpreting variants in these regions. Global efforts to annotate molecular and cellular phenotypes, such as the MorPhiC programme (National Institutes of Health, funding RFA-HG-21-029), would also benefit from the evolution of such technologies.
The next logical advance is the direct experimental screening of the variants, but this is just out of reach of the gene-editing technology, due to limited efficiency and accuracy. However, early demonstrations to profile single nucleotide variants do look promising.152 Transduction-based overexpression instead of gene-editing has also been used as a method to overcome the limitations for functional annotation of variants.147 As the gene-editing technologies improve in efficiency, resolution, accuracy and specificity,153 154 it is increasingly likely that such technologies currently restricted to research will find direct applications in Personal Genomics for high-throughput experimental screening of variants identified in an individual. In the meanwhile, computational approaches combined with sc-seq data can be used to prioritise (if not annotate) variants, as is discussed next.
Prospective application 2: in silico variant prioritisation using sc-seq data
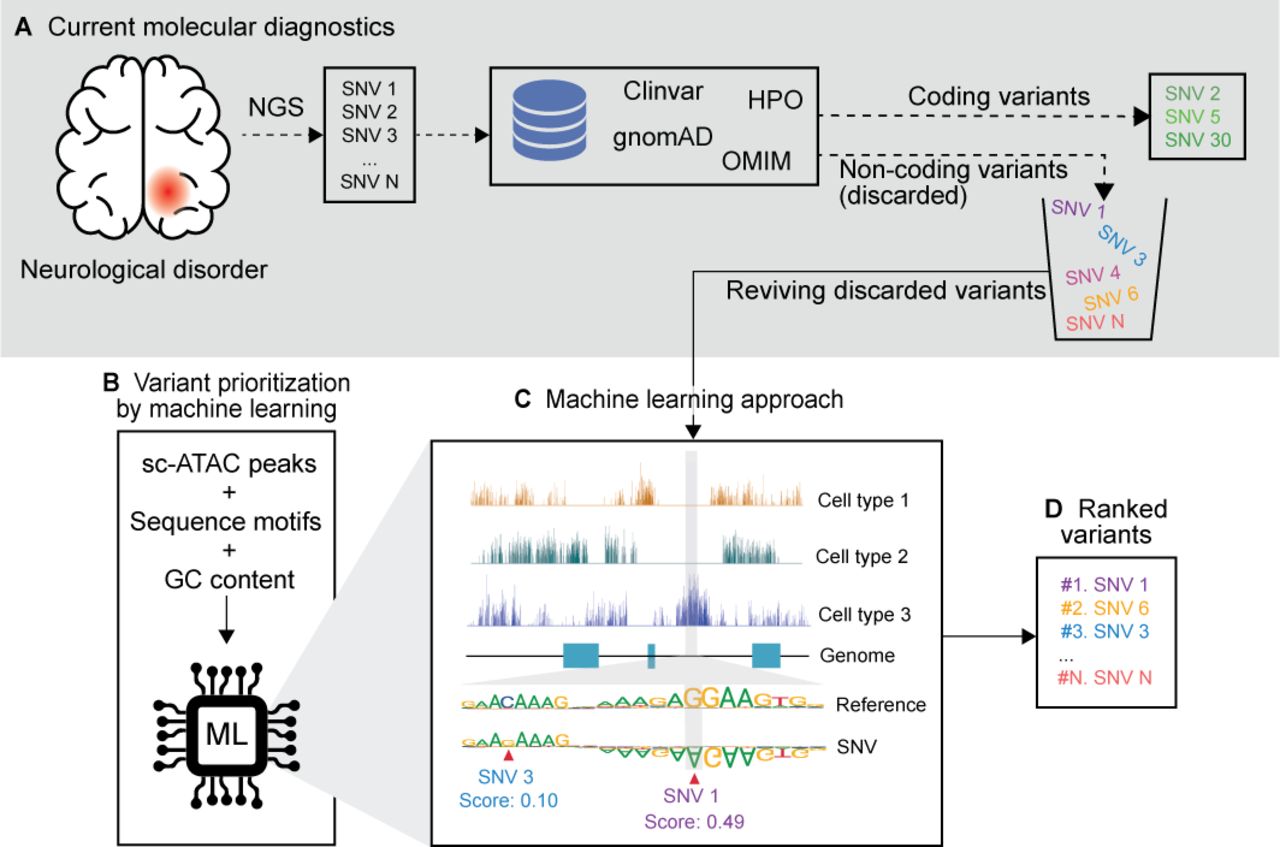
Genome-wide association studies (GWAS) and the widespread introduction of NGS technologies in medical genetics have led to a massive increase in the identification of common and rare variants, respectively.155 Most of these variants fall into the non-coding genome. By far, not all these variants have an associated disease phenotype yet, and the experimental screening of variants is expensive, laborious and time-consuming. Currently, databases like Clinvar, HPO and OMIM are used to filter for known gene variants (figure 5A). Computation methods play a key role in the interpretation of these unknown variants, but current variant prioritisation methods, like deep-learning methods to prioritise non-coding variants,156–159 CADD score,160 SIFT159 and several other methods161 use bulk-seq data to rank these candidate variants based on highest disease-association probability. Sc-seq can enhance these methods by providing information at a cell type level rather than at a tissue level. This higher dimensionality information can enhance the interpretation of how subtle changes can lead to diseases. This section focuses on how machine learning models trained on sc-seq data can prioritise a given of variants found either through GWAS or whole genome sequencing.

Variant prioritisation workflow with sc-ATAC data. (A) The current molecular diagnostic workflow starts with the next-generation sequencing (NGS) of a patient with a specific disease (eg, autism spectrum disorder), which identifies a large number of variants. Various databases are used to filter and rank the variants in the coding region. Meanwhile, a large number of variants in the non-coding regions are discarded, due to the lack of prioritisation methods. (B–D) Variant prioritisation with sc-seq data helps rank every variant pertinent to a cell type even if it is previously not known. (B) Supervised machine learning approaches are trained on sc-ATAC peaks, transcription factor sequence motifs and matched GC content of the peak and non-peak regions of a control sample. (C) sc-ATAC-seq data provide the machine learning model insights into the chromatin accessibility profile of all the cell types in the tissue and the sequence motifs inform the model on the allelic importance. Pathogenicity of unknown variants are predicted based on the disruption it causes to the accessibility of the loci. For example, the sequence motif shows the significance of the alleles which are accessible only in cell type 3. Single nucleotide variant (SNV)1 (G>A), therefore, causes a large disruption to the epigenome and thus receives a high score. Whereas SNV3 (C>G) is in the same accessible region, but the allele in the motif is not significant and the disruption it causes is low, hence it is scored low. (D) Variants are ranked based on the predicted pathogenicity scores. (A–D) Synthesised data based on Corces et al and Trevino et al.115 162
Corces et al115 and Trevino et al162 showed that an sc-ATAC atlas of brain cells can be used to prioritise non-coding variants (figure 5B–D). Corces et al prioritised GWAS variants for Alzheimer’s disease and Parkinson’s disease by developing a machine learning model (gkm-SVM). They trained their model with sc-ATAC-seq data of adult human brains to predict the importance of each allele for chromatin accessibility. Trevino et al also used the sc-ATAC of developing human cerebral cortex, but to prioritise non-coding de novo mutations from patients with autism spectrum disorder from the Simons Simplex Collection.163 They used BPNet,164 which is a deep convolutional neural network model that predicts each transcription factor’s per base binding signal as counts (ChIP-nexus).163 Both methods were trained with cluster-specific sc-ATAC-seq peaks, transcription factor sequence motifs in the peak region, along with the regions where GC content of the peak region matches with the non-peak region to reduce the bias due to GC content in the prediction (figure 5B). This enabled them to predict an importance or disruption score based on the changes in the chromatin accessibility with allelic changes (figure 5C and D). This way, variants whether identified de novo or through GWAS approaches could be prioritised. Trevino et al tested their model with sc-ATAC-seq data of cell types from other organs like heart and noticed that there was no change in the case versus control mutations, signifying that the disease state was highly cell type specific. They were also able to predict the most frequently disrupted motifs in autism. Even though the conservation score and the distance to the gene were similar in case and control mutations, sc-ATAC was able to rank the pathogenic mutations, which would have been difficult to identify by other methods. Similar sc-ATAC-seq data-based approaches have been used to prioritise 527 GWAS variants in 48 diseases5 and in type 2 diabetes.165 Sc-seq data can also help elucidate the mechanisms in which GWAS variants affect haematopoiesis166 and type 1 diabetes.167
With such applications being validated across various diseases and with the establishment of Human Cell Atlas of disease and healthy individuals, we can be hopeful that the in silico variant prioritisation methods using sc-seq data will evolve further to be able to rank the effect of rare de novo mutations for routine clinical diagnostics. Currently, however, these methods stop short of providing insights into the global mechanistic consequences of the ranked variants, especially when the variants are located in unannotated genomic regions. Methods such as sc-RNA-eQTL168, sc-ATAC-eQTL169 and single-cell functional genomic approaches (prospective application 1) can further enable functional annotation of the ranked variants by tracking cellular-level changes, which would be missed by bulk-seq, and help uncover holistic disease biology.
Current limitations
While the sc-seq technology and the ways in which it is implemented to address current challenges are advancing at a staggering pace in basic research, several aspects currently hinder their adoption in clinic practice, in particular the cost. Even if the cost was not an issue, several practicalities require that the diagnostics work in collaboration with a research lab specialised in single-cell sequencing, imposing additional barriers. For example, the experimental workflow, especially at the stages of tissue dissociation, requires case-by-case optimisation, depending on the tissue type, whether the tissue is fresh or frozen, as well as the age. Careful consideration of parameters such as sequencing depth and cost are required, especially for multimodal co-assays. As an example, the additional sample processing steps in sc-ATAC-seq can come at the expense of the transcriptome data quality when performing such co-assays. Even with commercial kits, generation of high-quality data may require adaptation or customisation of protocols, which adds to the time and cost. Enormous amounts of data are generated in all the single-cell sequencing approaches, posing data storage issues. The data are also information-rich, making it on the one hand versatile, but on the other hand complex. It necessitates sophisticated analysis to extract biological meaning and clinical significance. Dropout events are an ongoing issue in sc-seq. In sc-transcriptome-seq and sc-proteome-seq, dropouts occur when not all molecules are captured during library preparation.170 In sc-genome-seq and sc-epigenome-seq, amplification imbalances cause allelic or site dropouts.101 Dropout events result in the sparsity of the data, making the downstream analysis such as feature selection, dimensionality reduction and differential analysis strenuous. Another pitfall is batch effects between samples processed separately. While batch correction methods can be applied during data analysis, it may lead to the loss of true biological effects. Additionally, many of the analysis methods have not yet been fully standardised and require the judgement and interpretation of an experienced bioinformatician.171 The field is growing at a rapid pace with many of these practical limitations soon to be addressed.
Outlook
With increasing cellular throughput and the possibility to multiplex samples during the barcoding process, the drop in the cost per sample is expected to continue.7 172 Computational methods are also evolving daily to overcome the challenges posed by the high data dimensionality, data sparsity due to dropout events, data variability between batches, etc. It is foreseeable that fully integrated and automated instruments will become commercially available over the next decade, streamlining all aspects of the single-cell sequencing resulting in a ‘plug-n-play’ workflow. As with all high-throughput in vitro technologies for variant testing, functional sc-seq approaches may also generate data of uncertain clinical significance or misclassify individual variants. Therefore, it is important to note that these data cannot stand alone but need to be integrated with all other available clinical and molecular information. The medical genetics community will have to develop frameworks on how to integrate high-throughput variant testing into clinical decision making. The technology is at the doorsteps of human genetics diagnostics. However, similar to whole genome and exome sequencing, it may take time until we see the routine use of these powerful sc-seq technologies in the clinic.
Ethics statements
Patient consent for publication
Ethics approval
Not applicable.
Acknowledgments
VKAS thanks the up-to-date resource on single-cell sequencing technologies maintained by Albert Vilella (bit.ly/scellmarket), which assisted the literature search. VKAS and SB thank Dr Kristian Händler for discussions on the experimental workflow.
References
Supplementary materials
Supplementary Data
This web only file has been produced by the BMJ Publishing Group from an electronic file supplied by the author(s) and has not been edited for content.
Supplementary Data
This web only file has been produced by the BMJ Publishing Group from an electronic file supplied by the author(s) and has not been edited for content.
Footnotes
VKAS and SB contributed equally.
Contributors VKAS and SB contributed equally to this work. MS supervised this work.
Funding MS is DZHK principal investigator and is supported by grants from the Deutsche Forschungsgemeinschaft (DFG) (SP1532/3-2, SP1532/4-1 and SP1532/5-1), the Max Planck Society and the Deutsches Zentrum für Luft- und Raumfahrt (DLR 01GM1925).
Competing interests None declared.
Provenance and peer review Not commissioned; externally peer reviewed.
Supplemental material This content has been supplied by the author(s). It has not been vetted by BMJ Publishing Group Limited (BMJ) and may not have been peer-reviewed. Any opinions or recommendations discussed are solely those of the author(s) and are not endorsed by BMJ. BMJ disclaims all liability and responsibility arising from any reliance placed on the content. Where the content includes any translated material, BMJ does not warrant the accuracy and reliability of the translations (including but not limited to local regulations, clinical guidelines, terminology, drug names and drug dosages), and is not responsible for any error and/or omissions arising from translation and adaptation or otherwise.