Article Text

Abstract
Background Mitochondria provide ATP through the process of oxidative phosphorylation, physically located in the inner mitochondrial membrane (IMM). The mitochondrial contact site and organising system (MICOS) complex is known as the ‘mitoskeleton’ due to its role in maintaining IMM architecture. APOO encodes MIC26, a component of MICOS, whose exact function in its maintenance or assembly has still not been completely elucidated.
Methods We have studied a family in which the most affected subject presented progressive developmental delay, lactic acidosis, muscle weakness, hypotonia, weight loss, gastrointestinal and body temperature dysautonomia, repetitive infections, cognitive impairment and autistic behaviour. Other family members showed variable phenotype presentation. Whole exome sequencing was used to screen for pathological variants. Patient-derived skin fibroblasts were used to confirm the pathogenicity of the variant found in APOO. Knockout models in Drosophila melanogaster and Saccharomyces cerevisiae were employed to validate MIC26 involvement in MICOS assembly and mitochondrial function.
Results A likely pathogenic c.350T>C transition was found in APOO predicting an I117T substitution in MIC26. The mutation caused impaired processing of the protein during import and faulty insertion into the IMM. This was associated with altered MICOS assembly and cristae junction disruption. The corresponding mutation in MIC26 or complete loss was associated with mitochondrial structural and functional deficiencies in yeast and D. melanogaster models.
Conclusion This is the first case of pathogenic mutation in APOO, causing altered MICOS assembly and neuromuscular impairment. MIC26 is involved in the assembly or stability of MICOS in humans, yeast and flies.
- genetics
- clinical genetics
- metabolic disorders
- neuromuscular disease
This is an open access article distributed in accordance with the Creative Commons Attribution Non Commercial (CC BY-NC 4.0) license, which permits others to distribute, remix, adapt, build upon this work non-commercially, and license their derivative works on different terms, provided the original work is properly cited, appropriate credit is given, any changes made indicated, and the use is non-commercial. See: http://creativecommons.org/licenses/by-nc/4.0/.
Statistics from Altmetric.com
Introduction
Mitochondria are double-membrane organelles defining four compartments: the outer mitochondrial membrane (OMM); the intermembrane space; the inner mitochondrial membrane (IMM), containing the oxidative phosphorylation system (OXPHOS); and the matrix.1 The IMM is divided into two domains: the inner boundary membrane (IBM) and the cristae, which are connected by the cristae junctions (CJs).1 The CJs contain the mitochondrial contact site and organising system (MICOS).2 3 Mammalian MICOS complexes are composed of seven subunits: MIC60, MIC19, MIC10, MIC26, MIC27, MIC13 and MIC25. MIC60 and MIC19 in the mitochondrial intermembrane bridging (MIB) are in contact with the OMM. In the CJs, MIC60 and MIC10 play a dominant role in cristae organisation.4
In mammals and Saccharomyces cerevisiae, two paralog MICOS subunits5 6 belong to the APOO family (APOOL/MIC27 and APOO/MIC26). MIC26 was described to be glycosylated, producing a 55 kDa form found both inside the cells (Endoplasmic Reticulum and Golgi apparatus) and in the extracellular space, associated with cholesterol efflux7 and the non-glycosylated form of 22 kDa. The last one is present only in mitochondria, and its downregulation leads to mitochondrial morphology changes with a reduction in the number of CJs and reduced oxygen consumption in HeLa cells.8
Defects in the MICOS system have been previously associated with mitochondrial disorders. In particular, pathogenic variants in MICOS13 (MIC13, QIL1 or C19ORF70), encoding a protein essential for MICOS assembly and function, are associated with childhood-onset encephalopathy and hepatopathy with combined mitochondrial respiratory chain deficiency.9–11 Mutations in CHCHD10, a MIC60-interacting protein,12 have been previously associated with clinical symptoms such as isolated myopathy, frontotemporal dementia and/or amyotrophic lateral sclerosis type II, and spinal muscle atrophy, Jokela type,13 with autosomal dominant inheritance. Even though no disease had been associated with APOO defects, dysfunction of MICOS components and interactors are likely involved in a range of human diseases such as frontotemporal dementia–amyotrophic lateral sclerosis syndrome, epilepsy, Parkinson’s disease, optic atrophy, cardiomyopathy and diabetes.14–16
Until this report, there were no known pathological variants in APOO causing mitochondrial disease. In this study, we describe a family carrying a c.350T>C pathogenic variant (p.I117T in MIC26) causing impaired processing of the mature form and binding to the IMM. Consequently, alterations in MICOS assembly and abnormalities in mitochondria ultrastructure were observed in patient-derived fibroblasts. The yeast MIC26 null strain showed slightly impaired growth under stress conditions, which was not rescued when the mutant protein was expressed, thus confirming the pathogenicity of p.I117T. The Drosophila melanogaster APOO ortholog (dApoO) was also shown to be essential for MICOS assembly, mitochondria cristae architecture and respiratory function.
Methods
Molecular studies
DNA was extracted from blood using DNeasy Kit (Qiagen). Whole exome sequencing (WES) was carried out using Illumina 2000 HiSeq and the GRCh37 reference genome, and a genome analysis toolkit, GATK-based pipeline was used to call, filter and annotate variants.17 Sanger sequencing was performed by Source BioScience, Cambridge, UK. SnapGene 4.3.3 (GSL Biotech LLC) was used for chromatogram visualisation and analysis. X-chromosome inactivation using HpaII digestion was performed as previously described.18 Briefly, 400 ng of total blood isolated genomic DNA from females was incubated (37°C for 2 hour) with 4U of HpaII. After digestion of the active X chromosome, as HpaII is methylation-sensitive, the X-inactive chromosome was amplified by PCR sequenced as described previously. Pedigree was mounted using Pedigree Draw (Genial Genetic Solutions).
MRI
MRI of the brain were performed with a 1.5 T MR unit (Signa Explorer, GE Medical Systems). T1-weighted images (echo time (TE)/repetition time (TR) 11 ms/550 ms), T2-weighted images (TE/TR 93 ms/4000 ms), fluid-attenuated inversion recovery (FLAIR) (TE/TR/inversion time 110 ms/10 000 ms/2250 ms) and diffusion-weighted images (TE/TR: 105 ms/5200 ms) were obtained.
Cell culture
Fibroblasts were derived from patient skin and HeLa cells were obtained from ATCC (CCL-2), which were grown in high-glucose or galactose DMEM (Dulbecco's Modified Eagle Medium) supplemented with Glutamax, sodium pyruvate, 10% FBS (fetal bovine serum), penicillin/streptomycin (Gibco Life Technologies) in humidified atmosphere at 37°C and 5% CO2. Immortalisation and cell rescue were performed by lentiviral infection (pLOX-Ttag-iresTK, Addgene plasmid #12246, pWPXLd-APOO-HA and pWPXLd-Ires-PuroR ‘empty vector’). Transfections were performed using Metafectene (Biontex).
S2R+ cells were grown at 25°C in Schneider’s medium (Thermo Fisher) with 10% FBS (Gibco). S2R+ cells were transfected using Effectene (Qiagen).
TnT in vitro transcription/translation and in organello import
Transcription/translation was performed using the Promega TnT Quick Coupled System (L1170). The radiolabelled MIC26 products were used for the in organello import assays in mitochondria from HeLa cells as described.19
Western blotting
Samples were lysed in TG buffer (Tris–HCl 20 mM, NaCl 150 mM, EDTA 1 mM, Triton-X-100 1%, glycerol 10% and MgCl2 1.5 mM) with the addition of protease and phosphatase inhibitors. Lysates were centrifuged (6900×g, 10 min); supernatants were mixed with loading buffer and separated by sodium dodecyl sulfate–polyacrylamide gel electrophoresis (SDS-PAGE) prior to immunoblotting. Protein concentration was measured using the DC protein assay (Bio-Rad). Immunodetection signal intensities were quantified using ImageJ.20 The antibodies list is shown in online supplementary S1.1.
Supplemental material
Dephosphorylation of proteins
Cells were lysed in RIPA buffer (0.3 M NaCl, 0.1% SDS, 50 mM Tris, pH 7.4, 0.5% deoxycholate, 1 mM Na3VO4, 10 mM NaF, 10 mM MgCl2, 1% n-dodecyl β-D-maltoside, 1 mM Phenylmethylsulfonyl fluoride or PMSF) with or without phosphatase inhibitors (Na3VO4, NaF, PMSF and PhosSTOP). For 400 µg of protein, 100 U of calf-intestinal alkaline phosphatase (CIP) was incubated for 30 min at 30°C in dephosphorylation buffer (5 mM Tris pH 7.9, 10 mM NaCl, 1 mM MgCl2 and 0.1 mM Dithiothreitol). The reaction was stopped by adding loading buffer.
Microscopy
Cells were fixed (3.7% formaldehyde in Phosphate-buffered Saline - PBS), permeabilised (0.1% Triton X-100, 0.05% sodium deoxycholate in PBS) and stained with primary and secondary antibodies (Invitrogen) in blocking solution (5% goat serum). Coverslips were mounted with ProLong Glass (Invitrogen). Confocal image acquisition was performed as described in online supplementary S1.2. Quantification of mitochondria interpuncta distance (IPD) was performed in aleatorily chosen regions in a blind way. Segmented lines were drawn across the mitochondria length connecting MIC60 dots. Profile of intensities were plotted and distance was calculated from each peak manually using ImageJ.20
For transmission electron microscopy (TEM), fibroblasts were fixed (2.5% glutaraldehyde, 2% paraformaldehyde in 0.1 M PB buffer) for 1 hour. D. melanogaster heads and thoraxes were dissected in fixative and incubated on rotator overnight at 4°C. Cells were scraped and centrifuged (2500 RPM, 10 min, 4°C), and all the samples were washed with 0.1 M PB buffer. Samples were sent to the Electron Microscopy Platform (University of Barcelona, Spain) for sample preparation. Ultrathin sections (55 nm) were cut and mounted on 200 mesh copper grids with carbon support film. Image acquisition was performed with a transmission electron microscope (FEI Tecnai G2 Spirit) coupled with an CCD camera (Orius-SC200B, Gatan). Quantification was performed blindly and manually using ImageJ.20 For fibroblasts, 20 cells were analysed for each condition, and the number of cristae was counted per visible mitochondria area; maximum cristae width was determined by measuring randomly three to four cristae/mitochondrion and number of CJs counted per total of cristae. For flies, two samples were analysed specifically in the brain and muscle for each genotype. Maximum cristae width was determined by measuring randomly three to four cristae and the number of CJs per mitochondrion of 20 regions in the brain and 10 regions in the muscle.
O2 consumption measurements
Respiration in intact cells was measured using an Oxygraph‐2 k High Resolution Respirometer (Oroboros Instruments) as described.21
Blue native polyacrylamide gel electrophoresis (BN-PAGE) and in-gel activity (IGA)
Samples for BN-PAGE and IGA were prepared as described previously.22–24
Yeast model
The yeast haploid strain BY4741 Δmic26 (MATa his3Δ1 leu2Δ0 met15Δ0 ura3Δ0 mic26::KanMX4) derived from the Euroscarf collection was used. Experiments were performed in synthetic complete (SC) medium (6.9 g/L yeast nitrogen base) without amino acids (ForMedium), 1 g/L drop‐out mix without amino acids or bases.25 Media were supplemented with carbon sources (Carlo Erba) in liquid phase or after solidification with 20 g/L agar. Plasmids were inserted using ‘LiAc/SS carrier DNA/PEG quick method’.26
Spot assays were performed on Petri dishes and pictures were taken after growth at 28°C. After 3 days of growth on SC medium supplemented with 5% ethanol, a picture of the second spot was taken at the microscope with a ×100 magnification. Diameter was measured only for colonies harbouring more than 50 cells, corresponding to a diameter longer than 19.8 µm. For each strain, 100 colonies were measured on two independent clones.
Fly stocks and methods
Flies were raised on medium made of agar, cornmeal, molasses, propionic acid and yeast extract, and maintained at 25°C, on a 12-hour light–dark cycle. The following strains were obtained from the Bloomington Drosophila Stock Centre w1118 (ID 6326), y[1] P{y[+mDint2] w[BR.E.BR]=SUPor P}amn[KG05433a] Hers[KG05433a]; ry[506] P{SUPor-P}CG5903[KG05433b] (ID: 14005). Line 14 005 was backcrossed with strain w1118 in order to replace the X chromosome, carrying the allele KG05433a. The resulting line’s genotype is w1118; ry[506] P{y[+mDint2] w[BR.E.BR]=SUPor P}CG5903[KG05433b].
For lifespan assay, flies were reared at standard low density, collected after hatching, and divided into males and virgin females over a 24-hour window. Adults of the same sex were kept at a density of 10 per vial (for a total of 60 individuals) at 25°C. Flies were counted and transferred to new tubes with fresh medium three times per week, without anaesthesia.
Climbing test was performed using a modified version of the countercurrent apparatus originally designed by Benzer27 as described previously.24
Mitochondria were prepared by differential centrifugation as previously described.24
Statistical analysis
GraphPad Prism software was used, and tests as well as p value are described in the figure legends.
Results
Case report
Proband (figure 1A, IV1) is a male child aged 8 years, the oldest of two siblings from non-consanguineous parents. Clinical history included uneventful perinatal development, although he was born by caesarean delivery, weighing 3055 g and with a head circumference of 49 cm at birth, with no reported complications before or after birth. The mother (figure 1A, III2) presents tiredness, headaches and muscle weakness and had three pregnancies with one previous miscarriage (at the sixth week). Brother and father were reported to be healthy. Several members of the family report muscle weakness, neurological problems and lactic acidosis.

APOO mutation c.350T>C (p.I117T) shows an X-linked recessive inheritance pattern causing a range of phenotypes with affected females, depending on X-chromosome skewing. (A) Pedigree showing segregation of the c.350T>C mutation in APOO of the proband (indicated by arrow) family. Phenotypes are shown as *, # and %. (B) Brain MRI of proband showing hyperintense signal in the white matter. (C) Schematic domains of MIC26 protein showing the position of possible MTS in N, APOO domain (light grey) including the transmembrane domain where the mutation (I117T) is found. Residue S162 is shown for O-glycosylation position of the non-mitochondrial form. (D) Sequence chromatograms showing direct family members of proband with the mutation c.350T>C in heterozygosity in the mother (III:2) and hemizygosity in the proband (IV:1). (E) Sequence chromatograms showing the presence of the mutation in the skewed X-chromosome in the females (III:4, III:6, III:7) and the complete inactivation of the normal allele in the proband mother (III:2). *, muscle weakness; #, neurological problems; %, increased blood lactate; FLAIR, fluid-attenuated inversion recovery; MTS, mitochondrial targeting sequence; N, N-terminus.
The proband presented at 2 years with vomiting, fever and diarrhoea accompanied by progressive developmental delay, irritability, fatigue, hypotonia, weight loss, gastrointestinal and body temperature dysautonomia, repetitive infections, cognitive impairment and autistic behaviour. The first suspected diagnosis was autism spectrum disorder due to speech regression, hand stereotypies and flapping, with worsening of these symptoms during infections. Blood tests such as lactate and pyruvate were consistently elevated; venous blood examination showed severe metabolic acidosis and altered carnitine profile (increased C4, C5, C5:1, C5-OH), suggesting the possibility of a mitochondrial disease.
Brain MRI showed hyperintense signals in T2/FLAIR sequences in the white matter of the peritrigonal region, possibly corresponding to gliosis (figure 1B). The mother also presented hyperintense signals in T2/FLAIR in the white matter of the subcortical parietal frontal lobe (online supplementary figure S1A).
Treatment was started with L-carnitine, biotin and CoQ10, and was associated with normalisation of MRI, weight gain, decreased fatigue, irritability and autistic behaviour. The mother was also treated with good response to L-carnitine and CoQ10. The patient is currently undergoing reposition of immunoglobulins with decreasing of repetitive infections and consequently improving general clinical presentation.
Genetic analysis
WES analysis of the proband DNA revealed the presence of a c.350T>C change in exon 5 of APOO, located in the Xp.22.11 region, predicting a p.I117T missense change in the translation product MIC26. This variant was not found in control population databases28 29 and was predicted to be likely pathogenic in mutation taster (score 1), provean (score −4.19) and vest3 (score 0.924). The amino acid change is localised in the transmembrane region of the hydrophobic domain of the MIC26 (figure 1C).
The mother (III:2) was heterozygous for the c.350T>C variant (figure 1D) and the proband (IV:1) is hemizygous. Familial segregation (online supplementary figure S1B) showed variability in clinical presentation, ranging from asymptomatic (figure 1A; II8, II10, III4, III6) to neuromuscular affectations like learning difficulties and cognitive impairment (figure 1A; II2, II5, II6, IV1), fatigue and muscle weakness (figure 1A; II2, II5, II6, III2, III7, IV1) and increased blood lactate (figure 1A: IV7, IV1). Some females presented a clinical phenotype (figure 1A; III7, II6), but X-chromosome skewing pattern in blood cells was inconclusive in some cases, with affected females presenting random inactivation (figure 1E and online supplementary figure S1B). In the case of the proband’s mother (figure 1D, III2), predominant activation of the mutant allele was observed (figure 1E, III2). Thus, leading to the conclusion of an X-linked recessive inheritance of this mutation.
Fibroblast characterisation
Analysis of MIC26 steady-state levels showed reduced levels and evident slower electrophoretic mobility of the mitochondrial 22 kDa form in the immortalised proband-derived (P) fibroblasts (figure 2A). Differences in the glycosylated 55 kDa band were observed neither in P fibroblasts nor HeLa cells transfected with MIC26 small interfering RNA (siRNA) (online supplementary figure S1C).

MIC26I117T binds weakly to the inner membrane due to incorrect precursor processing. (A) SDS-PAGE for MIC26 and GAPDH showing the cytosolic (55 kDa) and mitochondrial (22 kDa) MIC26 isoforms in Ctrls (C1, C2 and C3) and P. Representative image of five biological replicates. (B) TnT and in vitro organelle import of MIC26 WT and mutant showing # and two imported processed forms (* and **). Representative image of two biological replicates. (C) Representative N-SIM micrographs of HeLa cells expressing MIC26WT-HA or MIC26I117T-HA labelled with anti-HA and anti-TOMM20 antibodies. Maximum intensity projection is shown. Scale bars: 5 µm, inset: 1 µm. Representative image of three biological replicates. (D) SDS-PAGE blotted for HA and MIC26 showing Ctrl, PEV, overexpressing MIC26 WT (PMIC26-HA+) and rabbit reticulocytes lysates after in vitro transcription/translation of MIC26 WT (TnTMIC26-HA_WT) and mutant (TnTMIC26-HA_I117T). Cytoplasmic #, ** and *. (E) SDS-PAGE for P-DRP1 (S616), DRP1, MIC26 and GAPDH in total lysates treated with (+) or without (−) phosphatase inhibitors and akaline phosphatase from fibroblasts: Ctrl, PEV (expressing empty vector), PMIC26-HA (MIC26-HA WT – low levels), PMIC26-HA+ (MIC26-HA WT high levels), representative image of two biological replicates. (F) SDS-PAGE for HA, CO1 and ACO2 from different mitochondrial fractions (sol and memb) of HeLa cells overexpressing MIC26-HAWT and MIC26-HAI117T. Representative image of two biological replicates. GAPDH, glyceraldehyde-3-phosphate dehydrogenase; MW, molecular weight; #, non-imported precursor; *, intermediate form; **, mature form; CCCP, Carbonyl cyanide 3-chlorophenylhydrazone; HA, human influenza hemagglutinin; N-SIM, Nikon structured illumination microscope; Memb, membrane bound; Sol. soluble; Ctrl, control; P, proband fibroblast; PEV, P fibroblasts expressing empty vector; SDS-PAGE, sodium dodecyl sulfate–polyacrylamide gel electrophoresis.
To explore if the difference in size observed in the patient MIC2622Kda form was due to processing issues during mitochondrial import, we performed in organello import using both wild-type (WT) (MIC26_WT) and mutant (MIC26_I117T) radioactively labelled proteins (figure 2B). This assay revealed that the both WT and mutant mature proteins (*) are obtained through a double cleavage of the precursor proteins (#) during membrane potential-dependent import, showing the appearance of an intermediate product (**). However, the processing of the MIC26_I117T was different from that of the WT, giving rise to intermediate and mature species running noticeably slower than those from MIC26_WT (apparent molecular sizes of 20.6 vs 19.1 kDA and 18.5 vs 17.8 kDa, respectively). These observations explain why MIC26 in the P cells displayed slower electrophoretic mobility (figure 2A). However, there were no differences in the mitochondrial localisation of MIC26-HAWT and mutant MIC26-HAI117T shown by super-resolution microscopy (figure 2C). When an HA-tagged version of the protein was overexpressed in the patient cells (PMIC26-HA+), the intermediate processing band (**) became evident (figure 2D). This was specific to the import process, as these processed products were not detected when dissipating the membrane potential with the uncoupler carbonyl cyanide 3-chlorophenylhydrazone - CCCP (figure 2B and online supplementary figures S1D,S1E). In these conditions, the cells accumulated the precursor in the cytoplasm and were visible when inhibiting the proteasome with epoxomicin (online supplementary figure S1E).
Another interesting observation was that when synthesising in vitro the MIC26WT and MIC26I117T precursors with and without HA tag, we observed a slightly slower electrophoretic mobility of the mutant protein (figure 2B,D and online supplementary figure S1D). We hypothesised that the difference in the precursor size could be due to the presence of a phosphorylation site in T117, which is predicted by NetPhos30 V.3.1 and PPS.31 However, the incubation of cell lysates from the patient fibroblasts with alkaline phosphatase did not produce a change in the size of MIC26 (figure 2E). This result suggests that the altered electrophoretic mobility is not due to phosphorylation. The existence of post-translational modifications or conformational abnormalities induced by the I117T change may be interesting to analyse in the future.
Bioinformatics predictions (by THMM2.032 indicated disruption of the MIC26 transmembrane domain by the I117T change (online supplementary figure S1F), potentially impairing its association with the IMM. We tested this possibility by analysing the differential interaction of MIC26-HAWT and MIC26-HAI117T with the IMM. As shown in figure 2F, the mutated protein was clearly more sensitive to carbonate extraction, indicating a looser interaction with the IMM than the WT.
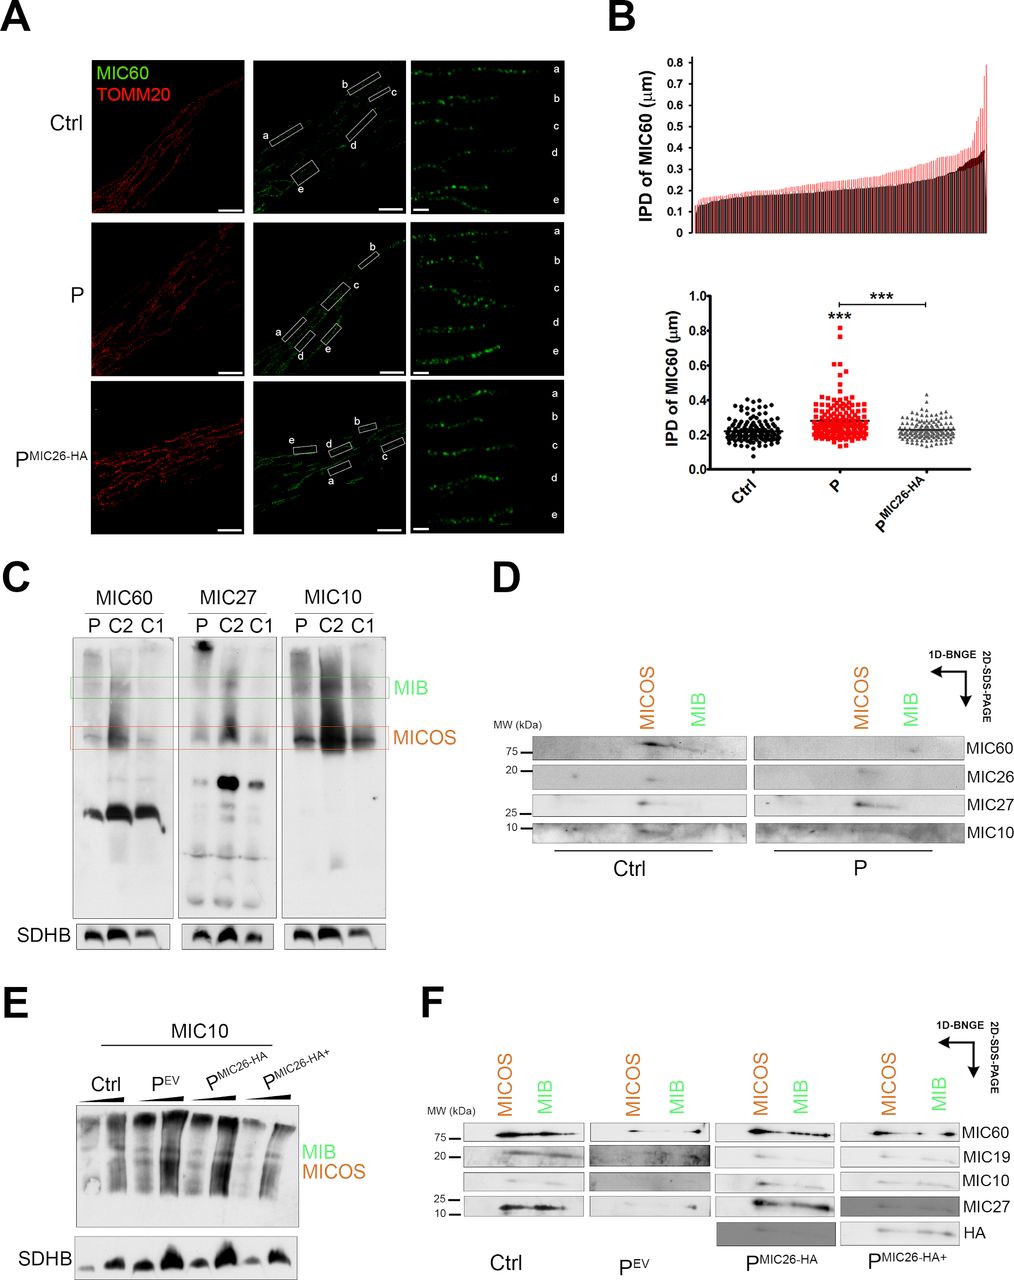
To test if this altered membrane association of MIC26I177T disrupts the localisation and assembly of MICOS, we measured the distribution of the MICOS subunit MIC60 using super-resolution microscopy (figure 3A and online supplementary figure S2A). The IPD between two consecutive puncta of MIC60 in the IBM was altered in the patient cells (figure 3B) and also when the mutant MIC26 was overexpressed in HeLa cells (online supplementary figure S2B). The expression of WT MIC26 in the patient cells (PMIC26-HA) rescued the IPD to control values (figure 3B). No differences in mitochondrial morphology in P fibroblasts grown in either glucose or galactose media were observed (online supplementary figure S2C). Likewise, except for MIC26, no major differences in the steady-state levels of the other tested MICOS subunits were observed (online supplementary figure S2D,S2E). Also, overexpression of MIC26 (online supplementary figure S2D) or depletion by siRNA in HeLa cells (online supplementary figure S2F) did not alter the levels of other MICOS components.

Distribution of MIB and MICOS components is altered in patient fibroblasts. (A) N-SIM super-resolution micrographs showing Ctrl, P and PMIC26-HA fibroblasts labelled with anti-MIC60 and anti-TOMM20 antibodies. maximum intensity projection for TOMM20 and a single Z-stack (0.1 µm) for MIC60 are shown. Scale bars: 5 µm, inset: 1 µm. Representative image of two biological replicates. (B) Charts show histogram for IPD of MIC60 and mean±SEM (n=150 from five different cells); one-way analysis of variance followed by Tukey’s multiple comparison, p<0.001***. (C) BN-PAGE showing the distribution of MIB and MICOS complex immunoblotted for MIC60, MIC27 and MIC10 antibodies in Ctrls (C1 and C2) and P fibroblasts. Representative image of three biological replicates. (D) Second-dimension PAGE from BN of fibroblasts (Ctrl and P) immunoblotted for MIC60, MIC27, MIC10 and MIC26 antibodies. Representative image of two biological replicates. (E) BN-PAGE showing the distribution of MIB and MICOS complex immunoblotted for MIC10 antibody in Ctrl and proband (PEV, PMIC26-HA and PMIC26-HA+) fibroblasts. Representative image of two biological replicates. (F) Second-dimension PAGE from BN immunoblotted for MIC60, MIC27, MIC19, MIC10 and HA antibodies. Representative image of two biological replicates. N-SIM, Nikon structured illumination microscope; BN-PAGE, blue native polyacrylamide gel electrophoresis; Ctrl, control; HA, human influenza hemagglutinin; SDHB, succinate dehydrogenase iron-sulfur subunit; IPD, interpuncta distance; MIB, mitochondrial intermembrane bridging MICOS, mitochondrial contact site and organising system; P, proband fibroblast; PEV, P fibroblasts expressing empty vector.
Next, we analysed the assembly status of MICOS by BN-PAGE (figure 3C) followed by second-dimension SDS-PAGE (figure 3D), which in control fibroblasts showed the presence of two main MICOS bands, the MIB complex at ~2000 kDa and the MICOS complex at ~700 kDa, as previously described.33 In contrast with the control samples, where MIC60 was found in both complexes but preferentially accumulated in the MICOS band, in P fibroblasts, MIC60 was found mainly incorporated into MIB (figure 3D). This alteration was specifically associated with the MIC26 mutation, as expression of the WT protein in P fibroblasts restored the normal complex distribution between MICOS and MIB (figure 3E and F). Moreover, excessive MIC26 expression (PMIC26-HA+) also resulted in mislocalisation of the subunits (figure 3F). The importance of a correct level of MIC26 for the proper assembly of the MICOS complex was corroborated by RNAi in HeLa cells, showing a similar pattern of MICOS subunit accumulation towards the MIB (online supplementary figure S3A,S3B). These results suggest that a finely tuned equilibrium among the subunits is necessary to maintain the structure of MICOS.

TEM analysis of patient samples showing altered number of cristae and CJs, and width of cristae. (A) Representative TEM micrographs from Ctrl and Ps (PEV and PMIC26-HA) showing mitochondria ultrastructure. Scale bars: 0.2 µm. Representative images of two biological replicates. (B) Charts show mean±SEM (n=20) of number of cristae per mitochondrial area, cristae maximum width and number of CJs per cristae. One-way ANOVA followed by Tukey’s multiple comparison shows significant differences (cristae number: Ctrl vs P: **p=0.0065, P vs PMIC26: **p=0.0022; cristae width: Ctrl vs P: **p=0.0011, P vs PMIC26: **p=0.0024; CJs per cristae: Ctrl vs P: *p=0.0177, P vs PMIC26: *p=0.0166). (C) Charts show mean±SEM (n=4 biological replicates) OCR of cells grown in galactose and (D) glucose. Two-way ANOVA followed by Sidak’s multiple comparison shows significant differences in basal OCR (Ctrl vs PEV: *p=0.032, PEV vs PMIC26: p=0.0042), oligomycin OCR (Ctrl vs PEV: **p=0.0037), maximum OCR (PEV vs PMIC26: **p=0.0015) for cells grown in galactose. ANOVA, analysis of variance; CJ, cristae junction; Ctrl, control; P, proband fibroblast; PEV, P fibroblasts expressing empty vector; TEM, transmission electron microscopy; OCR, oxygen consumption rate.
To test whether the MICOS alterations resulted in abnormalities in the formation of cristae and CJs, we analysed mitochondrial ultrastructure in fibroblasts by TEM (figure 4A). P fibroblasts showed wider and fewer cristae and CJs per cristae than the controls or the rescued (PMIC26) cells (figure 4B). However, this did not produce a reduction in the steady-state levels of OXPHOS subunits (online supplementary figure S3C), although oxygen consumption rates were reduced in the P cells grown in galactose (figure 4C) but not in glucose (figure 4D).
Yeast model
Yeast is a rapid and efficient tool to study the consequences of single point mutations, which can be easily introduced and stable maintained. S. cerevisiae has two orthologs of APOO, MIC26 and MIC27, deriving from gene duplication.5 The I117 residue in human MIC26 protein corresponds to I127 in yeast Mic26 and is highly conserved in all phyla/classes of opisthokonta except protozoa (online supplementary figure S4B).
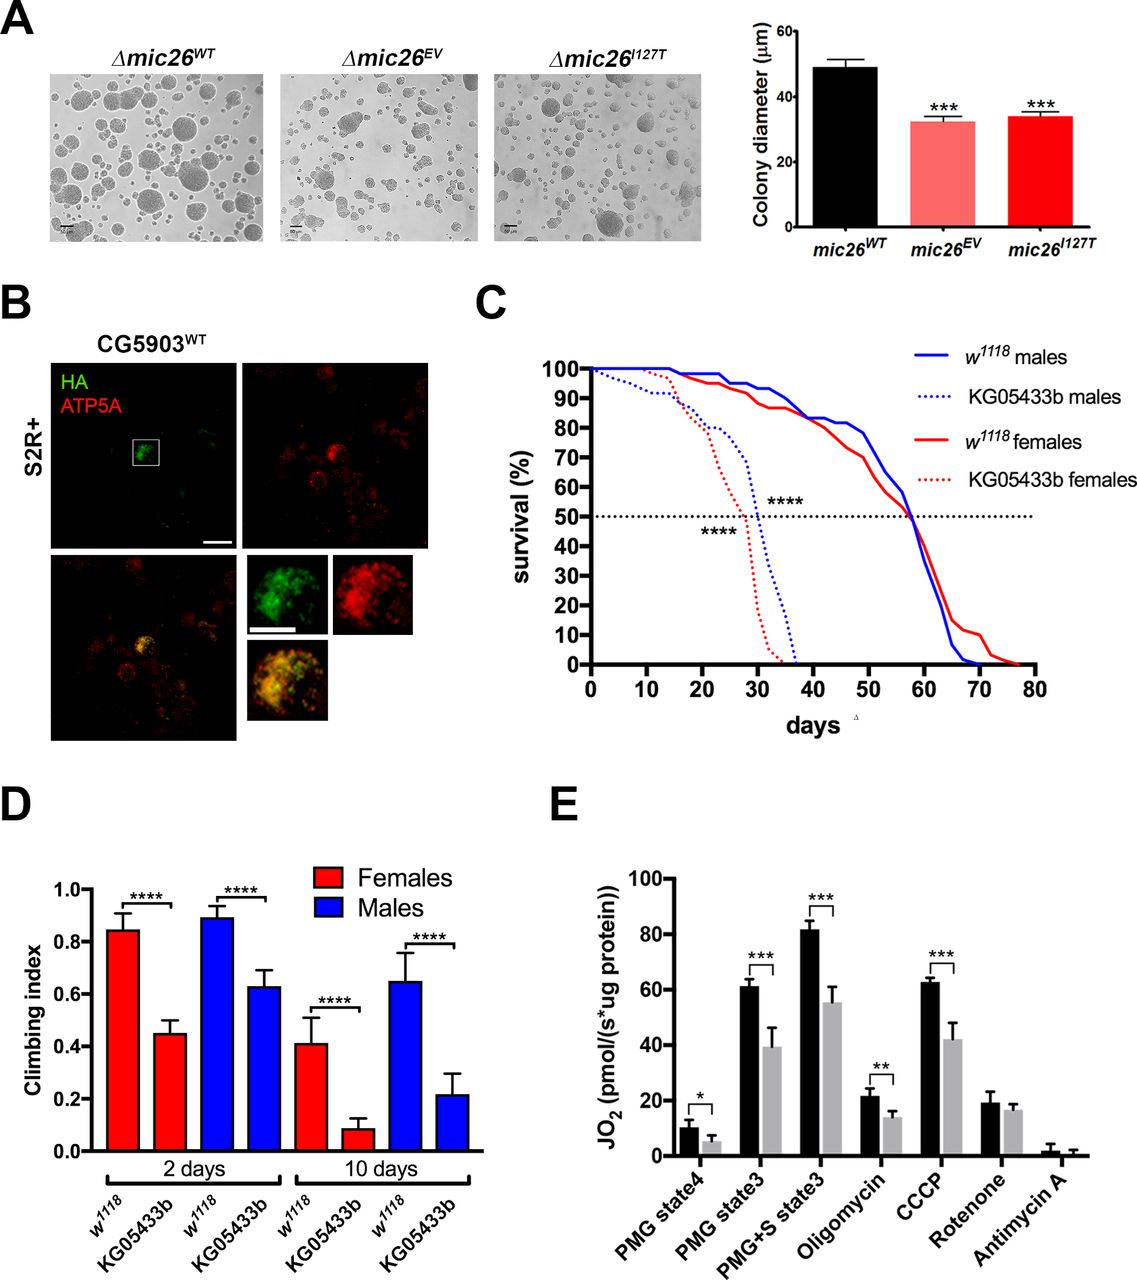
In yeast, MICOS complex seems not to be fundamental for the oxidative growth and for the respiratory activity, since deletion of genes encoding four subunits, including Mic19 and Mic12, which do not have paralogs, and Mic26 and Mic27, has a slight effect or no effects on oxidative growth.2 34 Despite the mild phenotypical defects of the Δmic26 strain, yeast can be used experimentally to evaluate whether the mutant allele is able or not to rescue the phenotype. To evaluate the effects of this mutation in vivo, the null strain (∆mic26) was transformed with a single copy vector harbouring MIC26WT or mic26I127T. The strains were spotted on different carbon sources (online supplementary figure S4A). The growth of the ∆mic26EV was slightly decreased compared with the rescue ∆mic26WT strain on the SC medium, with or without Na-lactate 2% when supplemented with ethanol 5%, the latter being used as a common means to induce stress. The growth difference between ∆mic26EV and ∆mic26WT strain was not visible from whole spots, but magnification of single colonies from SC medium supplemented with 5% ethanol after 3 days of growth and measurement of their diameter showed significantly smaller colonies in the ∆mic26EV strain (figure 5A). On the contrary, colonies from ∆mic26I127T strain showed a mean diameter which was not statistically significant from that of the ∆mic26EV strain (figure 5A), indicating that the mutant allele is not able to rescue the phenotype of the null strain at all.

Yeast ∆mic26 strain and dApoO KO in Drosophila melanogaster showing growth and survival deficiencies, respectively. (A) Cells grown for 3 days on SC supplemented with 5% ethanol (×100 magnification). Chart shows the mean±SEM (n=100) of the colonies’ diameter (one-way analysis of variance followed by Bonferroni’s test, ***p<0.001). Representative images of three biological replicates. (B) Representative confocal micrographs of Drosophila S2R+ cells transiently expressing CG5903-HA. Cells have been labelled with anti-Atp5a (red) and anti-HA (green) antibodies. (C) Climbing assay performed in w1118 (control) and dApoO KO flies. Chart shows mean±95% CI, n=60 animals (Kruskal-Wallis with Dunn’s multiple comparisons test, ****p<0.0001). (D) Survival curves of w1118 and dApoO KO flies. Statistical analysis was performed with log-rank (Mantel-Cox) test (****p<0.0001). (E) OCR measured in fly homogenates from w1118 and dApoO KO strains. State 3 mitochondrial respiration was stimulated, in the presence of ADP, by the addition of Proline, Malate and Glutamate (PMG, complex I-linked substrates) and pMg+succinate (PMG+S, complex I-linked plus complex II-linked substrates). LEAK-respiration was measured through the enzymatic inhibition of ATP synthase with oligomycin. Maximal respiration was achieved adding the uncoupler CCCP. Non-mitochondrial respiration was measured by inhibiting complex I (with rotenone) and complex III (with antimycin A). Data plotted represent mean±SD of four biological replicates, normalised by the protein concentration of the homogenates (unpaired t-test; *p<0.05, **p<0.01, ***p<0.001). dApoO, Drosophila melanogaster APOO ortholog; CCCP, carbonyl cyanide 3-chlorophenylhydrazone; OCR, oxygen consumption rate; SC, synthetic complete.
Fly model
Once proven that the mutant allele behaved like a null allele in yeast, we studied the effects on a D. melanogaster lacking the single APOO ortholog present in the fly genome (CG5903, hereafter named dApoO and dMic26 protein). dMic26 shares a sequence identity of 32% and 28% to MIC26 and MIC27, respectively (online supplementary figure S4C). Expression of the HA-tagged form of dMic26 in Drosophila S2R+ cells showed mitochondrial localisation (figure 5B).
To analyse the effects of dApoO deficiency in flies, we exploited a loss-of-function allele (KG05433b) containing a >11 000 bp-long P{SUPor-P} element within the open reading frame of the first exon of dApoO (online supplementary figure S4D). In homozygous flies, dApoO mRNA levels were severely reduced (online supplementary figure S4E). Crossing of heterozygous dApoO KO flies produced slightly altered Mendelian ratios in the progeny (online supplementary figure S4F), indicating a mild effect of the lack of dApoO during the developmental stages. Phenotypically, both male and female adult KO flies displayed age-related neuromotor dysfunction, with climbing indexes ranging between 53% and 70% of the control at 2 days and between 21% and 36% at 10 days posteclosion (figure 5C). In addition, KO of dApoO led to a significant shortening of life span, causing median survival rates between 39% (males) and 44% (females) of control flies (figure 5D). The observed behavioural defects are associated with mitochondrial dysfunction, as KO mitochondria showed severe decrease of both CI-linked and CII-linked respiration (figure 5E).
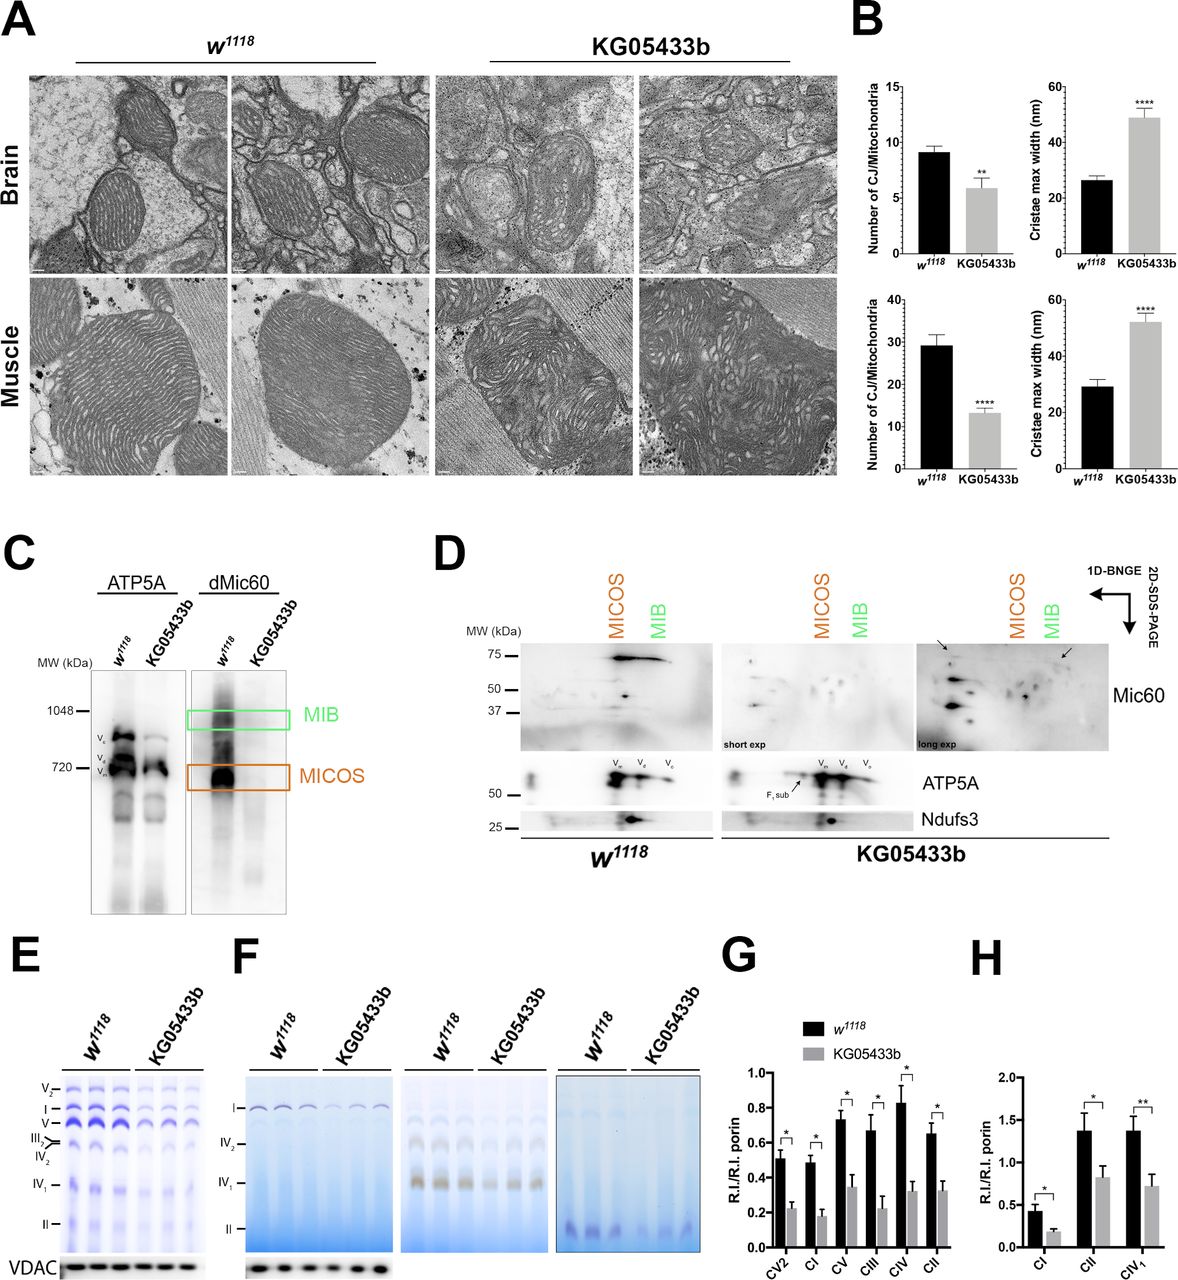
Next, we analysed cristae morphology in the KO flies via TEM of thoracic muscle and brain mitochondria (figure 6A). Similar to human mitochondria, the number of CJs were significantly decreased and the cristae were wider (figure 6B). Additionally, blue native gel electrophoresis (BNGE) analysis revealed a drastic alteration in the amounts and electrophoretic pattern of dMic60 in the MICOS complex. As shown in figure 6C, dMic60 was also found in two main complexes, MICOS (lower band) and MIB (upper band) in the controls, whereas the signal was barely detectable in dApoO KO and appeared at lower molecular weight spots (figure 6D).
dMic26 participate in the formation of cristae architecture via MICOS complex. (A) Representative TEM micrographs from Drosophila control (w1118) and dApoO KO brain and thorax muscles. Scale bars: 0.2 µm. (B) Charts show mean±SEM of the number of CJs per mitochondria and cristae maximum width in the brain and muscle (n=34 for w1118, n=40 for KG05433b from two biological replicates). Unpaired t-test shows significant differences for CJs/mitochondria: brain: **p=0.0039, muscle: ****p<0.0001; cristae max width: brain: ****p<0.0001, muscle: ****p<0.0001). (C) BN-PAGE showing the distribution of MIB and MICOS complex immunoblotted for dMic60 antibody in control (w1118) and dApoO KO (KG05433b) flies. Representative image of two biological replicates. (D) Second-dimension PAGE from BN immunoblotted for dMic60 antibody. Representative image of two biological replicates. (E) BN-PAGE and (F) IGA analysis of MRC complexes in control (w1118) and dApoO KO (KG05433b) flies densitometric quantification of the (G) BN-PAGE and (H) IGA bands normalised to the intensity of the mitochondrial outer membrane marker porin. Charts show mean±SD of three biological replicates (unpaired t-test; *p<0.05, **p<0.01). BN-PAGE, blue native polyacrylamide gel electrophoresis; CJ, cristae junction; IGA, in-gel activity; MIB, mitochondrial intermembrane bridging MICOS, mitochondrial contact site and organising system; TEM, transmission electron microscopy; MRC, mitochondrial respiratory chain; VDAC, voltage-dependent anion-selective channel protein.
Finally, the steady-state levels and enzymatic activities of the OXPHOS complexes I–V were considerably reduced in the dApoO KO flies (figure 6E–H), consistent with the observed respiratory deficiency.
Discussion
WES analysis of a family presenting a clinical phenotype compatible with mitochondrial disease identified a c.350T>C variant in APOO, following an X-linked recessive inheritance pattern with different range of clinical presentations and severity. In the case of the female carriers, X-chromosome inactivation skewing was shown to play an important role in the presentation of the phenotypes. This same effect was seen in other X-linked diseases like G6PD deficiency,35 Rett,36 Alport syndrome37 and Fabry disease.38 Although the inactivation of the X chromosome is entirely random, not all women have a 50:50 ratio of cells with one or the other X chromosomes active. This is visible in the proband’s mother, who presented skewed inactivation of the WT allele. Other females presented balanced inactivation of the X chromosome in blood, and are either healthy or presented symptoms. A number of complex mechanisms during early embryogenesis in the regulation of inactivation and distribution to different tissues can lead to extremely skewed ratios in certain tissues (mosaicism), resulting in expression of the mutated gene affecting certain tissues resulting in the X-linked recessive disorder phenotype in females.39
To our knowledge, this is the first description of a pathological variant in APOO, encoding MIC26, a component of the MICOS complex associated with a mitochondrial syndrome of variable severity within the same family. The clinical phenotypes of the mitochondrial diseases can be very variable, having different presentations and severity degrees, even with the same mutation.40 It could be that mutations in APOO are no different in this respect from other mitochondrial syndromes, which is further complicated by the fact of its X-linked inheritance and different X-inactivation patterns shown by the female members of the studied family. Null variants in MICOS13 (QIL1), encoding the only other direct MICOS component (MIC13) to date associated with mitochondrial disease, cause autosomal recessive oxidative phosphorylation deficiency type 37 (COXPD37, MIM: 618329) characterised by severe encephalopathy and liver disease, leading to death during early childhood.9–11 Similar to the APOO-mutated patient, even if the mitochondrial morphology was very affected in the patient fibroblasts, they did not show respiratory chain enzymatic deficiencies or altered respiration.9–11 In the QIL1 cases, however, combined enzymatic defects were revealed in postmitotic tissues (skeletal muscle and liver).9–11 All the patients were clinically more severe than the APOO cases reported here, and we should consider the fact that MIC13 is a central MICOS subunit and its absence affects the stability of MIC26, MIC27 and MIC10,9 10 whereas MIC26 is more of a peripherally associated MICOS component41 and its ortholog MIC27 is still present.8 Also, the APOO mutation reported here is a missense variant producing a protein that retains partial functionality, as opposed to the non-sense variants found in MICOS13. The I117T missense variant in MIC26 was associated with lower steady-state levels of the protein and an evident slower SDS-PAGE electrophoretic mobility of the mitochondrial 22 kDa band. Most proteins imported to the inner compartments of mitochondria contain an N-terminal mitochondrial targeting sequence (MTS) cleaved off by specific peptidases.42 Comparison of the size of the protein expressed in vivo in cultured cells with the size of the precursor, as well as in organello import experiments, indicated the presence of such a cleavable signal peptide in MIC26, which could not be consistently or accurately predicted by bioinformatic tools such as Mitoprot II43 or Mitofates.44 Our experiments clearly indicated that MIC26 undergoes a two-step processing, with the appearance of an intermediate and a mature form, when imported inside the mitochondria. This is not a unique case as several precursor proteins are processed twice, first by the matrix processing peptidase (MPP) and then by Icp55 (Intermediate cleaving peptidase) that removes a single amino acid or by Oct1 (octapeptidyl aminopeptidase) that removes an octapeptide.45 The size difference of the intermediate and the mature form is compatible with Oct1 processing after cleavage of the MTS by MPP. Interestingly, a major consequence of the p.I117T variant was the altered processing sites of MIC26 during its import inside mitochondria, since both the intermediate and mature forms of MIC26I117T showed evidently slower electrophoretic mobility than those from the WT protein. It is possible that the mutation could alter the conformation of the precursor and impair its correct processing. A similar situation has been described for mutations in frataxin, an iron chaperone located in the MM46 also cleaved in a two-step fashion, which impairs the interaction with MPP and results in slower processing rates of the mature form.47 48 Our conclusion is that the difference in apparent size of the mature shown by MIC26I117T compared with MIC26WT was due to altered processing by mitochondrial peptidases during the import process.
In addition, the mutation compromised the interaction of MIC26 with the IMM, as MIC26I117T was dissociated from the membranes more easily than MIC26WT after carbonate treatment. This is compatible with the fact that the I117 lies within the hydrophobic transmembrane domain between residues 108 and 118.8 MIC26 deficiency caused also an alteration in MICOS subunit distribution, shifting the balance between the MIB (bridging the IMM to the OMM) and the MICOS, located in the CJs.2 16 This altered pattern is most likely the cause of the aberrant IMM ultrastructure observed by TEM in the patient cells and the abnormal MIC60 spacing shown by super-resolution microscopy in patient fibroblasts and HeLa cells expressing MIC26I117T. These observations indicate that the MIC26I117T variant produces an aberrant oligomerisation of MIC60, which is critical to CJ formation,49 and consequently the altered localisation of the MICOS complex in relation to the CJs. However, the steady-state levels of the other MICOS components were not affected, which can again be explained by the fact that MIC26 is a peripheral component of MICOS41 or because its ortholog MIC278 is playing a compensatory role. The presence of Mic27 in yeast and its absence in D. melanogaster could explain why the MICOS and functional defects are much stronger in the dMic26 KO flies than in the S. cerevisiae Δmic26 strain.7 34 In any case, the Δmic26 yeast strain showed defective growth in metabolic stress conditions, which were not rescued by the mutated allele, confirming that I127T (I117T in the human protein) mutation affects the activity of the protein.
In conclusion, this is the first description of a pathogenic variant in APOO associated with mitochondrial disease due to MICOS complex impairment, showing X-linked recessive inheritance in a family with multiple affected individuals.
Supplemental data description
Supplemental data include the list of antibodies and primers used, supplementary methods and details about image acquisition.
Acknowledgments
We thank all the family members for their participation, the Department of Biochemistry in the Federal University of Parana (Brazil) for allowing us to use their tissue culture facility, the MRC-Laboratory of Molecular Biology Electron Microscopy Facility for access to their resources and the staff from the Hospital Pequeno Principe for the organisation of sample delivery and consultations. We are very grateful to Dr Xinnan Wang (Stanford University School of Medicine, USA) for providing the antibody against Drosophila Mic60.
References
Footnotes
Contributors CB performed most of the biochemical, cell biology and microscopy experiments. VZ performed most of the genetics and established patient fibroblast cultures and clinical characterisation of patients. MB performed all the animal model experiments. MJ performed most of the genetics, cloning, small interfering RNA and TnT experiments. AJR performed the exome analysis. DAdV and BAT performed the MRI and clinic characterisation of patients. AY performed the acquisition of TEM images. EF-V performed the in organello import experiments. EF-V and AR contributed with control fibroblasts. EF-V, AR and JP contributed with ideas for the experimental work. CB and MLSFS supervised the clinic characterisation and fibroblast preparation. RLRS and CB supervised the genetics experiments. VZ and RLRS were responsible for ethical approval. AJW supervised the animal model experiments. MZ and CB conceived the project and supervised the experimental workup. CB, MB, EF-V and MZ wrote the manuscript. All the authors contributed to the final version of the paper.
Funding This study was financed in by the Core Grants from the MRC (Grant MC_UU_00015/5 to MZ, and MC_UU_00015/6 to AJW), by NRTJ-Institut de France grant (to MZ) and by the Coordenação de Aperfeiçoamento de Pessoal de Nível Superior - Brasil (CAPES) (Finance Code 001 to CB). VZ was supported by a doctoral fellowship from CAPES (Brazil). MB was supported by a doctoral fellowship from the University of Padova (Padova, Italy) and an individual fellowship from 'Aldo Gini' Foundation (Padova, Italy).
Competing interests None declared.
Patient consent for publication Not required.
Ethics approval Informed consent was obtained from all participants in this study according to ethical standards committee of Federal University of Paraná (CAAE: 84773818.2.0000.0102).
Provenance and peer review Not commissioned; externally peer reviewed.
Data availability statement Data are available upon reasonable request.