Article Text

Abstract
Strabismus is a common condition, affecting 1%–4% of individuals. Isolated strabismus has been studied in families with Mendelian inheritance patterns. Despite the identification of multiple loci via linkage analyses, no specific genes have been identified from these studies. The current study is based on a seven-generation family with isolated strabismus inherited in an autosomal dominant manner. A total of 13 individuals from a common ancestor have been included for linkage analysis. Among these, nine are affected and four are unaffected. A single linkage signal has been identified at an 8.5 Mb region of chromosome 14q12 with a multipoint LOD (logarithm of the odds) score of 4.69. Disruption of this locus is known to cause FOXG1 syndrome (or congenital Rett syndrome; OMIM #613454 and *164874), in which 84% of affected individuals present with strabismus. With the incorporation of next-generation sequencing and in-depth bioinformatic analyses, a 4 bp non-coding deletion was prioritised as the top candidate for the observed strabismus phenotype. The deletion is predicted to disrupt regulation of FOXG1, which encodes a transcription factor of the Forkhead family. Suggestive of an autoregulation effect, the disrupted sequence matches the consensus FOXG1 and Forkhead family transcription factor binding site and has been observed in previous ChIP-seq studies to be bound by Foxg1 in early mouse brain development. Future study of this specific deletion may shed light on the regulation of FOXG1 expression and may enhance our understanding of the mechanisms contributing to strabismus and FOXG1 syndrome.
- genomics
- genetic linkage
- high-throughput nucleotide sequencing
Data availability statement
Data are available on reasonable request. The genome-wide sequencing data cannot be shared publicly because of privacy concern. The identifying variants are available from the corresponding authors on request and under an appropriate data handling agreement.
This is an open access article distributed in accordance with the Creative Commons Attribution Non Commercial (CC BY-NC 4.0) license, which permits others to distribute, remix, adapt, build upon this work non-commercially, and license their derivative works on different terms, provided the original work is properly cited, appropriate credit is given, any changes made indicated, and the use is non-commercial. See: http://creativecommons.org/licenses/by-nc/4.0/.
Statistics from Altmetric.com
Introduction
Strabismus, also known as crossed eyes or squint, affects 1%–4% of individuals. Diagnosis and treatments for strabismus are well established, but the pathophysiology for most isolated strabismus remains largely unknown. Disturbances anywhere along the visual sensory or the oculomotor pathways can be postulated to lead to eye deviation.1
As early as Hippocrates’ time, strabismus was recognised as a genetic disorder based on an observation of its tendency to cluster within families.2 During the last century, twin and family studies have demonstrated a substantial genetic contribution to strabismus, and both autosomal dominant and autosomal recessive transmission patterns have been reported.3 Recently, a genome-wide association study reported two variants with small effect sizes.4 Strabismus occurs commonly as one phenotype among many in syndromes, such as congenital Rett syndrome (FOXG1 syndrome) and Joubert syndrome, in which 84% and 75% of individuals display a strabismus phenotype, respectively.5 6 On the other hand, families displaying isolated strabismus transmitting in simple Mendelian patterns are uncommon. In a few such families, genetic loci on chromosomes 4, 6, 7, 12, 16 and 19 have been identified for isolated strabismus, but no causal gene has been identified in these regions.3 Not overlapping the reported loci, 11 genes ( PHOX2A , ROBO3, KIF21A, SALL1 , TUBB3, HOXB1 , SALL4 , CHN1, HOXA1 , TUBB2B, MAFB ),7 of which six encode transcription factors (underlined), have been identified for a subgroup of strabismus associated with congenital cranial dysinnervation disorders,7 but the genetic aetiology of other strabismus subtypes remains elusive. Identification of a locus with high confidence, determination of a causal gene and detailed mechanistic insights at the nucleotide level would provide new insights into the molecular mechanisms of certain forms of strabismus.
We compiled a large, seven-generation, non-consanguineous pedigree with 22 individuals exhibiting isolated strabismus, consistent with an autosomal dominant inheritance pattern. Through genome-wide linkage analysis of eight affected and four unaffected individuals from one branch and one affected individual from a separate branch, we mapped this familial strabismus to chromosome 14q12, which overlaps with the FOXG1 syndrome locus. Next-generation sequencing and in-depth analysis identified a strong candidate deletion variant within this locus. The data support that the deletion localises to a FOXG1 transcription factor binding site (TFBS), suggesting an autoregulatory loop may be disrupted that controls FOXG1 expression in early brain development.
Results
Pedigree and participant profile
A seven-generation pedigree of European origin, with 176 individuals, including those who were deceased, was compiled. Individuals were labelled as strabismic either through medical records or strong family anecdotes. A roughly even distribution of strabismus cases was observed between females (13 individuals) and males (9 individuals) and the disorder was transmitted both maternally and paternally. Among the three extensively traced branches (figure 1A), branch 1 was most well documented and contained most of the participants in this study. In branch 1, strabismus was reported across four consecutive generations. An autosomal dominant inheritance model with high penetrance best matched the qualitative observation.

Pedigree for the subject family with isolated strabismus. (A) The pedigree represents a seven-generation family with 176 individuals, including deceased individuals. Three major branches are identified: 12 study participants come from branch 1 and one (014) comes from branch 2. Individual 012 was not included in the linkage analysis. Black represents affected individuals, white represents unaffected individuals and grey represents obligate carriers. (B) Simplified branch 1 of the subject family showing the genotyped individuals (with study ID) and ancestors required to link them. Individual 014 represents branch 2, and all the other individuals come from branch 1. Individuals whose status was not confirmed clinically were coded as unknown for the linkage analysis. These individuals were indicated by blue outlines.
To characterise the strabismus in this family, eight of the nine affected descendants indicated in figure 1B were seen by one of three participating ophthalmologists specialised in strabismus. All individuals underwent complete ophthalmic examination with attention to ocular motility both before and after pharmacological cycloplegia. The specific characteristics of strabismus were not uniform across the descendants in the family (table 1). The strabismus phenotypes could be grouped into two broad directional categories: esotropia (an eye turns in) and hypertropia (an eye turns up). Both esotropia and hypertropia were noted in individual 014, but this individual had undergone multiple corrective surgeries and childhood medical records were not available. On the other hand, individuals 011, 013 and 009 are in consecutive generations and had no history of extraocular muscle surgery. Individual 011 presented with esotropia while the other two displayed hypertropia (009, 013). The unaffected status was confirmed by medical history provided by the participating family members. In the clinical ophthalmology examinations and in oral reports from subjects, there were no other phenotypes observed broadly in the individuals with strabismus.
Ophthalmological characteristics of strabismic participants in the subject family
Linkage analysis and haplotype analysis
Initial linkage analysis was performed with 12 family members; 8 affected and 4 unaffected individuals (excluding 012 and 014 from figure 1B). Simulations under the alternative hypothesis (linkage) generated a maximum LOD score of 3.56, under an autosomal dominant model with disease allele frequency q=0.005, 99% penetrance and 0.2% phenocopy rate. The LOD score curves did not change significantly across a range of disease allele frequency settings (results not shown).
With the same linkage analysis parameters as in the simulation, the largest LOD score based on the observed genotypes was 3.55, close to the simulated maximum. This chromosome 14 locus was the only region with a LOD score higher than 3, and exceeds the standard threshold for genome-wide significance of 3.3.8 This linked region spanned approximately 10 Mb and was bounded by rs7146411 and rs1951187, corresponding to chr14:22,779,843–32,908,192 (hg19). Chromosome 14q12 is therefore a novel locus for isolated strabismus.
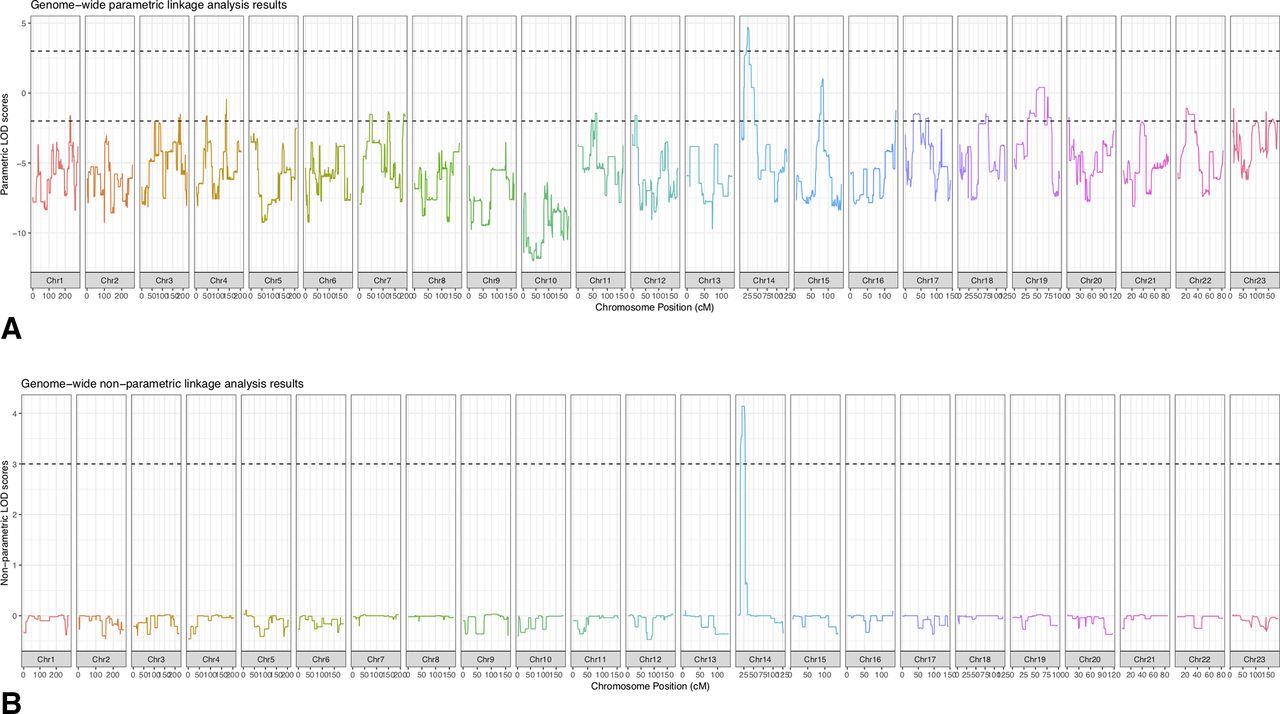
Individual 014 representing branch 2 in the pedigree was recruited to the study after the genome-wide genotyping was performed. An expanded linkage analysis with corresponding SNPs extracted from 014’s whole genome sequencing (WGS) data further supported the linkage to chromosome 14. Simulations under the alternative hypothesis (linkage) generated a maximum LOD score of 4.69 for the same region, under an autosomal dominant model with disease allele frequency q=0.005, 99% penetrance and 0.2% phenocopy rate. We observed a LOD score of 4.69, and the region remained as the sole candidate (figure 2A). In addition, we performed non-parametric linkage analyses and identified the same linkage region (figure 2B).

Linkage analysis for subject family. (A) Parametric analysis. An expanded linkage analysis was performed in all 13 individuals who shared the common ancestor. We observed a LOD score of 4.69 for the linkage region in chromosome 14. The top dashed line indicates a LOD of 3 and the bottom dashed line indicates a LOD of −2. (B) Non-parametric analysis. We performed non-parametric analyses and obtained the same linkage region on chromosome 14. The dashed line indicates a LOD of 3.
Haplotype analysis was used to complement linkage analysis by providing visual confirmation of the statistical testing. An approximately 8.5 Mb region (chr14:22,779,843–31,289,720) was shared between the nine affected descendants of the common ancestor. An unaffected descendant (005, subsequently deceased) shared a 5.5 Mb region within the linked region (figure 3A,B). Thus, an approximately 3 Mb region was shared exclusively by nine affected descendants, corresponding to chr14:28,467,136–31,289,720. The LOD score was above 4.60 for chr14:28,467,136–30,045,978 (online supplemental figure 1). The 3 Mb region situates within a gene poor region (figure 3B).
Supplemental material

Linkage region. (A) Haplotype analysis for subject family. Each row represents an individual, and each column represents a marker used in the linkage analysis. The markers displayed span chr14:22,779,843–31,289,720 (~8.5 Mb) shared between nine affected individuals. In addition to the nine affected, an unaffected individual is included who shares a 5.5 Mb portion of the region. Thus, an approximately 3 Mb region was shared exclusively by 9 affected descendants, corresponding to chr14:28,467,136–31,289,720 (hg19). Yellow indicates the haplotype inherited from the common ancestor. Each of the other colours indicates a different haplotype from a different ancestor. The 8.5 Mb region and the core shared ~3 Mb region are indicated. For clarity, unaffected individuals not sharing a portion of the region with those affected are not displayed. (B) Genes across the linkage region. The genes reported in the UCSC gene track from the UCSC Genome Browser are displayed for the linkage region. The ~8.5 Mb region and the core ~3 Mb region are indicated. The core ~3 Mb region lies within a gene-poor region.
No impactful coding variant in the 10 Mb locus identified through WES and WGS
Whole exome sequencing (WES) showed that two affected third-degree cousins (001 and 011) shared 119 heterozygous non-synonymous variants across the entire exome. A subset of 60 variants among the 119 had a frequency lower than 1% in an in-house database of a rare-disease-WES project.9 Only one of the variants (chr14:31,061,628 A>G, rs145527124) was located within the 10 Mb locus, falling within exon 5 of G2E3 (G2/M-phase specific E3 ubiquitin protein ligase) (NM_017769.4).
This variant leads to Ile113Val alteration in ENST00000206595. In gnomAD V.2.1.1 European (non-Finnish) population, there are two homozygotes for this variant and the overall allele frequency is 0.17% and two homozygotes while gnomAD V.3 has an overall allele frequency of 0.15% and another homozygote.10 In addition, in the 1000 Genomes project,11 the allele frequency in Punjabi from Lahore, Pakistan (PJL) is 1.6%. This G2E3 variant was not supported as a candidate by computational analysis (predicted to be ‘tolerated’ with SIFT12 and ‘benign’ with Polyphen13). Qualitative review of the literature did not suggest a potential role for G2E3 in a strabismus phenotype.
The lack of candidate variants from WES motivated the generation of WGS for individuals 001, 013 and 014, who were selected to represent two sub-branches of branch 1 and branch 2 of the pedigree. The only coding variant detected with a frequency of ≤1% in the 10 Mb region was the aforementioned G2E3 variant.
WGS and bioinformatics analyses highlight a heterozygous non-coding variant in a regulatory region of FOXG1
Our analyses showed that the WGS on 001, 013 and 014 did not capture some low complexity regions, raising concern that the protocol used at the time of generation might fail to detect repetitive sequences and small genomic structural alterations. As current WGS protocols could better detect such properties, we generated WGS for an affected parent–child trio (011, 012 and 013). For simplicity, we report variants from the trio WGS set for comprehensiveness in the following sections.
Within the 3 Mb region, a total of 664 variants were shared by both affected individuals (based on a dominant model of transmission). No CNVs were detected. We focused on variants with a frequency ≤1% and which have been reported in fewer than 10 homozygotes in gnomAD V.2.0, criteria met by 24 of the 664 variants. The only coding variant of these 24 was the G2E3 coding variant reported previously. (These potentially identifying variants are available from the corresponding authors on request and under an appropriate data handling agreement.)
As 23 of 24 candidate variants prioritised in the WGS analysis were non-coding, we used diverse methods to annotate non-coding variants with regulatory information. There is no standard practice to annotate non-coding variants, so we used a variety of approaches to identify those within potential regulatory elements. One variant was noted recurrently using a variety of bioinformatic predictions. Among the 23 candidate variants, only chr14:29247628 TAAAC >T (online supplemental figure 2) has been assigned a CADD score over 2014 and is ~10 kb 3′ from FOXG1. This variant is situated within a potential regulatory region, as suggested by the presence of DNase-seq peaks and the histone marks H3K4me1, H3K4me2, H3K4me3, H3K9ac and H3K27ac, which are associated with promoters/enhancers.15 This deletion was absent in gnomAD V.2.1.1 and V.3 and dbSNP build 152 and 153.16 This deletion was confirmed through Sanger sequencing to be present in all nine affected subjects and none of the unaffected individuals.
Since the upper limit of the reported prevalence of strabismus is 4%, additional variants with frequency >1% and ≤4% in gnomAD were also obtained for examination. A total of 54 additional variants were identified in the candidate region. However, none of these variants situated on protein coding regions or were assigned a CADD score over 20.
We examined topologically associating domains (TADs) for the 3 Mb region (figure 4) to suggest potential regulatory relationships between identified variants and nearby genes. The top candidate variant was located within the same TAD as FOXG1, and hereafter this TAD will be referred to as the FOXG1-TAD. Both FOXG1 and the sequence surrounding the candidate variant are highly conserved across vertebrates, with the candidate sequence retained from fish to humans (figure 5).
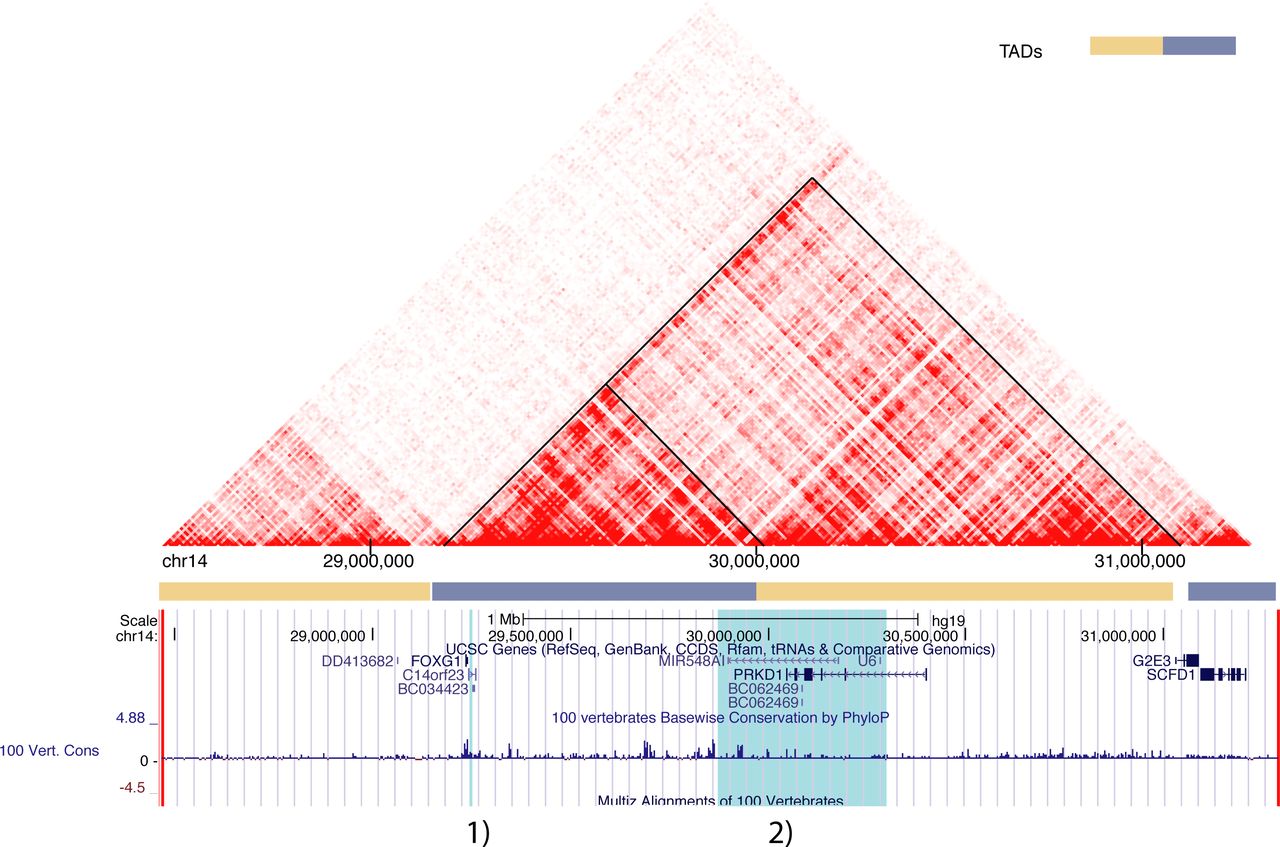
Topologically associating domains within the 3 Mb core region. This heatmap illustrates the chromatin interaction based on Hi-C data.42 The deeper the red colour, the stronger the intra-chromosomal interaction between corresponding segments of the DNA. FOXG1-TADs are indicated by the black triangle shapes. The blue highlights from left to right correspond to the putative regulatory region within the FOXG1-TAD: (1) chr14:29,247,628 TAAAC >T; (2) the SRO (smallest region of deletion overlap) regulation region affecting FOXG1 expression.22

Ultra-conservation regions. (1) FOXG1; (2) the 4 bp deleted region.
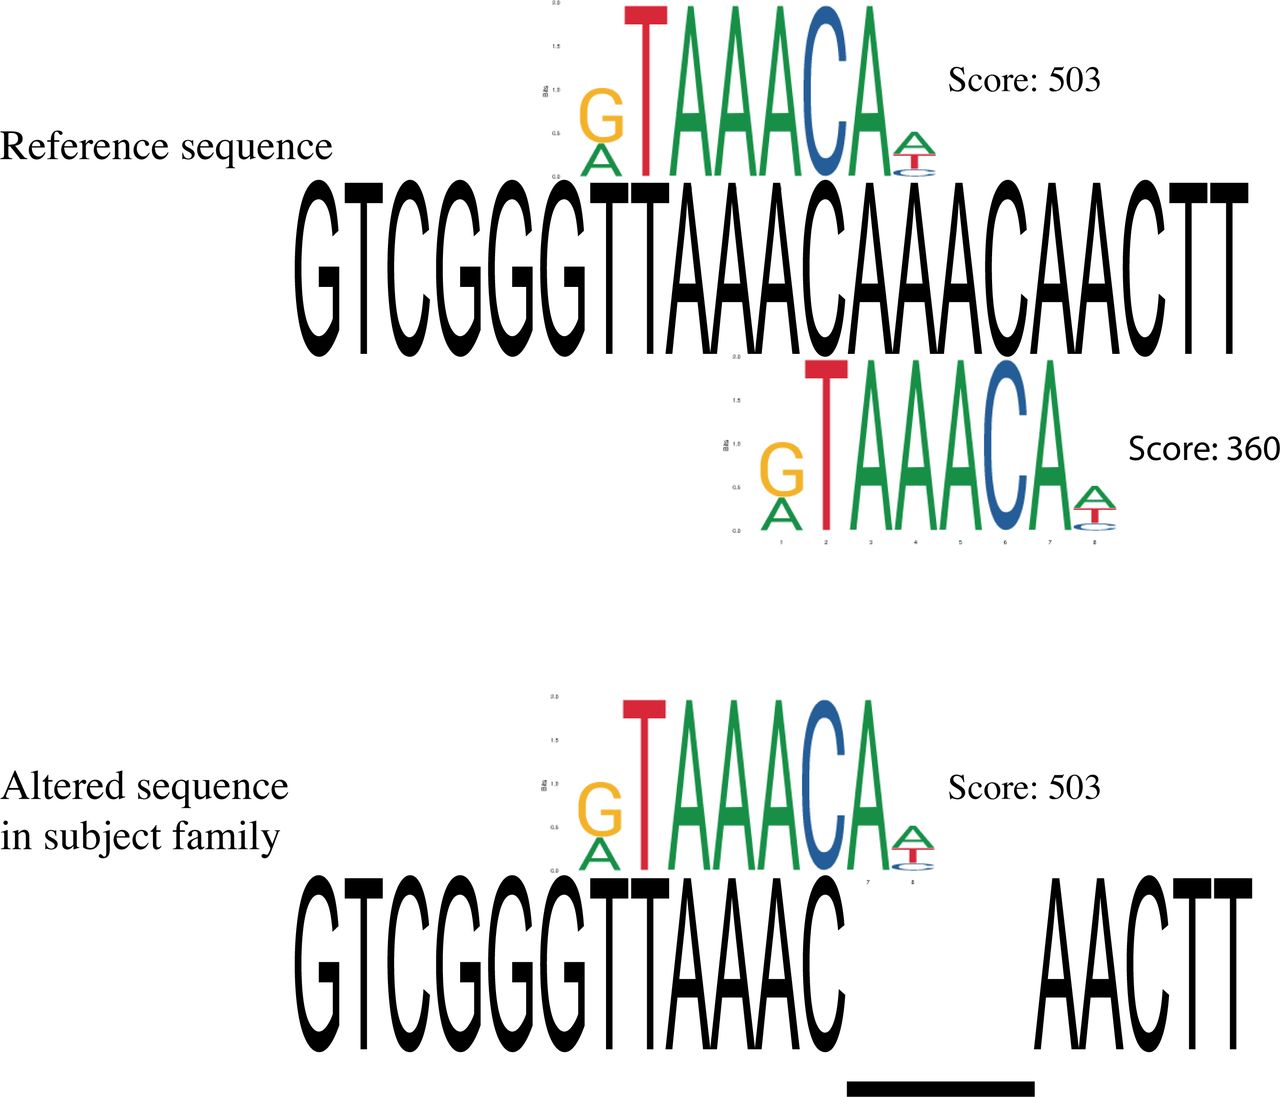
In human genome annotations, the variant chr14:29247628 TAAAC >T was located within an alternative exon of a long non-coding RNA gene (LINC01551). Within the mouse, chicken and zebrafish annotation and supporting data, there were no RNA transcripts containing the variant.17 As the variant position is conserved back to fish, and the transcript evidence is not supportive of transcription of the highly conserved region in other species, we considered whether the variant might be situated within a cis-regulatory region. We examined predicted transcription factor binding motifs overlapping the deletion and observed a match to Forkhead transcription factor binding sites, including JASPAR profile matches for FOXC1, FOXI1 and FOXG1 (figure 6). Proteins in the evolutionarily conserved superfamily of the Forkhead transcription factors share the presence of a DNA binding domain and a transactivation or transrepression effector region, and play a central role during development as well as in the adult.18 The binding motif for both FOXC1 and FOXI1 profiles would be obliterated by the deletion. Due to two consecutive AAAC repeats, the FOXG1 binding motif is present twice in the reference sequence, with one copy remaining after the deletion. Publicly available mouse ChIP-seq data (GSE96070) showed that Foxg1 binds to this site in cortex tissue from E14–15 brain.19 Thus, it appears that the deletion is situated within a Forkhead TF binding site, in a highly conserved region with conservation patterns consistent with a functional role in the cis-regulation of FOXG1.

FOXG1 transcription factor binding site matching to reference and alternative sequence. Two FOXG1 TFBS are identified in reference sequence with scores of 503 and 360, respectively. Only one FOXG1 TFBS is identified in sequence with the 4 bp deletion. Scores are based on PWMScan with ‘JASPAR CORE 2018 vertebrates’ library (Ambrosini G., PWMTools, http://ccg.vital-it.ch/pwmtools).
Discussion
We identified a new locus for isolated strabismus in a family, and this locus overlapped with the locus for FOXG1 syndrome, which has a high prevalence of strabismus. This finding suggests that the strabismus phenotype within FOXG1 syndrome may represent an independent disruptive mechanism from the other phenotypes. We recognised the limitation of the available clinical data from eight individuals, of whom five have a history of strabismus surgery. The nature of the surgery was unknown and since they were studied at different ages, the effect of prolonged adaptation to incomitance would have affected the strabismus at the time of examination, potentially masking the initial pathology. The interpretation of the phenotypic diversity should be re-evaluated if additional information becomes available. In-depth phenotyping of individuals without strabismus surgery illustrated clinical heterogeneity of strabismus within the family. This suggests that while a specific molecular lesion may lead to strabismus, the specific clinical type is determined by other factors. We examined both coding and non-coding variants, which led to identification of a potential strabismus causing sequence alteration of a Forkhead TFBS within the FOXG1-TAD, suggesting disruption of cis-regulation.
To the best of our knowledge, our report contains the largest isolated strabismus pedigree in the literature with the highest LOD score. A LOD score of 4.69 was obtained for a single linkage peak on chromosome 14. Moreover, the segregation of the disease in this family is consistent with autosomal dominant inheritance. A 3 Mb haplotype was shared by all affected participants and was absent from unaffected participants.
In this family, the strabismus types were not uniform. The clinical presentation in the majority of patients at the time of examination did not adhere to a classical neurological pattern, such as cranial nerve IV palsy. The various types of strabismus, however, appear to be caused by the same genetic factor since the linked haplotype is shared by all strabismic individuals. Our observation of strabismus variability in the subject family, review of the literature20 21 and personal communication with other research groups suggests the current strabismus classification scheme is unhelpful for genetic studies: existing strabismus classification systems may inappropriately be separating individuals sharing a common underlying genetic cause and thus weaken study power. This may explain the paucity of studies detecting and confirming strabismus loci in the literature.3
This 3 Mb region overlaps with microdeletions/microduplications known to cause FOXG1 syndrome in which a high prevalence of strabismus is observed. FOXG1 syndrome, which is also known as congenital Rett syndrome, is a neurological disorder characterised by impaired development and structural brain abnormalities. Strikingly, 84% of affected individuals display strabismus.5 Distal microdeletions that disrupt the topologically associating domains can lead to FOXG1 syndrome while FOXG1 remains intact, indicating that mis-regulation of FOXG1 can cause phenotypic change.22 Due to the close proximity and shared TAD with FOXG1, the 4 bp deletion is speculated to alter FOXG1 expression (figure 4). A spectrum of partially overlapping phenotypes have been reported in patients with FOXG1 syndrome.5 The separability of the strabismus phenotype from intellectual disability and other severe disabling phenotypes therefore represents an important insight.
Close examination of diverse data provided important insights into the potential regulatory impact of the 4 bp deletion. First, the sequences surrounding the deletion are highly conserved in the genomes of vertebrates, suggesting that it is under evolutionary selection and that a change may be more likely to have a functional impact. Indeed, the sequence containing the deletion and the coding region of FOXG1 were the only two highly conserved elements in a 180 kb neighbourhood (figure 5). In addition, this conserved sequence was not supported as being part of a long non-coding RNA in other species (eg, mouse, chicken, frog), implying a cis-regulatory effect. Second, the conserved sequence disrupted by the deletion was predicted to be a TFBS for Forkhead transcription factors, including FOXG1, according to the binding site profiles from JASPAR.23 Third, Foxg1 ChIP-seq data from E14–15 mouse brain (GSE96070) showed that Foxg1 bound to this sequence.
The binding of Foxg1 to this sequence in mouse provides the basis for the hypothesis of disrupted FOXG1 autoregulation leading to strabismus in the subject family. The proposed autoregulatory model is illustrated in figure 7. FOXG1 is transcribed and translated, the transcription factor binds to the target sequence, helping to maintain the appropriate expression of FOXG1 during critical developmental period. The disruption of the FOXG1 binding site leads to dysregulation of FOXG1 expression in a highly specific developmental context that results in the isolated strabismus phenotype.

Cis-regulatory mechanism within FOXG1-TAD. (1) 4 bp deletion chr14:29,247,628 TAAAC >T; (2) the SRO (smallest region of deletion overlap) regulation region affecting FOXG1 expression.22
Autoregulation for key developmental transcription factors in vision is not new to the field. The SIMO regulatory sequence controlling expression of the PAX6 transcription factor gene is an example of such a distal autoregulatory element.24 While Pax6 is a crucial transcription factor for delineating the dorsal forebrain in mouse E10.0, Foxg1 is a critical transcription factor for delineating the ventral forebrain in mouse E9.0.25 Thus, they may share similar sensitivity to regulatory disruption.
FOXG1 expression is strongest in fetal brain and its dysregulation leads to unbalanced development of excitatory and inhibitory synapses in iPSC-derived neurons and in mice.26 In combination with other transcription factors, Foxg1 in pyramidal neurons is crucial for establishing cortical layers and axon trajectory of callosal projection neurons. Moreover, some Foxg1-directed processes are more vulnerable to dosage changes than others.27 These observations suggest that Foxg1 has a dosage-sensitive and time-sensitive role in different brain structures. This implies that an alteration in Foxg1 expression pattern can have a very specific impact, and the specific phenotype can be separable from the rest.
In summary, we identified a 3 Mb region on chromosome 14 that is linked to autosomal dominant transmission of isolated strabismus. The region contains FOXG1, which has been previously associated with strabismus in 84% of patients with syndromic disruptions. Within the 3 Mb region, the top candidate variant is situated within a FOXG1 transcription factor binding motif, suggesting that disrupted autoregulation could be the mechanism underlying the observed strabismus phenotype. As the causal functional alteration remains to be proven, additional studies will be required to identify other families with genetic forms of strabismus mapping to the locus and to conclusively prove the causal sequence alteration and its pathophysiological mechanism.
Materials and methods
Patient ascertainment
A seven-generation pedigree was constructed based on family records, including photos displaying eye alignment. Thirteen participants were descendants of a common ancestor; nine of them reported early-onset isolated strabismus, and the other four reported no strabismus. The common ancestor was reported to be of European origin.
Except for 006, the other eight affected descendants were examined by one or more of three ophthalmologists (Drs J Horton, VP and CL). All participants were asked about the age of onset (if applicable), ocular history and medical history. Examination included visual acuity, pupil observation, eye movements, ocular alignment, stereopsis, slit-lamp examination, fundus examination and intraocular pressure. Individuals 009, 011 and 013 did not have a history of extraocular muscle surgery and therefore underwent full orthoptic examinations. Subjects were asked about other medical or physical characteristics, with no reports spanning beyond immediate nuclear family members.
DNA isolation
Genomic DNA of participants was isolated from either saliva or blood. At least 4 mL blood samples or 6 mL saliva samples were collected for one round of next-generation sequencing, and at least a 2 mL saliva sample was collected from participants for array genotyping. Blood samples were collected in a clinical setting while saliva samples were collected using Oragene-DNA (OG-500) saliva kits. DNA was extracted from blood samples using the Qiagen QIAsymphony SP instrument and the QIAsymphony DNA Midi Kit and from saliva samples with DNA Genotek prepIT-L2P sample preparation kit following protocol no. PD-PR-015. Approximately 7–10 µg DNA per sample at a concentration no less than 70 ng/µL was sent for sequencing. A 500 ng DNA per sample at a concentration of at least 50 ng/µL was sent for array genotyping.
Genotyping: statistical linkage analysis and haplotype analysis
Genotyping was performed by The Centre for Applied Genomics, The Hospital for Sick Children, Toronto, Canada. The assay was performed on HumanOmni2.5–8 v1_C, using the Infinium LCG assay (Illumina). Standard quality control steps were performed on the genotypes, including sex check, call rate, autosomal heterozygosity and verification of the pedigree structure. Simulations were performed to determine the maximum possible LOD (logarithm of the odds) score for different model parameters under the alternative hypothesis (linkage). SLINK 3.0228 was used to simulate pedigrees under dominant and recessive models with a range of disease allele frequencies and penetrance. For a particular model, the maximum LOD score from the analysis of 1000 simulated pedigrees was declared the maximum LOD score.
Multiple filters were applied to select a set of markers suitable for linkage analysis. Only markers with alleles unambiguous for strand information on the autosomes and X chromosomes were kept. Genotype data from HapMap3 European populations29 were used to estimate marker allele frequencies, and a minor allele frequency >0.45 and pairwise r2 <0.1 were selected. A set of 17 779 SNPs was obtained after a SNP filtering step. Merlin V.1.1.230 was used to perform multipoint linkage analysis under the same model as in the SLINK simulation. Analysis of the X chromosome was performed within Merlin using the standard procedures.30
As individual 014 was recruited at a later time point, we extracted SNPs from WGS data. We then used the combined SNP genotypes for linkage analysis on the family and performed genome-wide parametric and non-parametric linkage analyses using Merlin V.1.1.2. To refine the boundaries of the linked region, we examined the SNPs from both edges (rs714641 and rs1951187) manually between descendants and identified the minimum shared haplotype region.
Whole-exome sequencing
We performed WES on 001 and 011, affected third cousins. WES was performed via the Agilent SureSelect Human All Exon 38 Mb kit and Illumina HiSEQ 2000 platform (performed by Perkin Elmer) with an average coverage of 27X. The genomic aligners, Bowtie (V.0.12.9) and BWA (V.0.6.1), were used to map the paired-end reads to the hg19 reference genome.31 32 The Genome Analysis Toolkit (GATK) (V.1.0) performed local re-alignment, which allowed for correcting misalignment at the extremity of reads.33 SAMtools (V.0.1.18) was applied to call variants from aligned WES reads.34 In-house scripts were used to filter variants according to the following criteria: under an autosomal dominant model, with a frequency not higher than 1% in dbSNP build 135, non-synonymous coding variants, and predicted by SIFT12 to be ‘damaging’ or indeterminate.
Whole-genome sequencing
Two rounds of WGS were conducted as the project progressed. WGS was first performed on 001, 013 and 014, who were three distantly related affected cousins, on an Illumina HiSEQ 2000 platform (BGI America) generating paired-end reads of 125 bp and average coverage of 37X. An informatics pipeline (similar to the WES pipeline, but with newer versions of software) was applied to this set of WGS data: Bowtie (V.1.0.0) and BWA (V.0.7.5a) for mapping the paired-end reads to the hg19 reference genome,31 32 GATK (V.2.8) for local re-alignment33 and SAMtools (V.0.1.19) for variant calling.34
Variants located within the linkage region were selected for further analysis. Allele frequency was assessed using dbSNP build 137 and Exome Variant Server (http://evs.gs.washington.edu/EVS/) and variants with a frequency higher than 1% were excluded. Heterozygous variants shared across the three samples were selected, and SnpEff35 (with hg19 database) was applied to annotate those variants.
Later, in order to obtain PCR-free results suitable for analysis of short tandem repeats, WGS was performed on 011, 012 and 013, a trio, on an Illumina NovaSeq platform (Macrogen) with an average coverage of 45X. A different informatic pipeline was applied to this set of WGS data: BWA mem (V.0.7.12) for mapping the paired-end reads to the GRCh37 reference (http://www.bcgsc.ca/downloads/genomes/9606/hg19/1000genomes/bwa_ind/genome/), SAMtools (V.1.2) for file format conversion, duplicate marking with Picard (V.1.139), GATK for local re-alignment (V.3.4–46) and GATK HaplotypeCaller for variant calling (V.3.4–46). Variants were soft filtered using BCFTools (V.1.8) keeping variants with at least 10 reads supporting the alternate allele and a maximum depth of 300. Filtered variants were then annotated and normalised using SnpEff (V.4.11; gene version GRCh37.75), VT (V.0.5772) and VCFAnno (V.0.2.8).36 Filtered, annotated variants are then converted into a GEMINI database (V.0.19.1)37 using VCF2DB (https://github.com/quinlan-lab/vcf2db). Specific GEMINI queries were performed for variants under the autosomal dominant model, with details below. Scripts for processing the data, and details regarding databases annotated against using VCFAnno and CNV analyses can be found online (https://github.com/Phillip-a-richmond/AnnotateVariants/tree/master/Strabismus).38
Variants under the autosomal dominant model (shared between 011 and 013) located within the linkage region were selected for further investigation. Reflecting the upper end of reported strabismus population frequency, all variants with allele frequency <4% were manually reviewed. However, it is expected that dominant transmission of isolated strabismus is a rare event, and therefore the results reported in this manuscript pertain to those variants with allele frequency <1% and <10 homozygous individuals for the minor allele in gnomAD V.2.0.10 Candidate rare variants within the region were then assigned to gene and then manually examined for potential molecular impact of the gene by database searches of tissue expression patterns and previously published data.
Non-coding variant annotation and interpretation
To enable analysis of non-coding variants, we used multiple databases and corresponding bioinformatic tools to annotate such variants, including functional annotation of the mammalian genome 5 (FANTOM5) database,39 JASPAR,23 Segway,40 RegulomeDB41 and Combined Annotation Dependent Depletion (CADD).14 Data related to the candidate variants were visualised in the UCSC Genome Browser. The 100 Vertebrates Basewise Conservation PhyloP track was used for examining the conservation status. Due to the incomplete annotation of non-coding RNAs across different species, Emsembl BLAST/BLAT was used to find potential orthologs in other vertebrates, and RefSeq genes and ESTs were considered as evidence for RNA transcripts.17 Based on the qualitative assessment, the top prioritised variant was confirmed to be present by Sanger sequencing in all of the affected subjects and absent from unaffected subjects.
Summary
Eye misalignment, or strabismus, can affect up to 4% of individuals. When strabismus is detected early, intervention in young children based on eye patching and/or corrective lenses can be beneficial. In some cases, corrective surgeries are used to align the eyes, with many individuals requiring multiple surgeries over a lifetime. A better understanding of the causes of strabismus may lead to earlier detection as well as improved treatment options. Hippocrates observed that strabismus runs in families over 2400 years ago, an early recognition of what we now recognise as a portion of cases arising from genetic causes. We describe a large family affected by strabismus and identify a single region on chromosome 14 that may be responsible. The region contains FOXG1, in which mutations are known to cause a severe neurodevelopmental syndrome, with 84% of affected individuals also having strabismus. We identify a 4 bp deletion in the region that appears to autoregulate when FOXG1 is active. Future study of this genetic alteration may enhance our understanding of the mechanisms of strabismus.
Data availability statement
Data are available on reasonable request. The genome-wide sequencing data cannot be shared publicly because of privacy concern. The identifying variants are available from the corresponding authors on request and under an appropriate data handling agreement.
Ethics statements
Patient consent for publication
Ethics approval
The study was approved by the University of British Columbia Children’s & Women’s Research Ethics Board (approval number CW10-0317/H10-03215), and written consent forms were obtained from all participants.
Acknowledgments
We thank Dr Jonathan C Horton (University of California San Francisco) for generously offering his time to examine multiple participants in his clinic. We thank Care4Rare (Dr. Kym Boycott, PI, Children’s Hospital of Eastern Ontario ResearchInstitute, University of Ottawa) for support of the linkage analysis, and recognize that authors NMR and ADPparticipated as members of the Care4Rare project. We thank Ms Dora Pak for research management support.
References
Supplementary materials
Supplementary Data
This web only file has been produced by the BMJ Publishing Group from an electronic file supplied by the author(s) and has not been edited for content.
Footnotes
Twitter @ofornes
Contributors XCY: substantial contributions to the conception and design of the work, the acquisition, analysis and interpretation of data. Drafting the work and revising it critically for important intellectual content. NMR, ADP (collaborated through Care4Rare Canada); PR, CS, OF, XH, MH, CJR: substantial contributions to analysis and interpretation of data. Revising the work critically for important intellectual content. CJL, VP: substantial contributions to the acquisition, analysis and interpretation of data. Revising the work critically for important intellectual content. DG, CG-E: substantial contributions to the conception of the work. Revising the work critically for important intellectual content. MSP, WWW: substantial contributions to the conception and design of the work. Drafting the work and revising it critically for important intellectual content. All the listed authors: final approval of the version published. Agreement to be accountable for all aspects of the work in ensuring that questions related to the accuracy or integrity of any part of the work are appropriately investigated and resolved.
Funding Funding for XCY is provided by a Frederick Banting and Charles Best Canada Graduate Scholarship (GSD-146285) from the Canadian Institutes of Health Research, BCCHRI-CIHR-UBC MD/PhD Studentship, and NSERC Discovery Grant (RGPIN-355532-10, RGPIN-2017-06824). The SNP genotyping was performed under the Care4Rare Canada Consortium funded by Genome Canada and the Ontario Genomics Institute (OGI-147), the Canadian Institutes of Health Research, Ontario Research Fund, Genome Alberta, Genome British Columbia, Genome Quebec, and Children’s Hospital of Eastern Ontario Foundation. CJR is supported by a Michael Smith Foundation for Health Research Scholar Award.
Competing interests None declared.
Provenance and peer review Not commissioned; externally peer reviewed.
Supplemental material This content has been supplied by the author(s). It has not been vetted by BMJ Publishing Group Limited (BMJ) and may not have been peer-reviewed. Any opinions or recommendations discussed are solely those of the author(s) and are not endorsed by BMJ. BMJ disclaims all liability and responsibility arising from any reliance placed on the content. Where the content includes any translated material, BMJ does not warrant the accuracy and reliability of the translations (including but not limited to local regulations, clinical guidelines, terminology, drug names and drug dosages), and is not responsible for any error and/or omissions arising from translation and adaptation or otherwise.