Article Text

Abstract
Background: The cohesin complex plays an essential role in genome organisation and cell division. A full complement of the cohesin complex and its regulators is important for normal development, since heterozygous mutations in genes encoding these components can be sufficient to produce a disease phenotype. The implication that genes encoding the cohesin subunits or cohesin regulators must be tightly controlled and resistant to variability in expression has not yet been formally tested.
Methods: Here, we identify spatial-regulatory connections with potential to regulate expression of cohesin loci (Mitotic: SMC1A, SMC3, STAG1, STAG2, RAD21/RAD21-AS; Meiotic: SMC1B, STAG3, REC8, RAD21L1), cohesin-ring support genes (NIPBL, MAU2, WAPL, PDS5A, PDS5B) and CTCF, including linking their expression to that of other genes. We searched the genome-wide association studies (GWAS) catalogue for SNPs mapped or attributed to cohesin genes by GWAS (GWAS-attributed) and the GTEx catalogue for SNPs mapped to cohesin genes by cis-regulatory variants in one or more of 44 tissues across the human body (expression quantitative trail locus-attributed).
Results: Connections that centre on the cohesin ring subunits provide evidence of coordinated regulation that has little tolerance for perturbation. We used the CoDeS3D SNP-gene attribution methodology to identify transcriptional changes across a set of genes coregulated with the cohesin loci that include biological pathways such as extracellular matrix production and proteasome-mediated protein degradation. Remarkably, many of the genes that are coregulated with cohesin loci are themselves intolerant to loss-of-function.
Conclusions: The results highlight the importance of robust regulation of cohesin genes and implicate novel pathways that may be important in the human cohesinopathy disorders.
- molecular biology
- genetic association studies
- human genetics
- genetic predisposition to disease
- gene expression regulation
Data availability statement
Data are available in a public, open access repository. All data relevant to the study are included in the article or uploaded as supplementary information. All raw data used for this paper is available from publically available datasets, with appropriate URLs and citations placed in the relevant methods sections in the manuscript.
This is an open access article distributed in accordance with the Creative Commons Attribution Non Commercial (CC BY-NC 4.0) license, which permits others to distribute, remix, adapt, build upon this work non-commercially, and license their derivative works on different terms, provided the original work is properly cited, appropriate credit is given, any changes made indicated, and the use is non-commercial. See: http://creativecommons.org/licenses/by-nc/4.0/.
Statistics from Altmetric.com
- molecular biology
- genetic association studies
- human genetics
- genetic predisposition to disease
- gene expression regulation
Introduction
The cohesin complex has multiple essential roles during cell division in mitosis and meiosis, genome organisation, DNA damage repair and gene expression.1 Mutations in genes that encode members of the cohesin complex, or its regulators, cause developmental diseases known as the ‘cohesinopathies’ when present in the germline2 or contribute to the development of cancer in somatic cells.3–5
Remarkably, cohesin mutations are almost always heterozygous and result in depletion of the amount of functional cohesin without eliminating it altogether. Complete loss of cohesin is not tolerated in healthy individuals.2 Thus, cohesin is haploinsufficient such that normal tissue development and homeostasis requires that the concentrations of cohesin and its regulatory factors remain tightly regulated.
The human mitotic cohesin ring contains four integral subunits: two structural maintenance proteins (SMC1A, SMC3), one stromalin HEAT-repeat domain subunit (STAG1 or STAG2) and one kleisin subunit (RAD21).6 Genes encoding cohesin subunits are mutated in a wide range of cancers. Cohesin mutations are especially prevalent in acute myeloid leukaemia.7–9 Notably, STAG2 is 1 of just 12 genes mutated in four or more cancers,5 particularly in bladder cancer, Ewing sarcoma, glioblastoma and myeloid malignancies.10
In meiotic cohesin, SMC1A is replaced by SMC1B; STAG1/2 by STAG3 and RAD21 by REC8 or RAD21L1.1 Mutations in meiotic cohesin subunits are associated with infertility in men,11 chromosome segregation errors and primary ovarian insufficiency in women.12
Cohesin is loaded onto DNA by the SCC2/SCC4 complex (encoded by the NIPBL and MAU2 genes, respectively).1 Mutations in the cohesin loading factor NIPBL are associated with >65% cases of Cornelia de Lange syndrome (CdLS). Remarkably, features associated with CdLS are observed with less than 30% depletion in NIPBL protein levels.13
The release of cohesin from DNA is achieved by WAPL, which opens up the interface connecting the SMC3 and RAD21 subunits. The PDS5A/PDS5B cohesin associated subunits affect this process by contacting cohesin to either maintain (with STAG1 and STAG2) or remove (with WAPL) the ring from DNA.1
Spatial organisation and compaction of chromosomes in the nucleus involves non-random folding of DNA on different scales. The genome is segregated into active A compartments and inactive B compartments,14 inside which further organisation occurs into topologically associating domains (TADs) interspersed with genomic regions with fewer interactions.14 Cohesin participates in genome organisation by mediating ‘loop extrusion’ of DNA to form loops that anchor TAD boundaries. At TAD boundaries, cohesin colocalises with the CCCTC binding factor (CTCF) to form chromatin loops between convergent CTCF binding sites. Fine-scale genomic interactions include chromatin loops that mediate promoter-enhancer contacts. Notably, the time-specific and tissue-specific formation of the fine-scale loops also requires cohesin.15–17
The spatial organisation of the genome is particularly dynamic and susceptible to disruption during development. For example, changes to TAD boundaries are associated with developmental disorders.18 Furthermore, disruption of TAD boundaries by cohesin knockdown can lead to ectopic enhancer-promoter interactions that result in changes in gene expression.19 Rewiring of the patterns of course and fine-scale chromatin interactions also contributes to cancer development,20–22 including the generation of oncogenic chromosomal translocations.23 24
Disease-associated genome-wide association study (GWAS) variants in non-coding DNA likely act through spatially organised hubs of regulatory control elements, each component of which contributes a small amount to the observed phenotype(s), as predicted by the omnigenic hypothesis.25 26 Non-coding mutations at cohesin and cohesin-associated factors were found by GWAS (GWAS-attributed variants) to track with multiple phenotypes.27 However, the impact of genetic variants located within cohesin and its associated genes has not yet been investigated with respect to phenotype development.
We hypothesised that cohesin-associated pathologies can be affected by subtle, combinatorial changes in the regulation of cohesin genes caused by common genetic variants within control elements. Here, we link the 3D structure of the genome with expression quantitative trail locus (eQTL) data to determine if GWAS variants attributed to cohesin genes affect their transcription. We test cohesin gene-associated GWAS variants for regulatory connections beyond the cohesin genes (gene enrichment and regulatory hubs). We also identify all variants within each gene locus that had a previously determined cis-eQTL (GTEx catalogue) to the cohesin gene (eQTL-attributed variant list). As with the GWAS variants, we tested these variants for the presence of spatial-regulatory relationships involving genes outside of the locus. Only a few of these eQTL-attributed variants are currently implicated in disease pathways, but their regulatory relationships with cohesin suggest that they may be significant for cohesinopathy disorders.
Results
140 genetic variants with regulatory potential are associated with cohesin loci
Mitotic cohesin genes (SMC1A, SMC3, STAG1, STAG2 and RAD21), meiotic cohesin genes (SMC1B, STAG3, REC8 and RAD21L1), cohesin support genes (WAPL, NIPBL, PDS5A, PDS5B and MAU2) and CTCF were investigated to determine if they contain non-coding genetic variants (SNPs) that make contact in 3D with genes and therefore could directly affect gene expression (GWAS-attributed and eQTL-attributed; table 1, online supplementary table S1).
Supplemental material
Number of variants in the eQTL-attributed and GWAS-attributed lists
A total of 106 GWAS-attributed genetic variants associated with disease were identified (methods) that mapped to a cohesin gene (49 GWAS; 50 SNPs) or cohesin-associated (49 GWAS; 56 SNPs) gene (online supplementary table S1). Twelve SNPs (blue, online supplementary table S1) are not listed in the current GTEx SNP dictionary (GTEx v8), while 14 SNPs have virtually no variation in the GTEx per-tissue analysis (ie, minor allele frequency (MAF)<0.05; green, online supplementary table S1) and so were discarded. A total of 80 SNPs passed all filters and were subsequently analysed using CoDeS3D25 (GWAS-attributed list; table 1).
Within the GTEx catalogue, 187 eQTL-attributed variants associate with regulation of the cohesin gene set (online supplementary table S1). These variants associate with modified expression levels of cohesin genes in otherwise healthy individuals. Fifty-five of these variants had a MAF <0.05 (green, online supplementary table S1) and were filtered out of the eQTL-attributed set prior to CoDeS3D analysis (132 variants passed MAF filter; eQTL-attributed; table 1). Only three variants were shared between the GWAS-attributed and eQTL-attributed variant lists, resulting in a total of 290 cohesin-associated variants (GWAS-attributed and eQTL-attributed combined; table 1), but only 209 variants pass all filters (GWAS-attributed and eQTL-attributed combined; black, online supplementary table S1).
CoDeS3D integrates data on the three-dimensional organisation of the genome (captured by Hi-C) and transcriptome (eQTL) associations across multiple tissue types (online supplementary tables S2 and S3). We used the CoDeS3D algorithm to assign the 209 variants to hubs of regulatory/functional impacts by examining their potential to regulate other genes. Of the 209 variants, 4 had zero significant eQTLs, leaving 205 variants with significant eQTLs (128 eQTL-attributed, 80 GWAS-attributed and 3 overlaps; online supplementary tables S2 and S3). However, many of the 205 variants were not attributed the GWAS-attributed or eQTL-attributed cohesin gene in the locus. Of the 205 variants with eQTLs, 106/187 (56.7%) eQTL-attributed variants and 37/106 (34.9%) GWAS-attributed variants had a physical (Hi-C detected) connection and significant eQTL with their attributed cohesin gene (140 total, 3 overlaps; table 1).
Supplemental material
Strikingly, most of the 106 variants attributed by GWAS studies to cohesin genes were not confirmed by spatial connection, with only 35% being cis-eQTLs for the attributed cohesin gene (37 of 106, 34.9%). After the CoDeS3D analysis, six of the cohesin genes have no GWAS-attributed SNPs with a regulatory connection (STAG2, NIPBL, CTCF, SMC3, REC8 and RAD21-AS1). Therefore, the majority of GWAS variants tested in proximity to cohesin loci have regulatory effects elsewhere in the genome. Remarkably, despite five SNPs being attributed to NIPBL by GWAS, none of these were attributed to regulation of NIPBL by our spatial eQTL analysis. Of the cohesin or cohesin-associated genes with any GWAS-attributed variants with cis-eQTLS (RAD21, RAD21L1, SMC1A, SMC1B, STAG1, STAG3, MAU2, PDS5A, PDS5B and WAPL), only the STAG1, MAU2 and PDS5B loci contain more than two variants with confirmed cis-eQTLs. Therefore, even those loci with confirmed variant-gene GWAS attributions have very few variants with evidence of cis-eQTLs.
To further characterise the potential for the 209 cohesin-associated variants to alter gene regulation, we analysed histone marks, DNAse accessibility and protein binding motifs (Haploreg V.4.1) at each location (online supplementary table S4).28 Most variants reside within accessible chromatin (DNAse: 61.3%) and almost all (93.1%) have at least one of three histone marks that are consistent with putative regulatory activity (promoter, 82.8%; enhancer, 45.1%; protein binding sites, 86.8%). Intriguingly, Haploreg motif prediction identified 16 of the 209 variants (seven different loci: MAU2, PDS5B, REC8, SMC1B, STAG3, RAD21L1, STAG1) as residing within protein binding domains associated with cohesin-related DNA interactions (ie, RAD21, SMC3 and CTCF). Therefore, most of the variants lie in regions associated with chromatin marks that highlight putative regulatory capabilities.
CoDeS3D predicted 140 out of 209 variants to have significant regulatory activity. We compared this to alternative functional variant prediction methods. The DeepSEA algorithm, which predicts the chromatin effects of sequence alterations by analysing the epigenetic state of a sequence, identified 28 of 209 the variants as having functional significance (<0.05, online supplementary table S5). PredictSNP2, which estimates non-coding variant classification (deleterious or neutral) from five separate prediction tools (CADD, DANN, FAT, FUN, GWAVA tools), identified 9 of 209 variants as deleterious (online supplementary table S6). Therefore, only 31/209 variants have putative functional significance predicted by these tools (28 DeepSEA, 9 PredictSNP, 6 overlaps). Therefore, these 31 variants have support from multiple methods, suggesting a potential for higher regulatory effects and that the contrast with the Haploreg chromatin marks and GTEx measured eQTLs possibly indicates a heavy weighting against false positives in these prediction methods.
In summary, GWAS-attributed SNPs are enriched for chromatin marks (regulatory potential). However, fewer than half the SNPs in proximity to the cohesin and cohesin-associated genes physically connected with the cohesin genes they are predicted to regulate, suggesting that cohesin genes are not the direct targets of these regulatory variants.
Pathway enrichment implicates coordinated regulation of cohesin with essential cell cycle genes
CoDeS3D identified 140 variants as being physically connected to and associated with the expression levels of 310 genes (243 genes from eQTL-attributed variants, 141 from GWAS-attributed variants and 74 overlap) across 6795 significant tissue-specific regulatory connections (FDR p<0.05). Physical connections comprised 6570 fine-scale connections (cis, <1 Mb from the variant), 42 coarse-scale connections (trans-intrachromosomal, >1 Mb) and 183 connections on a different chromosome (trans-interchromosomal) (figure 1; online supplementary tables S2 and S3). Of note, there is one cohesin-to-cohesin regulatory connection: rs111444407, a GWAS-associated variant (bipolar disorder) located within the MAU2 locus has a significant trans-interchromosomal eQTL with REC8. The gene overlaps between the GWAS-attributed and eQTL-attributed analyses are also intriguing. For example, variants in the GWAS-attributed and eQTL-attributed lists, each from a different chromosomal location (REC8 and PDS5B) modify TCF7L1 expression. As TCF7L1 is part of the Wnt pathway and is highly expressed in ovaries in the GTEx catalogue, it is notable that this gene is regulated from variants in the REC8 locus (meiosis-specific cohesin). Their coregulatory relationships exemplify the systems of genome-regulatory hubs, with a total 74 genes overlapping the GWAS-attributed and eQTL-attributed analyses.
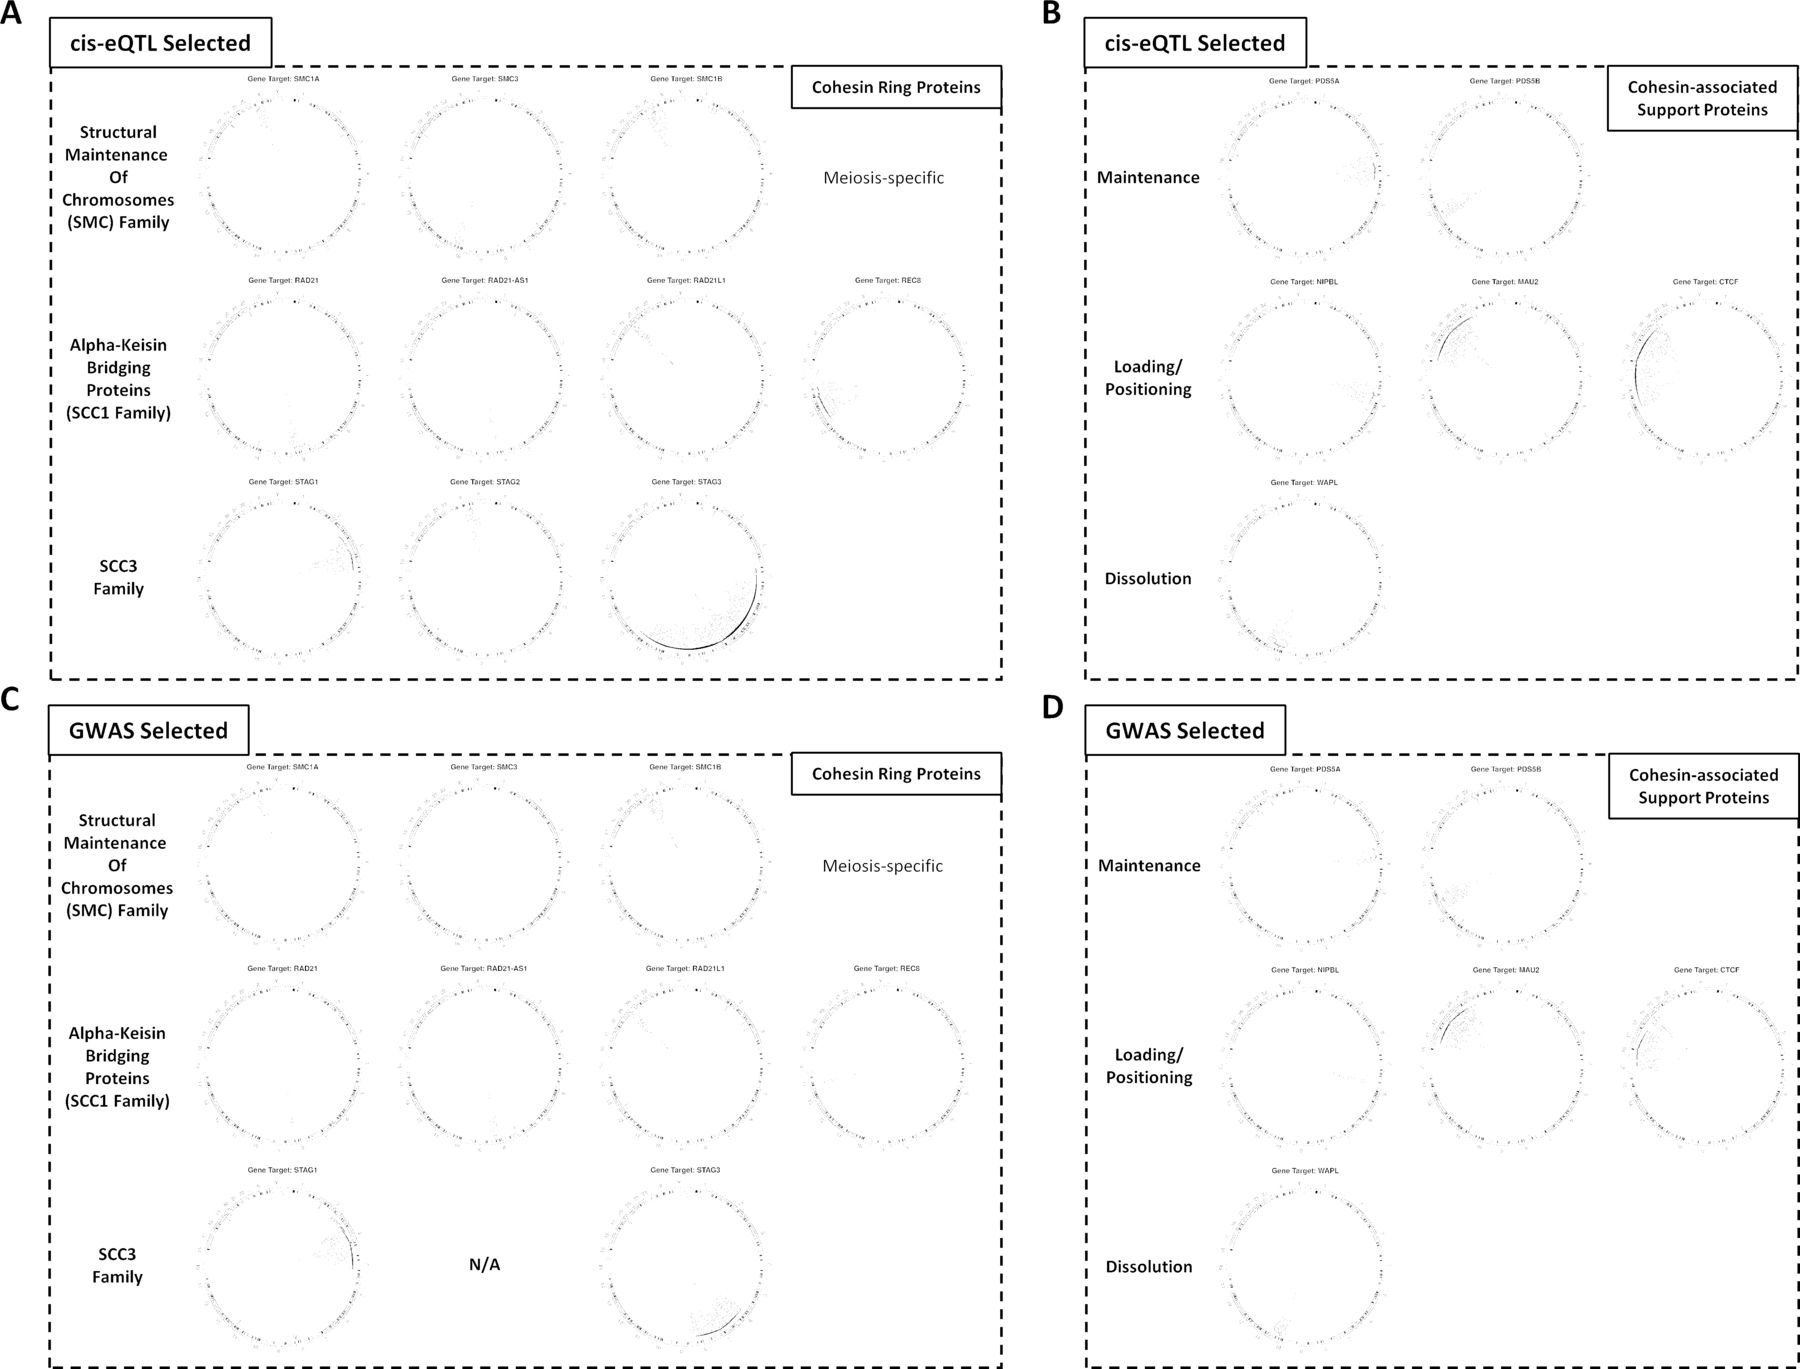
Circos plots highlighting the eQTL-attributed and GWAS-attributed variant locations and their long-distance gene connections Each cohesin gene has a unique set of regulatory connections across each attributed variant set (for all connections, see online supplementary tables S2 and S3). eQTL, expression quantitative trail locus; GWAS, genome-wide association studies.
The 31 significant variants highlighted by the DeepSEA and PredictSNP2 analyses functionally connected to 107 (34.5%) of the genes identified by CoDeS3D. Thus, while DeepSEA and PredictSNP2 assigned functionality to just 31/205 SNPs (15.1%), these variants represent 34.5% of the CoDeS3D-predicted modulatory connections. Therefore, DeepSEA and PredictSNP2 successfully selected for variants with highly enriched regulatory functions.
We used g:Profiler to assess the functional enrichment of the GWAS-attributed and eQTL-attributed genes (online supplementary table S7). The 310 genes are enriched for pathways that support cohesin function, as we currently understand it, within the nucleus. For example, functional enrichment in sister chromatid gene ontology categories includes five non-cohesin genes from our analysis: CTNNB1, PPP2R1A, CHMP4A, CUL3 and DIS3L2. Moreover, cohesin’s meiosis-specific role (SMC1B, STAG3, REC8) is enriched by two trans connections revealing regulation of meiosis-related genes (ITPR2, PPP2R1A; Kyoto Encyclopedia of Genes and Genomes (KEGG) pathway hsa04114). Collectively, these results suggest that expression of cohesin genes is coordinated with other genes that are involved in cell cycle control.
Meiosis-specific cohesin genes are functionally connected to KIF6 and a germ cell pathway
There are 108 genes functionally connected to variants within the meiosis-specific cohesin loci SMC1B, STAG3, REC8 and RAD21L1 (online supplementary table S8a). We identified 14 significant enrichment terms using g:Profiler (online supplementary table S8b), including the gene ontology ‘male germ cell nucleus’ pathway. The gene ontology ‘male germ cell nucleus’ pathway contains KIF6, STAG3 and REC8 (trans-interchromosomal connection from STAG3 locus to KIF6). Within GTEx, KIF6 is highly expressed in brain and testis. The KIF6 gene region was previously identified as significantly associated with a GWAS of hypospadias, a birth defect presenting with a urethral opening located on the ventral side of the penis instead of at the tip of the glans. Of particular relevance to the cohesinopathies, in which affected individuals present with cognitive defects, a mutation in human KIF6 caused neurodevelopmental defects and intellectual disability.29 Variation in KIF6 expression has been associated with epilepsy,30 another notable cohesinopathy phenotype.31 It has also been proposed that KIF6 is a conserved regulator of neurological development.29 Previous findings of an association between KIF6 and heart disease are not supported by GTEx (KIF6 is lowly expressed in GTEx heart tissue) and KIF6 knockout mice have no heart phenotype,32 suggesting that the heart-associated KIF6 variants might somehow affect the expression or function of other genes.
We also identified an enrichment for E2F7 transcription factor binding sites within our genes (online supplementary table S8b). The E2F7 transcription factor modulates embryonic development and cell cycle,33 34 with a role in cancer development.35 Of note, the E2F7 gene is loss-of-function intolerant (pLI=0.993), consistent with its crucial role in the cell cycle and development.
Collectively, our results suggest that the 301 genes are enriched for cell cycle-regulated genes, including E2F targets, and that these genes might be indirect targets of cancer drug treatments modifying E2F7 transcription factor activity.
The cohesin gene regulatory network is intolerant to loss-of-function mutations
A subset of human genes, whose activity is crucial to survival, are intolerant to loss-of-function (LoF-intolerant) mutations.36 The gnomAD catalogue lists 19 704 genes: 3063 LoF-intolerant, 16 134 LoF-tolerant and 507 undetermined (15.5% LoF-intolerance, defined as pLI ≥ 0.9).36 All cohesin and cohesin-associated genes (except the meiosis-only RAD21L1, SMC1B, STAG3 and REC8) are LoF-intolerant (table 2).
pLI of cohesin genes shows mutation intolerance
We hypothesised that genes functionally connecting to variants in cohesin genes would also be enriched for pLI. Consistent with our hypothesis, 79 of the 310 genes (25.4%) we identified are LoF-intolerant (185 are LoF tolerant and 46 have undetermined pLI; online supplementary table S9). Stratification of the eQTL genes based on the distance between the variant and gene (cis-acting versus trans-acting eQTL gene lists) identified a marked increase in LoF-intolerance for genes regulated by trans-acting eQTLs (figure 2; online supplementary figure S1).This was especially pronounced for regulatory interactions that occurred between chromosomes (figure 2; online supplementary figure S1). There was a significant correlation between distance and pLI on the same chromosome (r=−0.03, p<0.05).
Supplemental material
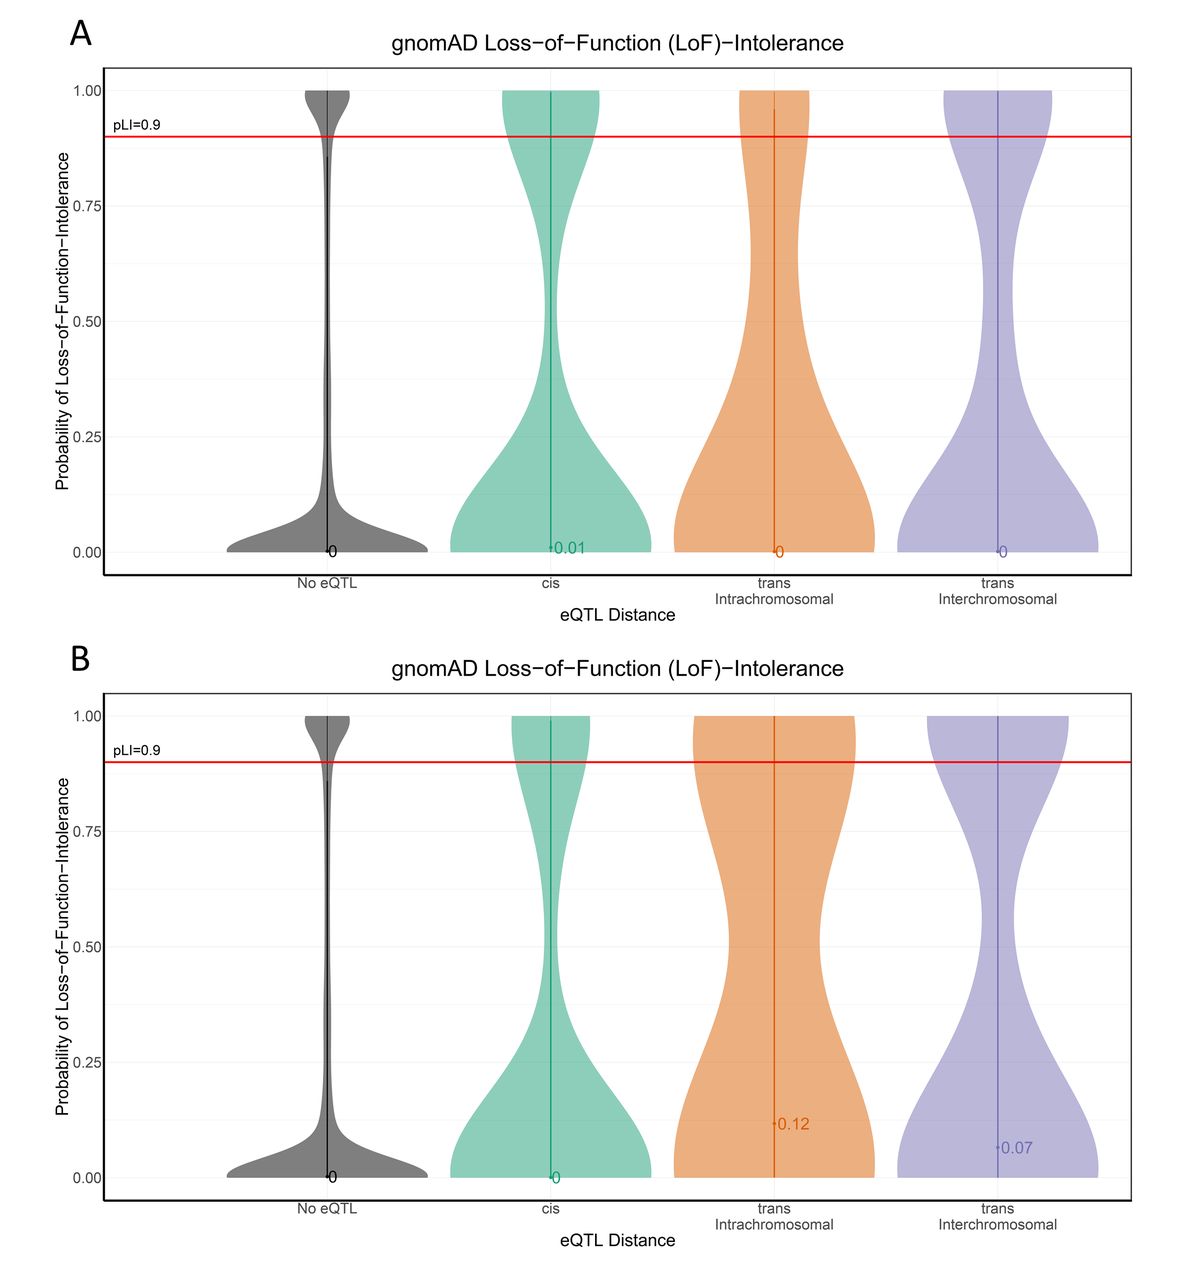
pLI shows enrichment for variant-gene eQTL distance Violin plots (and median pLI value) of pLI across the (A) eQTL-attributed and (B) GWAS-attributed gene sets shows the changing distributions of pLI, which is increased in genes further away (trans) versus those genes in background (no eQTL) or nearby (cis). eQTL, expression quantitative trail locus; GWAS, genome-wide association studies; pLI, loss-of-function intolerance.
To test for how these results compare to those for other genes, we performed a bootstrapping of 10 000 iterations of 310 random genes from the GTEx gene catalogue, calculating the pLI for each gene. We then compared the proportion of selected genes with pLI >0.9 in each of these 10 000 iterations versus the pLI proportion of the 310 cohesin-associated genes (online supplementary figure S2). Only 1 of the 10 000 bootstrapped samples had a proportion of genes with a pLI equal to or greater than the proportion of intolerant pLI observed in our 310 gene set. This evidence confirms that the genes identified connecting to cohesin loci are specifically resistant to expression changes.
Supplemental material
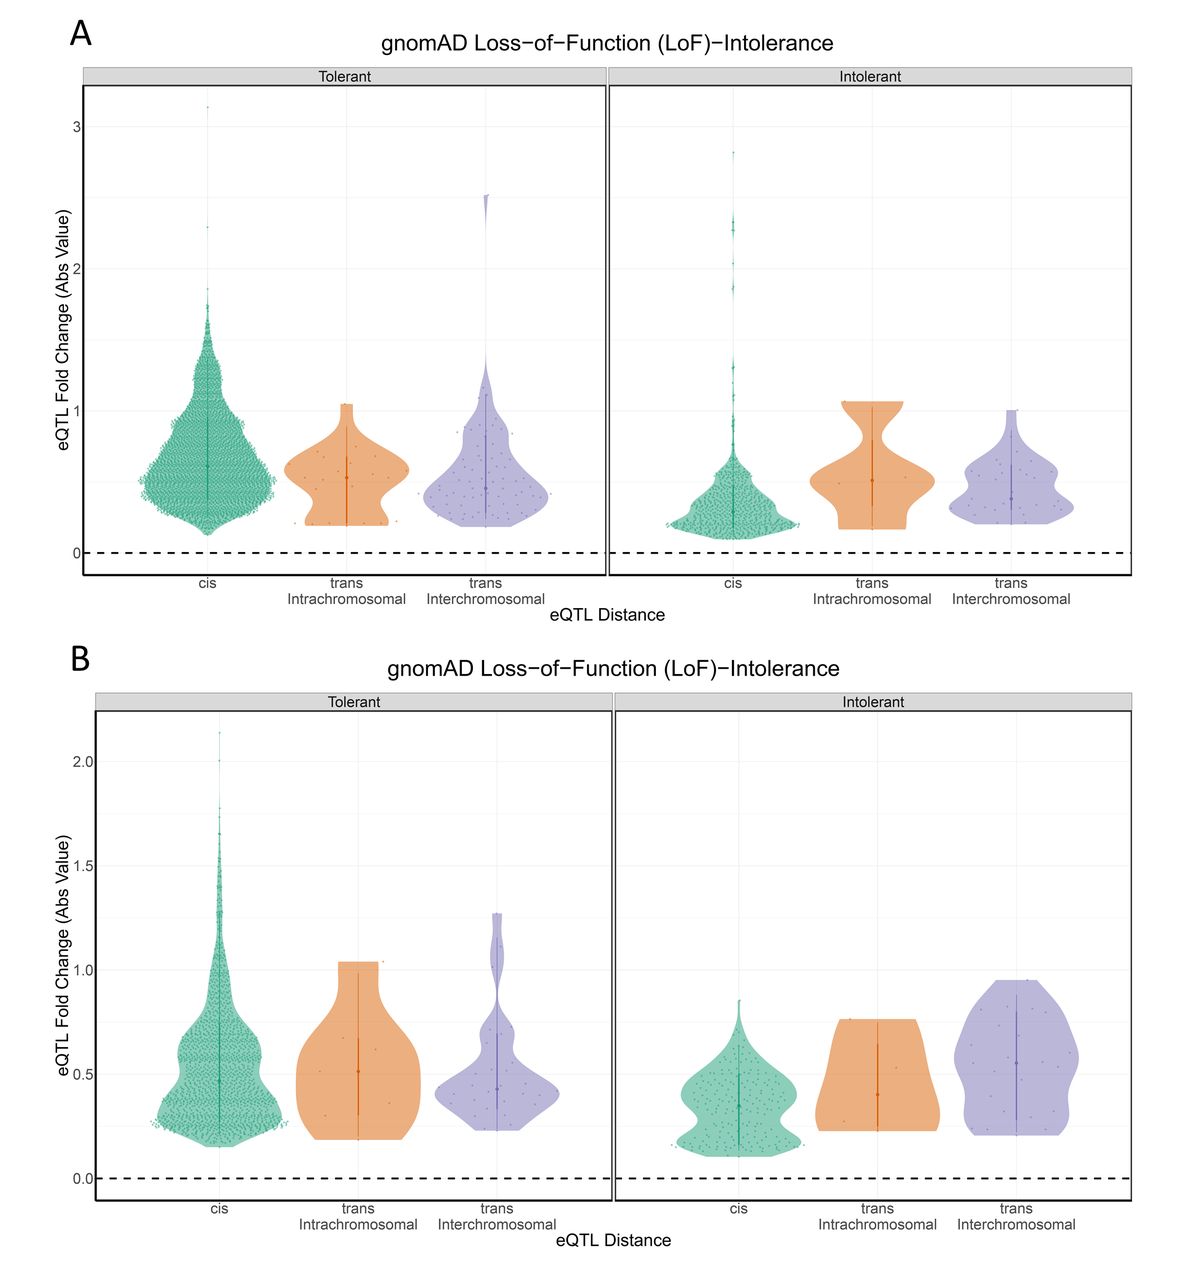
Because the cohesin genes are intolerant to even small perturbations in gene expression, we hypothesised that the LoF-intolerant genes that were regulated by elements within the cohesin genes would similarly only be tolerant to small allelic fold changes (aFC) in gene expression. Therefore, we tested for a correlation between pLI and the aFC (log2 aFC) associated with the eQTL. We observed that pLI is significantly correlated with aFC (r=−0.07, p<0.01; figure 3). Ignoring the direction of the change in expression, by using the absolute value of log2 aFC, we identified an even stronger negative correlation between pLI and aFC (r=−0.31, p<0.01; figure 4). Collectively, these results are consistent with the hypothesis that long distance (especially interchromosomal) regulatory connections exhibit greater tissue specificity and disease associations26 37 because they are enriched for LoF-intolerant gene sets. Thus, the interchromosomal regulatory connections potentially highlight novel disease pathways associated with the known cohesinopathies.
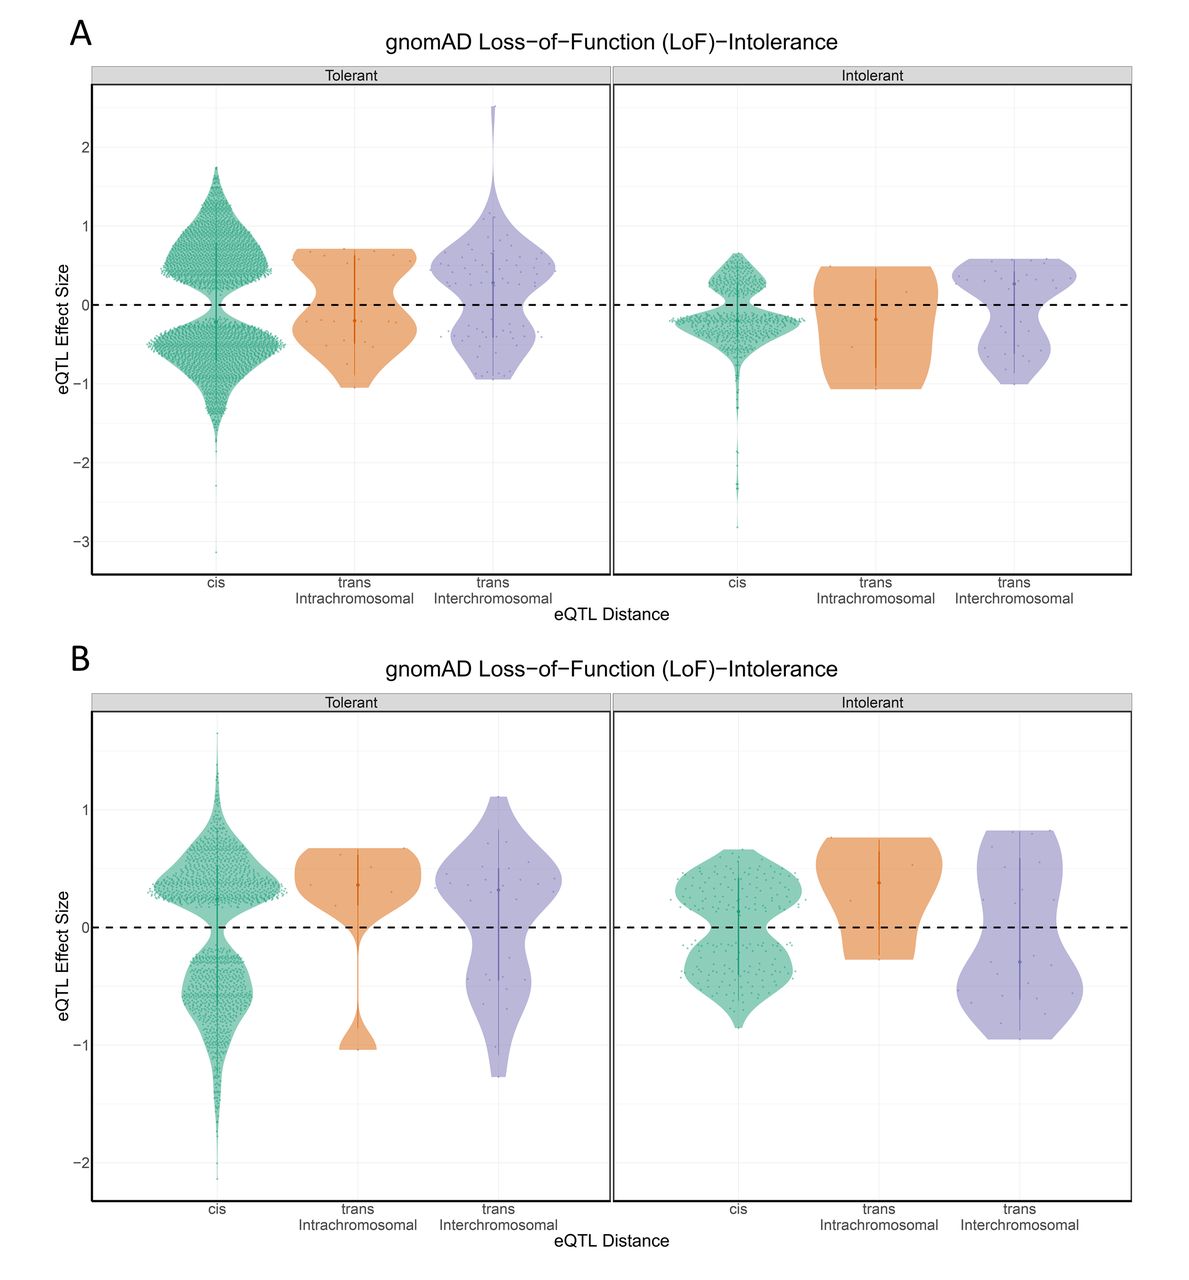
pLI shows enrichment for variant-gene eQTL distance Violin plots of aFC across the (A) eQTL-attributed and (B) GWAS-attributed gene sets, pLI and LoF-intolerance (pLI>0.9) are both significantly correlated with aFC. aFC, allelic fold change; eQTL, expression quantitative trail locus; GWAS, genome-wide association studies; LoF, loss-of-function; pLI, loss-of-function intolerance.

pLI shows an effect on eQTL effect size at each variant-gene eQTL distance category Violin plots of aFC across the (A) eQTL-attributed and (B) GWAS-attributed gene sets, pLI and LoF-intolerance (pLI >0.9) are both significantly correlated with aFC as an absolute value. aFC, allelic fold change; eQTL, expression quantitative trail locus; GWAS, genome-wide association studies; LoF, loss-of-function; pLI, loss-of-function intolerance.
Pathway analysis identifies cohesin gene connections with extracellular matrix production and the proteasome
We hypothesised that genes connected to regulatory variants within the cohesin loci might be contributing to disease-related phenotypes. A g:Profiler TRANSFAC analysis identified significant enrichment for target sequences for the EGR1 transcription factor (online supplementary table S7). EGR1 transcription is regulated by stress and growth factor pathways; its binding to DNA is modulated by redox state, and its transcriptional targets include genes involved in extracellular matrix (ECM) production.38 g:Profiler enrichment also identified nine genes as part of the ubiquitin mediated proteolysis pathway (BIRC3, BIRC6, CUL2, UBE2F, UBE2K, UBE4B, UBR5, CUL3, XIAP; online supplementary tables S7 (red) and S10). The proteasome pathway tags unwanted proteins to be degraded and defects in proteolysis have a causal role in a variety of cancers. Notably, 8 of the 9 (88.9%) genes identified in the Ubiquitin-mediated proteolysis pathway are LoF-intolerant.
Cohesin gene loci interactions with distant LoF-intolerant genes highlight chromatin-remodelling drug interactions
We hypothesised that the 310 genes we identified would have pharmacokinetic interactions with cancer treatments. Notably, we identified CYP3A5 as being regulated by a cis interaction with a variant 4 41 888 bp away (intronic, CNPY4). CYP3A5 encodes a protein within the cytochrome P450 family. Defects in P450 are known to alter cancer treatment outcomes (drug metabolism, KEGG hsa00982). Additionally, we identified a g:Profiler enrichment for the E2F7 transcription factor within our eGenes. E2F7 is upregulated in response to treatment with doxorubicin or etoposide, topoisomerase 2 blockers.35 Indeed, many of the 310 genes from the CoDeS3D analysis are targeted by drugs (online supplementary table S11). By contrast, for the cohesin genes, the drug-gene interaction database only lists known drug interactions for STAG2 and STAG3. 39 Notably, consistent with our earlier observations, the drug-gene targets we identified include two genes targeted by topoisomerase blockers (eg, PAPOLA and XIAP),39 both of which are LoF-intolerant genes.
Discussion
Through the use of the ‘Contextualize Developmental SNPs using 3D Information’ (CoDeS3D) algorithm,25 we have leveraged physical proximity (Hi-C) and gene regulatory changes (eQTLs) to reveal how variation in putative enhancers can alter the regulation of cohesin genes and modifier genes. Our analysis has identified 140 eQTLs that link 310 genes associated with the mitotic cohesin ring genes (SMC1A, SMC3, STAG1, STAG2 and RAD21/RAD21-AS), meiosis-specific cohesin ring genes (SMC1B, STAG3, REC8 and RAD21L1), cohesin-associated support proteins (WAPL, NIPBL, PDS5A, PDS5B and MAU2) and CTCF. Collectively, these results form an atlas of functional connections from cohesin genes to proximal and distal genes, some of which reside on different chromosomes to the regulatory elements. The results agree with previous findings that spatial eQTLs mark hubs of activity across a multimorbidity atlas.25
Only 35% of variant-gene mappings in the GWAS catalogue were supported by spatial cis-eQTLs. Therefore, although several GWAS-associated disease SNPs have been linked with cohesin, only a minority have supporting evidence that these variants actually regulate the cohesin genes. As such, our results call into question the validity of many of the previous associations between non-coding genetic variants and the cohesin genes that have been made in the GWAS catalogue.
Previous reports have suggested that cis-eQTL gene sets are depleted of LoF-intolerance genes when compared with similarly sized sets of non-eQTL genes.40 Notably, our findings show that the 310 genes regulated by variants in cohesin loci are also enriched for LoF-intolerant genes. The apparent bias in existing studies can be explained by eQTL studies being predominantly focused on nearby (cis) variant-gene transcriptional connections and Hi-C studies focusing on local changes in TAD structure, due to technical limitations in the current analysis pipelines.
We revealed that the greater the distance separating the eQTL and target gene, the more likely the target gene was to be LoF-intolerant (ie, over 30% of trans-interchromosomal interactions involved LoF-intolerant genes). This finding is consistent with studies that show that long distance connections exhibit greater disease-specificity and tissue-specificity.26 37 41 That the cohesin genes are also LoF-intolerant agrees with their recognised haploinsufficiency in human developmental disease.2 13 Notably, the genes that were enriched within pathways of pathological importance (eg, eight of the nine genes in the ubiquitin-mediated proteolysis pathway gene set) were more likely to be LoF-intolerant. This is consistent with previous findings that eQTL-identified genes are enriched for genome-wide disease heritability, and the subset of eQTL genes with LoF-intolerance is even more enriched for genome-wide disease heritability.42
The CoDeS3D method identified eQTL links between cohesin genes and other loci not related to cohesin. Two pathways emerged from this analysis. First, spatial eQTL connections with cohesin genes identified an enrichment for genes that are regulated by zinc finger transcription factors including EGR1 and ZNF880. EGR1 positively regulates ECM production. Interestingly, we recently observed widespread dysregulation of ECM genes on deletion of cohesin genes in leukaemia cell lines.43 This supports the idea that regulation of the cohesin complex is tightly associated with ECM production. Additional support for this is derived from the observation that cohesin subunit SMC3 exists in the form of an extracellular chondroitin sulfate proteoglycan known as bamacan.44 Additionally, in asthma, SMC3 upregulation significantly affected ECM components.45 The ECM facet of cohesin biology is relatively under-explored and is worthy of further investigation. Second, spatial eQTL connections with cohesin genes identified an enrichment for genes that encode effectors of the proteasome pathway. The stability of many cohesin proteins is regulated by the proteasome pathway,1 46 47 but aside from this, genetic interactions between cohesin genes and proteasome pathway genes remain unexplored.
In conclusion, many studies of mutations focus on the impact of coding-region variation, relying on natural knockouts (especially missense and loss of function variants) to identify gene function. Our analysis highlights what those studies might be missing: sets of co-ordinated genes important to disease but largely intolerant to LoF mutation in healthy individuals. We identified a novel set of genes which are regulated by elements within the cohesin genes. We found that many of the pathways and transcription factor binding sites enriched within these genes were relevant to disease pathways relevant to development and cancer. Moreover, drug-gene interactions further reinforce the importance of these connections to cancer drug treatments and in particular topoisomerase-targeting drugs. As such, our results support recent reports of the importance of long-distance regulation as a key driver of phenotype development.37
Methods
A large number of GWAS have mapped phenotypic variation to cohesin ring gene loci
We searched the GWAS catalogue for SNPs mapped or attributed to mitotic cohesin ring genes (SMC1A, SMC3, STAG1, STAG2 and RAD21/RAD21-AS), meiosis-specific cohesin ring genes (SMC1B, STAG3, REC8 and RAD21L1), cohesin-associated support proteins (WAPL, NIPBL, PDS5A, PDS5B and MAU2) and CTCF from GWAS covering a large assortment of altered phenotypes and pathologies across most tissues in the body (GWAS-attributed, online supplementary figure S3).
Supplemental material
Genomic positions of SNPs were obtained from dbSNP for human reference hg38.
Composite regulatory impact (cis-eQTLs) of variants in cohesin gene loci
Beyond variants with association to disease, we searched the GTEx catalogue for cis-regulatory variants (variants within 1 Mb) that modify the expression of either cohesin ring genes (SMC1A, SMC1B, SMC3, STAG1, STAG2, STAG3, RAD21, REC8 and RAD21L1), cohesin support genes (WAPL, NIPBL, PDS5A, PDS5B and MAU2) or CTCF in one or more of 44 tissues across the human body (eQTL-attributed, online supplementary figure S3). Unlike GWAS variants, these variants have no inherent association to a phenotype (except the overlaps), as GTEx contains individuals that were relatively healthy prior to mortality. Thus, these variants explain variation in gene expression in a normal, mostly older cohort.
Genomic positions of SNPs were obtained from dbSNP for human reference hg38.
Identification of SNP-gene spatial relationships
For all GWAS-attributed and eQTL-attributed variants, spatial regulatory connections were identified through genes whose transcript levels depend on the identity of the SNP through both spatial interaction (Hi-C data) plus expression data (eQTL; GTEx V.848) using the CoDeS3D algorithm (https://github.com/Genome3d/codes3d-v1).25 49 Spatial-eQTL association p values were adjusted using the Benjamini-Hochberg procedure and associations with adjusted p<0.05 were deemed spatial eQTL-eGene pairs. Variants not found in the GTEx catalogue or variants with a MAF below 5% were filtered out due to the sample size of GTEx at each tissue (online supplementary figure S3).
To identify SNP locations in the Hi-C data, reference libraries of all possible Hi-C fragment locations were identified through digital digestion of the hg38 human reference genome with the same restriction enzyme employed in preparing the Hi-C libraries (ie, MboI, HindIII). Digestion files contained all possible fragments, from which a SNP library was created, containing all genome fragments containing a SNP. Next, all SNP-containing fragments were queried against the Hi-C databases to find distal fragments of DNA which spatially connect to the SNP-fragment. If the distal fragment contained the coding region of a gene, a SNP-gene spatial connection was confirmed. There was no binning or padding around restriction fragments to obtain gene overlap. To limit technological challenges, gene transcripts for both the spatial and eQTL analyses used the GENCODE transcript model.
Spatial connections were identified from previously generated Hi-C libraries of various origins (online supplementary table 12): (1) cell lines GM12878, HMEC, HUVEC, IMR90, K562, KBM7, HELA, NHEK and hESC (GEO accession numbers GSE63525, GSE43070 and GSE35156); (2) tissue-specific data from ENCODE sourced from the adrenal gland, bladder, dorsolateral prefrontal cortex, hippocampus, lung, ovary, pancreas, psoas muscle, right ventricle, small bowel and spleen (GSE87112) and (3) tissues of neural origin from the cortical and germinal plate neurons (GSE77565), cerebellar astrocytes, brain vascular pericytes, brain microvascular endothelial cells, SK-N-MC and spinal cord astrocytes (GSE105194, GSE105513, GSE105544, GSE105914, GSE105957) and neuronal progenitor cells (GSE52457).
Defining mutationally constrained genes
The human transcriptome consists of genes with varying levels of redundancy and critical function, resulting in some genes being LoF-intolerant mutation. This subset of the human transcriptome are posited to also be more intolerant to regulatory perturbation. The gnomAD catalogue36 lists 19 704 genes and their likelihood of being intolerant to loss-of-function mutations (pLI), resulting in 3063 LoF-intolerant, 16 134 LoF-tolerant and 507 undetermined (15.5% LoF-intolerance, defined as pLI ≥ 0.9).36 We tested all cohesin, cohesin-associated genes and those from our analysis (GWAS-attributed and eQTL-attributed) for LoF-intolerance, comparing our cis-acting and trans-acting eQTL gene lists for enrichment for LoF-intolerance. As a control dataset, we tested pLI for the identified gene set versus a bootstrapping of 10 000 randomly selected sets of an equal number of genes from GTEx. This tests the likelihood that the identified gene set has a proportion greater than observed here, as evidence that the CoDeS3D-derived cohesin connections are enriched for LoF-intolerance.
As pLI is bimodal and non-normally distributed, we tested both pLI raw values as well as pLI grouping (tolerant versus intolerant) for correlation between eQTL effect size (log2 aFC) and intolerance to disruption (pLI). We considered both aFC and its absolute value (direction of effect ignored), as it has been suggested that the eQTL effect direction is determined by how you define the minor allele within the population, not the actual molecular impact of the eQTL on the cohesin connection. This analysis highlights the significance of long-distance gene regulation on otherwise mutationally constrained (LoF-intolerant) genes.
Gene ontology (GO), pathway analysis, and functional prediction
All genes from the GWAS-attributed and eQTL-attributed analyses were then annotated for significant biological and functional enrichment using g:Profiler,50 which includes the KEGG Pathway Database (https://www.kegg.jp/kegg/pathway.html) for pathways and TRANSFAC for transcription factor binding enrichment. Finally, we identified drugs that target the genes and related mechanisms through the Drug Gene Interaction database (DGIdb).39
Annotation algorithms highlight potential for regulatory behaviour
To predict the most phenotypically causal variants within the variant set, we compared variants from the CoDeS3D analysis with several tools which leverage deep learning-based algorithmic frameworks to classify functional relevance from DNA markers including identified chromatin marks (enhancer marks and so on). We used DeepSEA51 to predict the chromatin effects of variants to prioritise regulatory variants and PredictSNP252 to summarise estimates of noncoding variants for classification (deleterious or neutral). DeepSEA predicts the chromatin effects of sequence alterations by analysing the epigenetic state of a sequence (transcription factors binding, DNase I sensitivities and histone marks) across multiple cell types. PredictSNP2 predictions are a consensus score from across five separate prediction tools for variant prioritisation: CADD 1.2 and FATHMM-MKL are modelled on SVM prediction, DANN leverages Deep neural networks, FunSeq2 2.1.2 uses a weighted scoring system and GWAVA 1.0 makes its predictions based on a random forest model.
URLs
GTEx portal: https://www.gtexportal.org/home/
CoDeS3D pipeline: https://github.com/Genome3d/codes3d-v1
Data availability statement
Data are available in a public, open access repository. All data relevant to the study are included in the article or uploaded as supplementary information. All raw data used for this paper is available from publically available datasets, with appropriate URLs and citations placed in the relevant methods sections in the manuscript.
Ethics statements
References
Footnotes
Twitter @DrJOSull
Contributors WS planned the study and performed analyses. WS and JAH drafted the manuscript. All authors analysed data, revised the manuscript and approved the final version.
Funding This work was supported by a Royal Society of New Zealand Marsden Grant to JAH and JO (16-UOO-072), and WS was supported by the same grant.
Competing interests None declared.
Provenance and peer review Not commissioned; externally peer reviewed.
Supplemental material This content has been supplied by the author(s). It has not been vetted by BMJ Publishing Group Limited (BMJ) and may not have been peer-reviewed. Any opinions or recommendations discussed are solely those of the author(s) and are not endorsed by BMJ. BMJ disclaims all liability and responsibility arising from any reliance placed on the content. Where the content includes any translated material, BMJ does not warrant the accuracy and reliability of the translations (including but not limited to local regulations, clinical guidelines, terminology, drug names and drug dosages), and is not responsible for any error and/or omissions arising from translation and adaptation or otherwise.