Article Text

Abstract
Background Height and other anthropometric measures are consistently found to associate with differential cancer risk. However, both genetic and mechanistic insights into these epidemiological associations are notably lacking. Conversely, inherited genetic variants in tumour suppressors and oncogenes increase cancer risk, but little is known about their influence on anthropometric traits.
Methods By integrating inherited and somatic cancer genetic data from the Genome-Wide Association Study Catalog, expression Quantitative Trait Loci databases and the Cancer Gene Census, we identify SNPs that associate with different cancer types and differential gene expression in at least one tissue type, and explore the potential pleiotropic associations of these SNPs with anthropometric traits through SNP-wise association in a cohort of 500,000 individuals.
Results We identify three regulatory SNPs for three important cancer genes, FANCA, MAP3K1 and TP53 that associate with both anthropometric traits and cancer risk. Of particular interest, we identify a previously unrecognised strong association between the rs78378222[C] SNP in the 3' untranslated region (3'-UTR) of TP53 and both increased risk for developing non-melanomatous skin cancer (OR=1.36 (95% 1.31 to 1.41), adjusted p=7.62E−63), brain malignancy (OR=3.12 (2.22 to 4.37), adjusted p=1.43E−12) and increased standing height (adjusted p=2.18E−24, beta=0.073±0.007), lean body mass (adjusted p=8.34E−37, beta=0.073±0.005) and basal metabolic rate (adjusted p=1.13E−31, beta=0.076±0.006), thus offering a novel genetic link between these anthropometric traits and cancer risk.
Conclusion Our results clearly demonstrate that heritable variants in key cancer genes can associate with both differential cancer risk and anthropometric traits in the general population, thereby lending support for a genetic basis for linking these human phenotypes.
- cancer: CNS
- cancer: dermatological
- clinical genetics
- complex traits
- developmental
Data availability statement
Data used in this study are either available in public, open access repositories, or may be obtained from a third party. For UK Biobank data, please apply to the UK Biobank Consortium through the approved process, details can be found here: https://www.ukbiobank.ac.uk/
This is an open access article distributed in accordance with the Creative Commons Attribution Non Commercial (CC BY-NC 4.0) license, which permits others to distribute, remix, adapt, build upon this work non-commercially, and license their derivative works on different terms, provided the original work is properly cited, appropriate credit is given, any changes made indicated, and the use is non-commercial. See: http://creativecommons.org/licenses/by-nc/4.0/.
Statistics from Altmetric.com
Introduction
Height and other anthropometric measures have been consistently found to associate with differential cancer risk.1–3 However, mechanistic and genetic insights into these associations are notably lacking.2 4 Increased height has been associated with a number of malignancies including skin, breast, colon, rectum, endometrium, ovary and kidney cancers, as well as Hodgkin’s lymphoma and leukaemia.2 5 Current theories linking increased height with increased cancer risk centre on the role of growth hormone, insulin-like growth factor and/or insulin as pro-tumourigenic by regulating the Ras-MAPK and PI3K pathways, and hence leading to increased cellular proliferation.6 It has also been proposed that increased height corresponds to an increased number of cells, resulting in an increased probability of malignancy simply by chance7; however, such allometric scaling of body mass explains only part of the observed effect and it is not observed among mammal species of different size (Peto’s paradox).8 Increased body mass index (BMI), a surrogate measure of obesity based on the weight-to-height ratio, has also been associated with an increased risk of various cancers, including postmenopausal breast cancer, colorectal cancer and renal cancer.9 Increased BMI is partially attributed to increasing accumulation of fat mass. It is hypothesised that adiposity causes a state of systemic inflammation, a shift of metabolite and adipokine release and an increase of circulating insulin, secondary to insulin resistance.10 This combination may increase cancer risk. However, the mechanism(s) behind this association are not well understood. Thus, links between anthropometric measures and cancer remain an area of intense research.
Anthropometric traits are largely determined by genes that control cellular proliferation, metabolism and apoptosis, processes that are also required for immortalisation of cancer cells and development of tumours.11 It is well established that germline mutations within tumour suppressor genes and oncogenes affect cancer risk.12 Studies on mouse models and rare diseases indicate that mutations in some of these genes may influence body mass composition.13–15 For example, the tumour suppressor gene ARH1 inhibits cell growth. A deletion in ARH1 is commonly associated with breast and ovarian carcinoma, while mice that are engineered to overexpress ARH1 are significantly smaller than wild-type counterparts.16 Mice possessing knockouts of genes within the tumourigenic hypoxia-inducible pathway vary in size and respond to high-fat diets differently from those without the mutations.17 18 TP53 is the most frequently mutated gene in human cancers and is a key regulator of a number of cellular activities that prevent tumourigenesis, including maintaining genomic stability, controlling cell growth and metabolism.13 19 Mouse models of TP53 mutations have demonstrated that reduction of p53 activity can increase cancer risk, and also alter metabolism and occurrence of obesity in a complex and signal dependent manner.14 15
Further evidence for a relationship between body size, genetics and cancer comes from human genetic diseases, such as Turner syndrome. Turner syndrome is defined by complete or partial chromosome X monosomy and is associated with a distinct clinical phenotype, including gonadal dysgenesis, cubitus valgus and short stature.20 Short stature in this condition has been attributed to haplo-insufficiency of the SHOX tumour suppressor gene.21 Deletions and mutations in SHOX have also been proposed to explain short stature within the general population.22 Another example comes from patients with Simson-Golabi-Behmel syndrome (SGB), caused by mutations in the GPC3 tumour suppressor gene. Patients with SGB tend to have prenatal and postnatal overgrowth and thus ultimately taller stature together with an increased risk of embryonic tumours. GPC3-null mice also display overgrowth.23 These effects, in both humans and mice, are thought to be due to unshackling of the hedgehog pathways, and increasing cellular proliferation.24 25
Pleiotropy is the phenomenon whereby a single SNP or genetic mutation can influence multiple traits. These rare diseases provide evidence that major differences in the expression of cancer genes can influence both anthropometric traits and cancer risk in specific cohorts of patients. However, it is less clear that such associations occur in the broader population. The availability of large phenotypic and genetically linked datasets has allowed us to deploy genome-wide association studies (GWAS) of common SNPs to understand the link between genetics and anthropometric traits. However, until now, it has been difficult to look for pleiotropy between functional SNPs in genes associated with cancer risk and anthropometric traits, as very few cohorts possess both comprehensive genetic data and detailed anthropometric data in the same population. The UK Biobank provides a unique opportunity to investigate such pleiotropic associations in a large prospective cohort of over 500 000 participants.
Methods
The UK Biobank
The UK Biobank is a cohort of ~500 000 UK residents who volunteered to have their clinical, lifestyle, anthropometric and genetic data collected for research. Data were collected in a number of ways, including by face-to-face interview, touchscreen assessment and from centralised clinical registers (eg, the Cancer register and Death register). Participants were aged between 40 and 69 years at recruitment. All baseline data used in this study were collected in 22 UK centres, between 2006 and 2010.
Anthropometric data
During the baseline assessment, participants had various anthropometric traits measured directly or by bioelectrical impedance. Bioimpedance data were measured using a Tanita BC418MA body composition analyser. Participants stood barefoot on the analyser and held the metal handles. This device produced measurements of fat mass, fat-free mass and basal metabolic rate. Further information on anthropometric data collected is found here.26
Cancer data
Cancer occurrences were defined by presence of a cancer International Classification of Diseases (ICD) code in the UK Cancer register or the UK Death register. To maximise the number of individual cancers cases, we combined ICD9 and ICD10 codes of identical cancers. This was carried out by a clinician to ensure the matching was accurate: for example, malignant neoplasm of brain was defined as C71 (ICD10) and 191 (ICD9). To increase statistical power, when appropriate we merged ICD codes into clinically relevant groups. We ran both individual cancers (combined ICD9 and ICD10 codes) and clinically relevant groups in our analysis.
Genetic data
Blood samples were collected when participants were recruited, and DNA extracted.27 DNA was then genotyped on either the Affymetrix UK BiLEVE Axiom array or the Affymetrix UK Biobank Axiom array (Santa Clara, California, USA). Imputation was based on a merged reference panel of ~90 million biallelic variants, from the 1000 Genomes Phase III28 and the UK10K29 haplotype panels. Imputation was performed using IMPUTE2 as described,30 producing 488 295 genotyped participants.
Sample quality control
In addition to the standard quality control, we used further quality control steps to ensure robustness of our analyses. We excluded individuals based on (i) a mismatched value between self-reported and genetic sex (data-field: 22 001 and 31); (ii) level of genotype missingness of >0.05 (data-field: 22005); (iii) genetic relatedness factor with kinship coefficient of >0.0442; (iv) sex chromosome aneuploidy (data-field: 22019) and (v) outliers for heterozygosity or missing rate (data-field: 22027). We selected the European population based on self-reported ethnicity (data-field: 21000) by excluding individuals with non-white ethnic backgrounds. This left a study population of 379 358 suitable genotyped individuals.
Identification of functional cancer gene SNPs
We identified genes confirmed to be involved in carcinogenesis from the COSMIC Cancer Gene Census (release V.88, 19 March 2019), the current reference record of genes containing cancer driver mutations. We selected all SNPs annotated to these genes that have been significantly associated with differential cancer risk in the GWAS Catalog.31 Significant associations with cancer risk were defined as p values of <5E-08 cut-off. Finally, we specified that these SNPs were also associated with differential expression of the cancer gene in at least one expression quantitative trait locus (eQTL) database. cis-eQTL databases used were GTEX, NESDA/NTR and PancanQTL.32–34
SNP quality control
SNPs were excluded if Hardy-Weinberg equilibrium had p values <1E−10, there was a minor allele frequency <0.0001, level of missingness >0.05 or an imputation score <0.8 (as per http://www.nealelab.is/uk-biobank/).
Analysis
To carry out the SNP-wise analysis on all functional-CG SNPs, we used SNPTEST (V.2.5.4),35 and employed the frequentist approach under dominant, additive and recessive inheritance models, using sex, age and genetic principal components (1–20 PCs) as covariates. Genetic PCs were included as covariates to control for hidden population structure. We controlled for genotype uncertainty by implementing missing data likelihood score test. Within SNPTEST, we used the frequentist approach under an additive inheritance model. P values of SNP-wise association were adjusted by the stringent Bonferroni correction based on number of tested traits (28 anthropometric traits, 50 cancer types) multiplied by the number of eSNPs (100). Significant associations were defined as Bonferroni correction p values below the threshold of 1E−5.
Linkage and lead SNPs
R2 and D' coefficients were calculated to evaluate the degree of linkage disequilibrium (LD) between different loci using LDlink V.3.7 (D'>0.8, R2 >0.4 https://ldlink.nci.nih.gov/).36 Lead SNPs were defined as the SNPs that were most strongly associated with the traits in question for each locus.37 Due to the low value of R2 in some of the potential LD eSNPs, we carried out a leave-one-out analysis, as described here.
For each lead SNP:
All participants from the cohort carrying the lead SNP were removed.
The association for each of the potential LD eSNPs was performed (eg, lead SNP rs78378222 carriers were removed while rs35850753 and rs8753 were tested for their associations with cancer and anthropometric traits).
Adjusted p values from the whole cohort association analysis with those obtained in this analysis were compared.
If the association of the potential LD eSNPs was not significant after the removal of lead SNP carriers (p>0.05), we considered the eSNP in LD.
Results
Through integration and curation of the GWAS Catalog, eQTL databases and the Cancer Gene Census, we identified 100 SNPs which have been shown to associate with a differential risk of developing a total of 21 different cancer types, and show differential gene expression in at least one tissue type of (i) proto-oncogenes (8 genes), (ii) oncogenic fusion proteins (8 genes), (iii) tumour suppressors (16 genes) and (iv) 15 genes that span two or more of these groups (online supplementary tables 1 and 2). We define these SNPs as cancer eSNPs. In our analyses of the UK Biobank cohort, we found 13 cancer eSNPs associated with differences in anthropometric traits and 31 with differential cancer risk. Interestingly, seven of these SNPs overlapped, thus displaying some level of pleiotropy between cancer risk and anthropometric traits (figure 1, online supplementary tables 3 and 4). These seven cancer eSNPs are found on three different chromosomes and in LD (see ‘Methods’ section) with at least one other identified cancer eSNP (figure 2). They have been found to be associated with differential expression levels of (i) Fanconi anaemia, complementation group A (FANCA) (rs1805007, rs258322), (ii) mitogen-activated protein kinase kinase kinase 1 (MAP3K1: rs889312, rs1862626) and (iii) tumour suppressor p53, TP53 (rs78378222, rs35850753, rs8753). The two cancer eSNPs associated with FANCA expression reside in neighbouring genes; rs258322 is a non-coding variant within CDK10 and rs1805007 is a missense variant within MC1R. eSNPs associated with MAP3K1 expression are found in an intergenic region close to ZNF296 and MAP3K1 (5q11.2). In contrast, the two cancer eSNPs associated with differential TP53 expression are found in untranslated regions (UTRs) of the TP53 gene itself. rs78378222 is found in the 3'-UTR of TP53, and rs35850753 is found in the 5'-UTR of the d133 isoform of TP53. The third TP53 eSNP lies in the 3'-UTR of the neighbouring POLR2A gene. The cancer eSNPs showing the strongest association between anthropometric measures and cancer risk within their loci (lead cancer eSNP) were rs1805007 (FANCA, C>T, minor allele frequency in UK Biobank40=0.102), rs78378222 (TP53, A>C, MAF=0.012) and rs889312 (MAP3K1, C>A, MAF=0.284).
Supplemental material
Supplemental material
Supplemental material
Supplemental material

A circos plot indicating the functional SNPs that significantly associate with anthropometric traits and cancer risk. SNPs are located on the top half of the plot while cancer types and anthropometric traits are on the bottom half. Significant associations (Bonferroni corrected p values <1E−5) are shown as solid lines. Blue lines indicate significant associations with anthropometric traits. Red lines depict significant associations with differential cancer risk.

A gene map of the chromosomal regions containing the pleiotropic functional SNPs. Lead SNPs are highlighted with red arrowhead. Tables summarise salient genome-wide association study (GWAS) Catalog, expression quantitative trait loci (eQTL) and Caner Gene Census information for each variant.
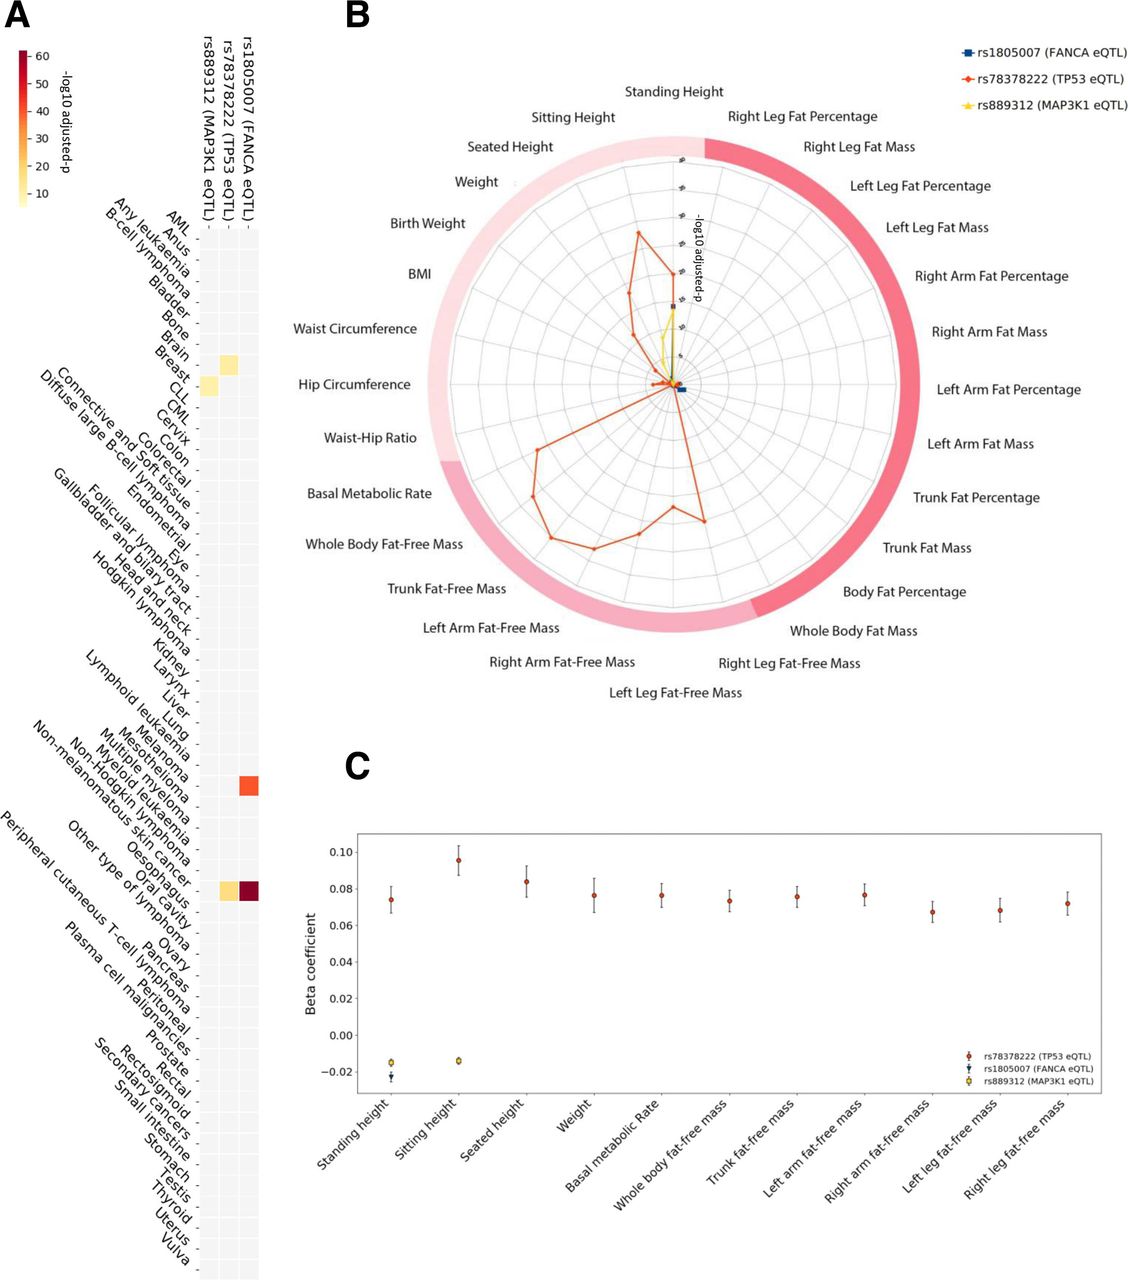
In the UK Biobank cohort, the minor allele of rs1805007 (FANCA) was associated with an increased risk of melanoma (OR=1.63 (95% CI 1.52 to 1.75), adjusted p=2.57E−41) and non-melanomatous skin cancer (OR=1.36 (1.31 to 1.41), adjusted p=7.62E−63). The minor allele of rs78378222 (TP53) was associated with an increased risk of brain malignancy (OR=3.12 (2.22 to 4.37), adjusted p=1.43E−12) and non-melanomatous skin cancer (OR=1.46 (1.34 to 1.60), adjusted p=5.20E−18). Post hoc analysis of the histology in the carriers of rs78378222 revealed brain cancers tended to be gliomas (81%) and notably, 16% had no histology recorded. The minor allele of rs889312 (MAP3K1) was associated with an increased risk of breast cancer (OR=1.1 (1.07 to 1.13), adjusted p=2.82E−11). Of note, as we selected these SNPs due to their noted association with differential cancer susceptibility in GWAS studies, our results provide an independent validation of these associations (figure 3A, online supplementary table 5).
Supplemental material
Considering the anthropometric measures, we identified an unexpectedly high level of pleiotropy, and very strong association, between the two TP53 cancer eSNPs and three measures of height (standing height, sitting height and seated height), overall body weight, six of lean body mass (right arm fat-free mass, left arm fat-free mass, right leg fat-free mass, left leg fat-free mass, trunk fat-free mass and whole body fat-free mass), as well as basal metabolic rate, with p values as low as 7.54E−36 (figure 3B). In support of our findings, significant associations of two TP53 cancer eSNPs (rs78378222, rs35850753) with the lean body mass measures (whole body fat-free mass and appendicular fat-free mass) using similar methodologies, yet with different covariates and different subpopulations of the UK Biobank cohort, have been presented in studies of different diseases, for instance, anorexia nervosa, providing further evidence for our results.38 39 After quality control (QC) procedures, we identified 59 participants homozygous for the minor allele (increased cancer risk) of the lead TP53 eSNP (rs78378222), 9253 heterozygous for the minor allele and 370 046 homozygous for the major allele. The minor allele carriers were on average taller and leaner, and had higher basal metabolic rate. The associations of these anthropometric traits with the minor allele of the rs78378222 SNP were markedly more significant (almost threefold greater) and with greater effect sizes (up to almost fivefold greater) than for the other pleiotropic eSNPs (figure 3C, online supplementary table 3).
Detailed association results for cancer eSNPs with anthropometric traits and cancer risk in the UK Biobank cohort. A heatmap (A) depicting the significance of the associations of the three lead pleiotropic SNPs with differential cancer risk. The colour scale represents the −log10 adjusted p: with the darkest red on the scale being 7.62E−63 and the lightest yellow being 1E−5. A radar plot (B) illustrating the level of significance of the associations of the three lead pleiotropic SNPs with anthropometric traits (radial axis: −log10 adjusted p). The darkest two pink categories are bioelectrical impedance measures (darkest being measures of fat). Traditional bedside anthropometric measures are in blush. SNPs related to FANCA (rs1805007†) and MAP3K1 (rs889312†) associate with standing height. The lead functional SNP related to TP53, rs78378222†, markedly associates with multiple measures of height and lean body mass, as well as basal metabolic rate. An error bar plot (C) of the beta coefficients (Y-axis) of the significant associations with anthropometric traits (X-axis). Error bars denote the 95% CI of the beta value. †Lead cancer eSNP.
The cancer eSNPs for TP53 showed strikingly strong associations with 10 different anthropometric traits in the UK Biobank cohort. In contrast, the cancer eSNPs related to FANCA (rs1805007) and MAP3K1 (rs889312) were associated with standing height but not lean body mass measures. After QC, we identified 4271 participants homozygous for the minor allele of the lead FANCA eSNP, 68 956 heterozygous for the minor allele and 306 131 homozygous for the major allele. The minor allele for the lead MAP3K1 eSNP was found in 185 184 participants (30 394 homozygous, 154 790 heterozygous). The FANCA eSNP (rs1805007) associated with standing height only (beta=−0.02±0.002, adjusted p=9.20E−15), while the MAP3K1 eSNP (rs889312) associated with broader range of height measures (standing height beta=−0.02±0.004, adjusted p=6.11E−14 and sitting height beta=−0.01±0.001, adjusted p=3.34E−9). In order to further validate the significance and magnitude of these associations, we applied a different algorithm, PLINK,40 to the lead cancer eSNPs. As in the initial analysis, we included the covariates sex, age and genetic principal components. Importantly, the PLINK analysis confirmed the observed associations and yielded similar adjusted p and beta values for the lead cancer eSNPs (online supplementary tables 6‒8). In addition, we sought validation for these associations with standing height in the independent GIANT consortium dataset. Here, we examined all lead and linked SNPs for each pleiotropic eSNP in the results of the meta-analysis conducted by Wood et al.41 We were able to identify eSNPs for MAP3K1 (rs889312, rs1862626) and FANCA (rs1805007, rs258322), but none for TP53, presumably due to the low minor allele frequency. Three of these eSNPs significantly associated with height in the meta-analysis by Wood et al: (i) rs258322 FANCA eQTL (p=1.5E−09, beta=−0.029), (ii) rs889312 MAP3K1 eQTL (p=2.3E−08, beta=−0.018) and (iii) rs1862626 MAP3K1 eQTL (p=3.4E−08, beta=−0.018). Interestingly, both linked MAP3K1 eSNPs and a FANCA eSNP passed the significance threshold and, reassuringly, the directions of the allelic associations are consistent with our findings. The other FANCA eSNP fell just short of the GWAS significance threshold (rs1805007, 4.3E−04, beta=−0.024). Together, all these data clearly link eSNPs for MAP3K1 and FANCA with height.
Supplemental material
Supplemental material
Supplemental material
Discussion
This is the first comprehensive study providing evidence that functional common genetic variants in oncogenes and tumour suppressor genes can associate with both anthropometric traits and cancer risk in the general European population, and in the same cohort. SNPs exhibiting these pleiotropic associations in our study are found in three different loci: (i) FANCA (two SNPs in LD), (ii) MAP3K1 (two SNPs in LD) and (iii) TP53 (three SNPs in LD). Previous work has noted, rs10061757, a SNP in moderate LD (R2=0.6, D’=1) with the eSNPs for MAP3K1 (rs889312, rs1862626) has previously been shown to associate with height in the UK Biobank cohort.42 Furthermore, observations from mouse models designed to alter signalling pathways involving FANCA and TP53, suggested that such associations with anthropometric traits in humans might be possible. For example, targeted disruption of exons of the FANCA gene in mice results in altered anthropometric traits, including growth retardation, as well as increased cancer risk.43 44 Furthermore, mouse models of TP53 mutations have clearly demonstrated that reduction of p53 activity can result in increased cancer risk, altered metabolism and influence obesity in a complex and signal-dependent manner.14 15
The strongest associations we observed with both anthropometric traits and cancer risk are loci related to TP53. p53 is a key regulator of a number of cellular activities which prevent tumourigenesis, including maintaining genomic stability, controlling cell growth and metabolism.19 TP53 is the most frequently mutated gene in human cancers.13 Moreover, in all families with similar TP53 mutations in their heritable genomes, a dramatic increase in cancer risk is observed (Li-Fraumeni syndrome (LFS)).12 In recent studies, it has been shown that patients with LFS have an increased risk of developing cancer and an increased capacity for oxidative phosphorylation,45 providing a potential link with anthropometric traits and basal metabolic rate. Furthermore, the well-tolerated antidiabetic drug metformin, which is thought to inhibit mitochondrial complex 1, increases cancer-free survival in a mouse model of LFS and reduces proliferation in cancer cell lines.46 47 Metformin is now being trialled in patients with LFS to hopefully provide a preventative option for these high-risk patients (ClinicalTrials.gov number: NCT01981525). Based on the potential link with oxidative phosphorylation, this intervention might also be trialled in those carrying the minor allele of the TP53 cancer eSNP (rs78378222).
The TP53 mutations found in LFS are rare in the general population. However, here we show that relatively frequent SNPs related to p53 also affect cancer risk and anthropometric traits in the same cohort. Notably, the minor allele of an SNP in the polyadenylation signal of p53 (rs78378222[C]) which is found in approximately 1% of populations of European descent, has been shown to impair 3'-end processing of p53 mRNA, resulting in a reduction of p53 protein and an increased risk for glioma and basal cell carcinoma as well as affecting head circumference and intracranial volume.48 49 Here, we validate these cancer associations in a separate cohort (non-melanomatous skin cancer, OR=1.46 (95% CI 1.34 to 1.60), adjusted p=5.20E−18, brain malignancy, OR=3.12 (2.23 to 4.37), adjusted p=1.43E−12), and also show that carriers of this allele tend to be taller, leaner and have a higher basal metabolic rate (standing height, adjusted p=2.18E−24, beta=0.073±0.007, whole body fat-free mass, adjusted p=8.34E−37, beta=0.073±0.005, basal metabolic rate, adjusted p=1.13E−31, beta=0.076±0.006). Of these, the association between rs78378222 and lean body mass confirms previous results that this SNP has the second-largest positive effect size on whole body fat-free mass and fifth largest positive effect size on appendicular fat-free mass in a population aged 60–74 years.38 ,39 Indeed in our analysis of all the cancer eSNPs, the rs78378222 minor allele has the largest effect size on fat-free mass measures and also has the largest effect size on standing, seated and sitting height as well as basal metabolic rate (online supplementary table 3). The next two highest ranking SNPs in fat-free mass, height measures and basal metabolic rate are the other two TP53 eSNPs (rs35850753, rs8753).
Prior to this study, associations between increased height and non-melanomatous skin cancer/brain malignancy had been established, but mechanistic and genetic explanations were lacking.2 50 Our study proves the concept that functional loci in well-characterised tumour suppressors and oncogenes alter both cancer risk and anthropometric traits. Of particular interest, we identify a strong, new, association between the rs78378222[C] SNP in the polyadenylation site of p53 with both increased risk for developing non-melanomatous skin cancer/brain malignancy and increased height, body weight, lean body mass and basal metabolic rate. This offers a novel genetic link between anthropometric traits and cancer risk.
Data availability statement
Data used in this study are either available in public, open access repositories, or may be obtained from a third party. For UK Biobank data, please apply to the UK Biobank Consortium through the approved process, details can be found here: https://www.ukbiobank.ac.uk/
Ethics statements
Ethics approval
UK Biobank obtained informed consent from all participants and all protocols were approved by the National Research Ethics Service Committee. This study was conducted under the UK Biobank approved applications (#24456, PI Gareth Bond and #43313, PI Francesca M Buffa).
Acknowledgments
The authors would like to thank Dr Dawn O’Reilly for proofreading the article.
References
Footnotes
MDG and BHH are joint first authors.
FMB and GLB are joint senior authors.
Contributors MDG and BHLH conducted the bioinformatics analysis, helped with the design of the study and the writing of the manuscript. PZ, LX and NS helped with bioinformatics analysis. PZ helped with figure optimisation and contributed eQTL data curation. IK-S helped with the literature review for data interpretation. GS, MW, SB, SL, DH and ALH helped with data intepretation and writing of the manuscript. FMB and GLB co-designed the study, oversaw the bioinformatics analysis and were instrumental in drafting the manuscript. FMB and GLB are happy to be responsible for the overall content as guarantors.
Funding This work was supported by Ludwig Institute for Cancer Research Grant to GB, Cancer Research UK Programme Grant 23969 to FMB and Cancer Research UK DPhil Scholarship to BHLH, and European Research Council Programme Grant 772970 to FMB.
Competing interests None declared.
Provenance and peer review Not commissioned; externally peer reviewed.