Article Text

Abstract
The use of genomic information to better understand and prevent common complex diseases has been an ongoing goal of genetic research. Over the past few years, research in this area has proliferated with several proposed methods of generating polygenic scores. This has been driven by the availability of larger data sets, primarily from genome-wide association studies and concomitant developments in statistical methodologies. Here we provide an overview of the methodological aspects of polygenic model construction. In addition, we consider the state of the field and implications for potential applications of polygenic scores for risk estimation within healthcare.
- genetic epidemiology
- getting research into practice
- prevention
- genome-wide
- clinical genetics
This is an open access article distributed in accordance with the Creative Commons Attribution Non Commercial (CC BY-NC 4.0) license, which permits others to distribute, remix, adapt, build upon this work non-commercially, and license their derivative works on different terms, provided the original work is properly cited, appropriate credit is given, any changes made indicated, and the use is non-commercial. See: http://creativecommons.org/licenses/by-nc/4.0/.
Statistics from Altmetric.com
Introduction
There has been considerable interest in elucidating the contribution of genetic factors to the development of common diseases and using this information for better prediction of disease risk. The common disease common variant hypothesis predicts that variants that are common in the population play a role in disease susceptibility.1 Genome-wide association studies (GWAS) using single nucleotide polymorphism (SNP) arrays were developed as a mechanism by which to investigate these genetic factors and it was hoped this would lead to identification of variants associated with disease risk and subsequent development of predictive tests. Variants identified as associated with particular traits by these studies, for the large part, are SNPs that individually have a minor effect on disease risk and hence, by themselves, cannot be reliably used in disease prediction. Looking at the aggregate impact of these SNPs in the form of a polygenic score (PGS) appeared to be one possible means of using this information to predict disease.2 It is thought this will be of benefit as our genetic make-up is largely stable from birth and dictates a ‘baseline risk’ on which external influences act and modulate. Therefore, PGS are a potential mechanism to act as a risk predictor by capturing information on this genetic liability.
The use of PGS as a predictive biomarker is being explored in a number of different disease areas, including cancer,3 4 psychiatric disorders,5–7 metabolic disorders (diabetes,8 obesity9) and coronary artery disease (CAD).10 The proposed applications range from aiding disease diagnosis, informing selection of therapeutic interventions, improvement of risk prediction, informing disease screening and, on a personal level, informing life planning. Therefore, genetic risk information in the form of a PGS is considered to have potential in informing both clinical and individual-level decision-making.
Recent advances in statistical techniques, improved computational power and the availability of large data sets have led to rapid developments in this area over the past few years. This has resulted in a variety of approaches to construction of models for score calculation and the investigation of these scores for prediction of common diseases.11 Several review articles aimed at researchers with a working knowledge of this field have been produced.6 11–17 In this article, we provide an overview of the key aspects of PGS construction to assist clinicians and researchers in other areas of academia to gain an understanding of the processes involved in score construction. We also consider the implications of evolving methodologies for the development of applications of PGS in healthcare.
Evolution in polygenic model construction methodologies
Terminology with respect to PGS has evolved over time, reflecting evolving approaches and methodology. Other terms include PGS, polygenic risk score, polygenic load, genotype score, genetic burden, polygenic hazard score, genetic risk score (GRS), metaGRS and allelic risk score. Throughout this article we use the terms polygenic models to refer to the method used to calculate an output in the form of a PGS. Different polygenic models can be used to calculate a PGS and analysis of these scores can be used to examine associations with particular markers or to predict an individuals risk of diseases.12
Usual practice in calculating PGS is as a weighted sum of a number of risk alleles carried by an individual, where the risk alleles and their weights are defined by SNPs and their measured effects (figure 1).11 Polygenic models have been constructed using a few, hundreds or thousands of SNPs, and more recently SNPs across the whole genome. Consequently, determining which SNPs to include and the disease-associated weighting to assign to SNPs are important aspects of model construction (figure 2).18 These aspects are influenced by available genotype data and effect size estimates as well as the methodology employed in turning this information into model parameters (ie, weighted SNPs).
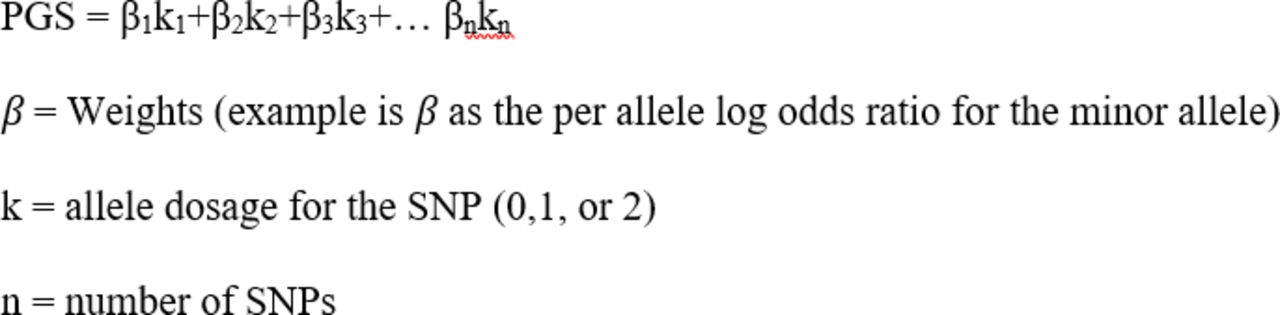
Polygenic score calculation. This calculation aggregates the SNPs and their weights selected for a polygenic score. Common diseases are thought to be influenced by many genetic variants with small individual effect sizes, such that meaningful risk prediction necessitates examining the aggregated impact of these multiple variants including their weightings. PGS, polygenic score.
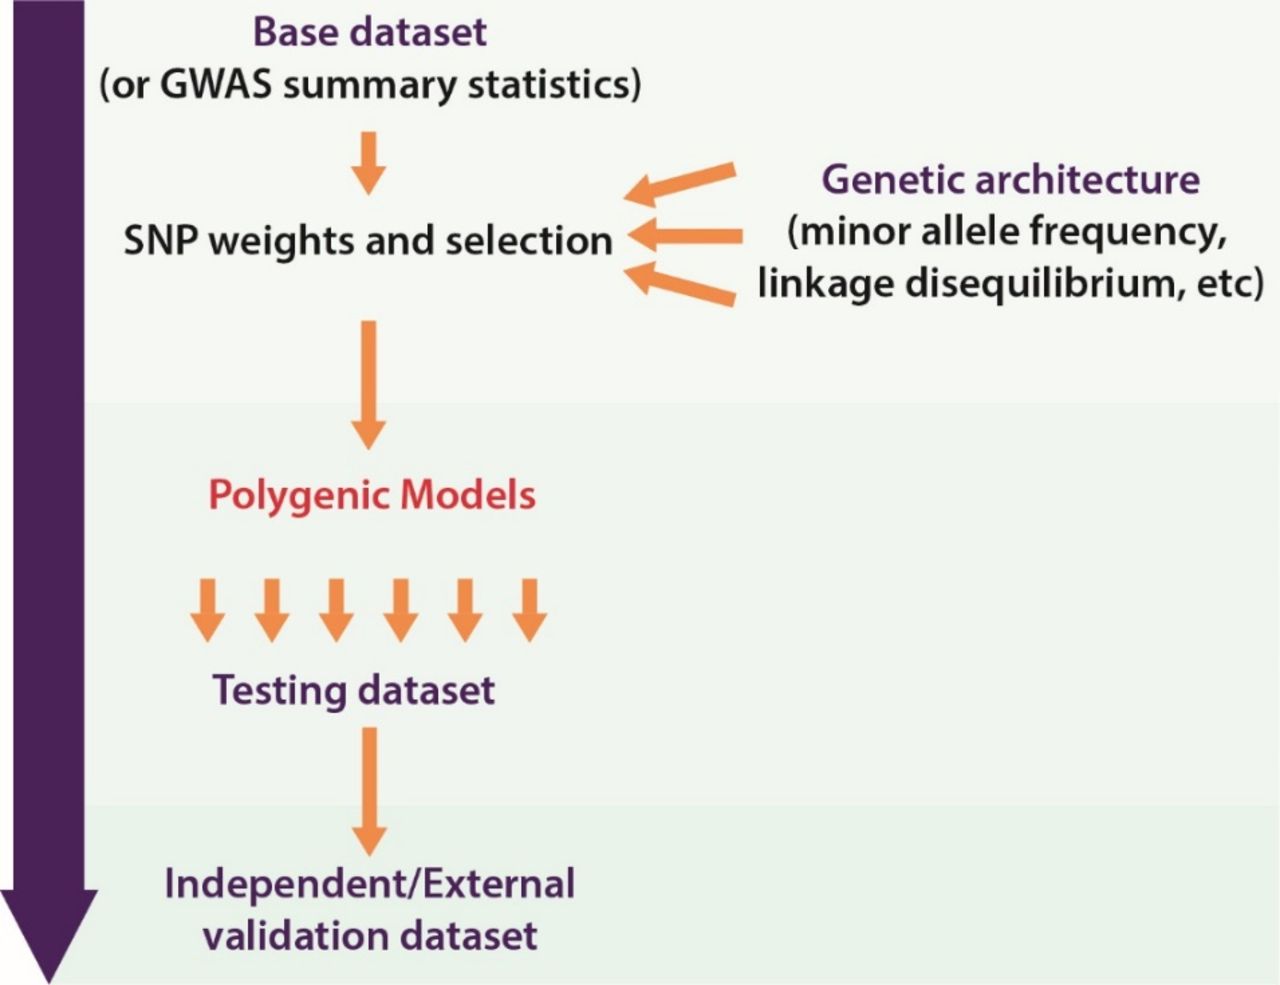
Construction of a polygenic score. In the process of developing a polygenic score, numerous models are tested and then compared. The model that performs best (as determined by one or more measures) is then selected for validation in the external data set. GWAS, genome-wide association studies.
Changes in data availability over time have had an impact on the approach taken in SNP selection and weighting. Early studies to identify variants associated with common diseases took the form of candidate gene studies. The small size of candidate gene studies, the limitation of technologies available for genotyping and stringent significance thresholds meant that these studies investigated fewer variants and those that were identified with disease associations had relatively large effect sizes.19 Taken together, this meant that a relatively small number of variants were available for consideration for inclusion in a polygenic model.20 21 Furthermore, weighting parameters for these few variants were often simplistic, such as counts of the number of risk alleles carried, ignoring their individual effect sizes.16
The advent of GWAS enabled assessment of SNPs across the genome, leading to the identification of a larger number of disease-associated variants and therefore more variants suitable for inclusion in a polygenic model. In addition, the increasing number of individuals in the association studies meant that the power of these studies increased, allowing for more precise estimates of effect sizes.19 Furthermore, some theorised that lowering stringent significance thresholds set for SNP–trait associations could also identify SNPs that might play a part in disease risk.11 16 This resulted in more options with respect to polygenic model parameters of SNPs to include and weights to assign to them. However, the inclusion of more SNPs and direct application of GWAS effect sizes as a weighting parameter does not always equate to better predictive performance.4 16 This is because GWAS do not provide perfect information with respect to the causal SNP, the effect sizes or the number of SNPs that contribute to the trait. Therefore, different methods have been developed to address these issues and optimise predictive performance of the score. Current common practice is to construct models with different iterations of SNPs and weighting, with assessment of the performance of each to identify the optimum configuration of SNPs and their weights (figure 2).
Methods used in SNP selection and weighting assignment
Some methods of model development will initially involve selection of SNPs followed by optimisation of weighting, whereas others may involve optimisation of weightings for all SNPs that have been genotyped using their overall GWAS effect sizes, the linkage disequilibrium (LD) and an estimate of the proportion of SNPs that are expected to contribute to the risk.22
LD is the phenomenon where some SNPs are coinherited more frequently with other SNPs due to their close proximity on the genome. Segments with strong LD between SNPs are referred to as haplotype blocks. This phenomenon means that GWAS often identify multiple SNPs in the same haplotype block associated with disease and the true causal SNP is not known. As models have started to assess more SNPs, careful consideration is required to take into account possible correlation between SNPs as a result of this phenomenon. Correlation between SNPs can lead to double counting of SNPs and association redundancy, where multiple SNPs in a region of LD are identified as being associated with the outcome. This can lead to reduction in the predictive performance of the model. Therefore, processes for filtering SNPs and using one SNP (tag SNP) to act as a marker in an area of high LD, through LD thinning, were developed. Through these processes SNPs correlated with other SNPs in a block are removed, by either pruning or clumping. Pruning ignores p value thresholds and ‘eliminates’ SNPs by a process of iterative comparison between a pair of SNPs to assess if they are correlated, and subsequently could remove SNPs that are deemed to have evidence of association. Clumping (also known as informed pruning) is guided by GWAS p values and chooses the most significant SNP, therefore keeping the most significant SNP within a block.23 This is all done with the aim of pinpointing relatively small areas of the genome that contribute to risk of the trait. Different significance thresholds may be used to select SNPs from this subgroup for inclusion in models.
Poor performance of a model can result from imperfect tagging with the underlying causal SNP.16 This is because the causal SNP that is associated with disease might not be in LD with the tag SNP that is in the model but is in LD with another SNP which is not in the model. This particularly occurs where the LD and variant frequency differs between population groups.24 An alternate approach to filter SNPs is stepwise regression where SNPs are selected based on how much the SNPs improve the model’s performance. This is a statistical approach and does not consider the impact of LD or effect size.
As described above, early studies used simple weighting approaches or directly applied effect sizes from GWAS as weighting parameters for SNPs. However, application of effect sizes as a weighting parameter directly from a GWAS may not be optimal, due to differences in the population that the GWAS was conducted in and the target population. Also as described above, LD and the fact that not all SNPs may contribute to the trait mean that these effect sizes from GWAS are imperfect estimates. Therefore, methods have been developed that adjust effect size estimates from GWAS using statistical techniques which make assumptions about factors such as the number of causal SNPs, level of LD between SNPs or knowledge of their potential function to better reflect their impact on a trait. Numerous statistical methodologies have been developed to improve weighting with a view to enhancing the discriminative power of a PGS.25 26 Examples of some methodological approaches are LDpred,22 winner’s curse correction,23 empirical Bayes estimation,27 shrinkage regression (Lasso),28 linear mixed models,29 with more being developed or tested. An additional improvement on the methods is to embed non-genetic information (eg, age-specific ORs).6 Determination of which methodology or hybrid of methodologies is most appropriate for various settings and conditions is continuously being explored and is evolving with new statistical approaches developing at a rapid pace.
In summary, model development has evolved in an attempt to gain the most from available GWAS data and address some of the issues that arise due to working with data sets which cannot be directly translated into parameters for prediction models. The different approaches taken in SNP selection and weighting, and the impact on the predictive performance of a model are important to consider when assessing different models. This is because different approaches to PGS modelling can achieve the same or a similar level of prediction. From a health system implementation perspective, particular approaches may be preferred following practical considerations and trade-offs between obtaining genotype data, processes for score construction and model performance. In addition, the degree to which these parameters need to be optimised will also be impacted by the input data and validation data set, and the quality control procedures that need to be applied to these data sets.12
Sources of input data for score construction
Key to the development of a polygenic model is the availability of data sets that can provide input parameters for model construction. Genotype data used in model construction can either be available as raw GWAS data or provided as GWAS summary statistics. Data in the raw format are individual-level data from a SNP array and may not have undergone basic quality control such as assessment of missingness, sex discrepancy checks, deviation from Hardy-Weinberg equilibrium, heterozygosity rate, relatedness or assessment for outliers.30 31 Availability of raw GWAS data allows for different polygenic models to be developed because of the richness of the data, however computational issues arise because of the size of the data sets. Data based on genome sequencing, as opposed to SNP arrays, could also be used in model construction. There have been limited studies of PGS developed from this form of data due to limitations in data availability, which is mainly due to cost restraints.15 32 Individual-level genomic data are also often not available to researchers due to privacy concerns.
Due to these issues, the focus of polygenic model development has therefore been on using well-powered GWAS summary statistics.33 These are available from open access repositories and contain summary information such as the allele positions, ORs, CIs and allele frequency, without containing confidential information on individuals. These data sets have usually been through the basic quality control measures mentioned above. There are, however, no standards for publicly available files, meaning some further processing steps may be required, in particular when various data sets are combined for a meta-analysis. Quality control on summary statistics is only possible if information such as missing genotype rate, minor allele frequency, Hardy-Weinberg equilibrium failures and non-Mendelian transmission rates is provided.12
Processing of GWAS data may include additional quality control steps, imputation and filtering of the SNP information, which can be done at the level of genotype or summary statistics data. SNP arrays used in GWAS only have common SNPs represented on them as they rely on LD between SNPs to cover the entire genome. As described above, one tag SNP on the array can represent many other SNPs. Imputation of SNPs is common in GWAS and describes the process of predicting genotypes that have not been directly genotyped but are statistically inferred (imputed) based on haplotype blocks from a reference sequence.33–35 Often association tests between the imputed SNPs and trait are repeated. As genotype imputation requires individual-level data, researchers have proposed summary statistics imputation as a mechanism to infer the association between untyped SNPs and a trait. The performance of imputation has been evaluated and shown that, with certain limitations, summary statistics imputation is an efficient and cost-effective methodology to identify loci associated with traits when compared with imputation done on genotypes.36
An alternative source of input data for the selection of SNPs and their weightings is through literature or in existing databases, where already known trait-associated SNPs and their effect sizes are used as the input parameters in model development. A number of studies have taken this approach37 38 and it is possible to use multiple sources when developing various polygenic models and establishing the preferred parameters to use.
Currently, there does not appear to be one methodology that works across all contexts and traits, each trait will need to be assessed to determine which method is the most suitable for the trait being evaluated. For example, four different polygenic model construction strategies were explored for three skin cancer subtypes4 by using data on SNPs and their effect sizes from different sources, such as the latest GWAS meta-analysis results, the National Human Genome Research Institute (NHGRI) EBI GWAS catalogue, UK Biobank GWAS summary statistics with different thresholds and GWAS summary statistics with LDpred. In this setting for basal cell carcinoma and melanoma, the meta-analysis and catalogue-derived models were found to perform similarly but that the latter was ultimately used as it included more SNPs. For squamous cell carcinoma the meta-analysis-derived model performed better than the catalogue-derived model. This demonstrates how each disease subtype, model construction strategy and data set can have their own limitations and advantages.
Knowledge of the sources of input data and its subsequent use in model development is important in understanding the limitations of available models. Models that are developed using data sets that reflect the population in which prediction is to be carried out will perform better. For example, data collected from a symptomatic or high-risk population may not be suitable as an input data set for the development of a polygenic model that will be used for disease prediction in the general population. Large GWAS studies were previously focused on high-risk individuals, such as patients with breast cancer with a strong family history or known pathogenic variants in BRCA1 or BRCA2. These studies would not be suitable for the development of PGS for use in the general population but can inform risk assessment in high-risk individuals. The source of the data for SNP selection and weighting also has implications for downstream uses and validation. For example, variant frequency and LD patterns can vary between populations and this can translate to poor performance of the polygenic model if the external validation population is different from that of the input data set.39–41 Furthermore, the power and validity of polygenic analyses are influenced by the input data sources.12 42
From a model to a score
PGS can be calculated using one of the methodologies discussed above. The resulting PGS units of measurement depend on which measurement is used for the weighting.12 For example, the weightings may have been calculated based on logOR for discrete traits or linear regression coefficient (β/beta) in continuous traits from univariate regression tests carried out in the GWAS. The resulting scores are then usually transformed to a standard normal distribution to give scores ranging from −1 to 1, or 0 to 100 for ease of interpretation. This enables further examination of the association between the score and a trait and the predictive ability of different scores generated by different models. Similar to other biomarker analyses, this involves using the PGS as a predictor of a trait with other covariates (eg, age, smoking, and so on) added, if appropriate, in a target sample. Examination of differences in the distribution of scores in cases and controls, or by examining differences in traits between different strata of PGS can enable assessment of predictive ability (figure 3). Common practice is for individual-level PGS values to be used to stratify populations into distinct groups of risk based on percentile cut-off or threshold values (eg, the top 1%).

Example distribution of polygenic scores across a population. Thresholds can be set to stratify risk as low (some), average (most) and high (some).
Model validation
Polygenic model development is reliant on further data sets for model testing and validation and the composition of these data sets is important in ensuring that the models are appropriate for a particular purpose. The development of a model to calculate a PGS involves refinement of the previously discussed input parameters, and selection of the ‘best’ of several models based on performance (figure 2). Therefore, a testing/training data set is often required to assess the model’s ability to accurately predict the trait of interest. This is often a data set that is independent of the base/input/discovery data set. It may comprise a subset of the discovery data set that is only used for testing and was not included in the initial development of the model but should ideally be a separate independent data set.
Genotype and phenotype data are needed in these data sets. Polygenic models are used to calculate PGS for individuals in the training data set and regression analysis is performed with the PGS as a predictor of a trait; other covariates may also be included, if appropriate. This testing phase can be considered a process for identifying models with better overall performance and/or informing refinements needed. Hence, this phase often involves comparison of different models that are developed using the same input data set to identify those models that have optimal performance.
The primary purpose is to determine which model best discriminates between cases and controls. The area under the curve (AUC) or the C-statistic is the most commonly used measure in assessing discriminative ability. It has been criticised as being an insensitive measure that is not able to fully capture all aspects of predictive ability. For instance, in some instances, AUC can remain unchanged between models but the individuals within are categorised into a different risk group.43 Alternative metrics that have been used to evaluate model performance include increase in risk difference, integrated discrimination improvement, R2 (estimate of variance explained by the PGS after covariate adjustment), net classification index and the relative risk (highest percentile vs lowest percentile). A clear understanding on how to interpret the performance within various settings is important in determining which model is most suitable.44
As per normal practice when developing any prediction model, polygenic models with the optimal performance in a testing/training data set should be further validated in external data sets. External data sets are critical in validation of models and assessment of generalisability, hence must also conform to the desired situations in which a model is to be used. The goal is to find a model with suitable parameters of predictive performance in data sets outside of those in which it was developed. Ideally, external validation requires replication in independent data sets. Few existing polygenic models have been validated to this extent, the focus being rather on the development of new models rather than evaluation of existing ones. One example where replication has been carried out is in the field of CAD, where the GPSCAD 45 and metaGRSCAD 10 polygenic models (both developed using UK Biobank data) were evaluated in a Finnish population cohort.46 Predictive ability was found to be lower in the Finnish population. This is likely to be due to the differences in genetic structure of this population and the population of the data set used for polygenic model development. Research is ongoing to evaluate polygenic models in other populations and strategies are being developed to ensure the same performance when used more widely, possibly through reweighting and adjustment of the scores.47
Moving towards clinical applications
PGS are thought to be useful information that could improve risk estimation and provide an avenue for disease prevention and deciding treatment strategies. There are indications from a number of fields that genetic information in the form of PGS can act as independent biomarkers and aid stratification.11 16 48 However, the clinical benefits of stratification using a PGS and the implications for clinical practice are only just beginning to be examined. The use of PGS as part of existing risk prediction tools or as a stand-alone predictor has been suggested. This latter option may be true for diseases where knowledge or predictive ability with other risk factors is limited, such as in prostate cancer.49 In either case, polygenic models need to be individually examined to determine suitability and applicability for the specific clinical question.50 Despite some commercial companies developing PGS,51 52 currently PGS are not an established part of clinical practice.
Integration into clinical practice requires evaluation of a PGS-based test. An important concept to consider in this regard is the distinction between an assay and a test. This has been previously discussed with respect to genetic test evaluation.53 54 It is worth examining this concept as applied to PGS, as their evaluation is reliant on a clear understanding of the test to be offered. As outlined by Zimmern and Kroese,54 the method used to analyse a substance in a sample is considered the assay, whereas a test is the use of an assay within a specific context. With respect to PGS, the process of developing a model to derive a score can be considered the assay, while the use of this model for a particular disease, population and purpose can be considered the test. This distinction is important when assessing if studies are reporting on assay performance as opposed to test performance. It is our view that, with respect to polygenic models, progress has been made with respect to assay development, but PGS-based tests are yet to be developed and evaluated. This can enable a clearer understanding of their potential clinical utility and issues that may arise for clinical implementation.11 18 55 It is clear that this is still an evolving field, and going forward different models may be required for different traits due to their underlying genetic architecture,26 different clinical contexts and needs.
Clinical contexts where risk stratification is already established practice are most likely where implementation of PGS will occur first. Risk prediction models based on non-genetic factors have been developed for many conditions and are used in clinical care, for example, in cardiovascular disease over 100 such models exist.56 In such contexts, how a PGS and its ability to predict risk compared with, or improves on, these existing models is being investigated.3 44 57–61 The extent to which PGS improves prediction, as well as the cost implications of including this, is likely to impact on implementation.
Integration of PGS into clinical practice, for any application, requires robust and validated mechanisms to generate these scores. Therefore, given the numerous models available, an assessment of their suitability as part of a test is required. Parameters or guidelines with respect to aspects of model performance and metrics that could assist in selecting the model to take forward as a PGS-based test are limited and need to be addressed. Currently, there are different mechanisms to generate PGS and have arisen in response to the challenges in aggregating large-scale genomic data for prediction. For example, a review reported 29 PGS models for breast cancer from 22 publications.62 Due to there being a number of different methodologies to generate a score, numerous models may exist for the same condition and each of the resulting models could perform differently. Models may perform differently because the population, measured outcome or context of the development data sets used to generate the models is diverse, for example, a score for risk of breast cancer versus a breast cancer subtype.44 63 This diversity, alongside the lack of established best practice and standardised reporting in publications, makes comparison and evaluation of polygenic models for use in clinical settings challenging. It is clear that moving the field forward is reliant on transparent reporting and evaluation. Recommendations for best practices on the reporting of polygenic models in literature have been proposed14 64 as well as a database,65 66 which could allow for such comparisons. Statements and guidelines for risk prediction model development, such as the Genetic Risk Prediction Studies and Transparent Reporting of a Multivariable Prediction Model for Individual Prognosis or Diagnosis (TRIPOD), already exist, but are not consistently used. TRIPOD explicitly covers the development and validation of prediction models for both diagnosis and prognosis, for all medical domains.
One clear issue is generalisability and drop in performance of polygenic models once they are applied in a population group different from the one in which they were developed.22 46 67–70 This is an ongoing challenge in genomics as most GWAS, from which most PGS are being developed, have been conducted in European-Caucasian populations.71 Efforts to improve representation are underway72 and there are attempts to reweight/adjust scores when applied to different population groups which are showing some potential but need further research.47 Others have demonstrated that models developed in more diverse population groups have improved performance when applied to external data sets in different populations.24 73 It is important to consider this issue when moving towards clinical applications as it may pose an ethical challenge if the PGS is not generalisable.
A greater understanding of different complex traits and the impact of pleiotropy is only beginning to be investigated.74 There is growing appreciation of the role of pleiotropy as multiple variants have been identified to be associated with multiple traits and exert diverse effects, providing insight into overlapping mechanisms.75 76 This, together with the impact of population stratification, genetic relatedness, ascertainment and other sources of heterogeneity leading to spurious signals and reduced power in genetic association studies, all impacting on the predictive ability of PGS in different populations and for different diseases.
While many publications report on model development and evaluation, often there is a lack of clarity on intended purpose,50 77 leading to uncertainties as to the clinical pathways in which implementation is envisaged. A clear description of intended use within clinical pathways is a central component in evaluating the use of an application with any form of PGS and in considering practical implications, such as mechanisms of obtaining the score, incorporation into health records, interpretation of scores, relevant cut-offs for intervention initiation, mechanisms for feedback of results and costs, among other issues. These parameters will also be impacted by the polygenic model that is taken forward for implementation. Meaning that there are still some important questions that need to be addressed to determine how and where PGS could work within current healthcare systems, particularly at a population level.78
It is widely accepted that genotyping using arrays is a lower cost endeavour in comparison to genome sequencing, making the incorporation of PGS into routine healthcare an attractive proposition. However, we were unable to find any studies reporting on the use or associated costs of such technology for population screening. Studies are beginning to examine use case scenarios and model cost-effectiveness, but this has only been in very few, specific investigations.79 80 Costs will also be influenced by the testing technology and by the downstream consequences of testing, which is likely to differ depending on specific applications that are developed and the pathways in which such tests are incorporated. This is particularly the case in screening or primary care settings, where such testing is currently not an established part of care pathways and may require additional resources, not least as a result of the volume of testing that could be expected. Moving forward, the clinical role of PGS needs to be developed further, including defining the clinical applications as well as supporting evidence, for example, on the effect of clinical outcomes, the feasibility for use in routine practice and cost-effectiveness.
Conclusion
There is a large amount of diversity in the PGS field with respect to model development approaches, and this continues to evolve. There is rapid progress which is being driven by the availability of larger data sets, primarily from GWAS and concomitant developments in statistical methodologies. As understanding and knowledge develops, the usefulness and appropriateness of polygenic models for different diseases and contexts are being explored. Nevertheless, this is still an emerging field, with a variable evidence base demonstrating some potential. The validity of PGS needs to be clearly demonstrated, and their applications evaluated prior to clinical implementation.
References
Footnotes
Twitter @ChantalResearch, @PHGFoundation
Contributors CBdV, MK and SM all contributed to the planning and reporting of the work. CBdV and SM both conducted the work.
Funding The authors have not declared a specific grant for this research from any funding agency in the public, commercial or not-for-profit sectors.
Competing interests None declared.
Patient consent for publication Not required.
Provenance and peer review Not commissioned; externally peer reviewed.