Article Text

Abstract
Background Heritability estimates have revealed an important contribution of SNP variants for most common traits; however, SNP analysis by single-trait genome-wide association studies (GWAS) has failed to uncover their impact. In this study, we applied a multitrait GWAS approach to discover additional factor of the missing heritability of human anthropometric variation.
Methods We analysed 205 traits, including diseases identified at baseline in the GCAT cohort (Genomes For Life- Cohort study of the Genomes of Catalonia) (n=4988), a Mediterranean adult population-based cohort study from the south of Europe. We estimated SNP heritability contribution and single-trait GWAS for all traits from 15 million SNP variants. Then, we applied a multitrait-related approach to study genome-wide association to anthropometric measures in a two-stage meta-analysis with the UK Biobank cohort (n=336 107).
Results Heritability estimates (eg, skin colour, alcohol consumption, smoking habit, body mass index, educational level or height) revealed an important contribution of SNP variants, ranging from 18% to 77%. Single-trait analysis identified 1785 SNPs with genome-wide significance threshold. From these, several previously reported single-trait hits were confirmed in our sample with LINC01432 (p=1.9×10⁻⁹) variants associated with male baldness, LDLR variants with hyperlipidaemia (ICD-9:272) (p=9.4×10⁻¹⁰) and variants in IRF4 (p=2.8×10−57), SLC45A2 (p=2.2×10−130), HERC2 (p=2.8×10−176), OCA2 (p=2.4×10−121) and MC1R (p=7.7×10⁻²²) associated with hair, eye and skin colour, freckling, tanning capacity and sun burning sensitivity and the Fitzpatrick phototype score, all highly correlated cross-phenotypes. Multitrait meta-analysis of anthropometric variation validated 27 loci in a two-stage meta-analysis with a large British ancestry cohort, six of which are newly reported here (p value threshold <5×10⁻⁹) at ZRANB2-AS2, PIK3R1, EPHA7, MAD1L1, CACUL1 and MAP3K9.
Conclusion Considering multiple-related genetic phenotypes improve associated genome signal detection. These results indicate the potential value of data-driven multivariate phenotyping for genetic studies in large population-based cohorts to contribute to knowledge of complex traits.
- gwas
- cohort
- complex traits
- multitrait
- phenome
This is an open access article distributed in accordance with the Creative Commons Attribution Non Commercial (CC BY-NC 4.0) license, which permits others to distribute, remix, adapt, build upon this work non-commercially, and license their derivative works on different terms, provided the original work is properly cited, appropriate credit is given, any changes made indicated, and the use is non-commercial. See: http://creativecommons.org/licenses/by-nc/4.0/.
Statistics from Altmetric.com
Introduction
Common disorders cause 85% of deaths in the European Union (EU).1 The increasing incidence and prevalence of cancer, cardiovascular diseases, chronic respiratory diseases, diabetes and mental illness represent a challenge that leads to extra costs for the healthcare system. Moreover, as European population is getting older, this scenario will be heightened in the next few years. Like complex traits, many common diseases are complex inherited conditions with genetic and environmental determinants. Advancing in their understanding requires the use of multifaceted and long-term prospective approaches. Cohort analyses provide an exceptional tool for dissecting the architecture of complex diseases by contributing knowledge for evidence-based prevention, as exemplified by the Framingham Heart Study2 or the European Prospective Investigation into Cancer and Nutrition cohort study.3
In the last decades, high performance DNA genotyping technology has fuelled genomic research in large cohorts, having been the most promising line in research on the aetiology of most common diseases. Genome-wide association studies (GWAS) have provided valuable information for many single conditions.4 Despite the perception of the limitations of the GWAS analyses, efforts combining massive data deriving from whole-genome sequencing at population scale with novel conceptual and methodological analysis frameworks have been set forth to explore the last frontier of the missing heritability issue,5 driving the field of genomic research on complex diseases to a new age.6Pritchard and colleagues recently proposed the breakthrough idea of the omnigenic character of genetic architecture of diseases and complex traits.7 They suggested that beyond a handful of driver genes (ie, core genes) directly connected to an illness, the missing heritability could be accounted for by multiple genes (ie, peripheral genes) not clustered in functional pathways, but dispersed along the genome, explaining the pleiotropy frequently seen in most complex traits. Core genes have been already outlined by the GWAS approach, but most of the possible contributing genes have been disregarded based on methodological issues such as p value or lower minor allele frequency (MAF). Pathway disturbances have also been a landmark in the search for genetic associations,8 but not always appear to the root of the mechanism of inheritance of complex diseases, at least for peripheral genes.7 With this challenging vision, a multitrait genome association analysis of the whole phenome9 becomes a more appropriate way to detect peripheral gene variation effects and new network disturbances affecting core genes. Multitrait analysis approaches are developed for research of genetically complex conditions using raw or summary-level data statistics from GWAS in order to explain the largest possible amount of the covariation between SNPs and traits.10–15
The contribution of total genetic variation, known as heritability (broad-sense heritability, h 2), is estimated now from genome-wide studies in large cohorts directly from SNP data (known as h2SNP). However, even if most disease conditions have a strong genetic basis, it is well known that our capacity to find genetic effects depends on the overall genetic contribution of the trait. Overall estimations differed depending on the ancestry, sample ascertainment, gender and age of the population under study. Recently, data from the UK Biobank determined genetic contributions with a phenome-based approach16 and identified a shared familial environment as a significant important factor besides genetic heritability values in 12 common diseases analysed.17
In this study, we present new data on phenotype-wide estimation of the heritability of 205 complex traits (including diseases) and new insights into the genetics of anthropometric traits in a Mediterranean Caucasian population using a two-stage meta-analysis approach with multiple-related phenotypes (MRPs).
Materials and methods
Population
The methodology of the GCAT study has been previously described.18 Briefly, the subjects of the present study are part of the GCAT project, a prospective study that includes a cohort of a total of 19 267 participants recruited from the general population of Catalonia, a western Mediterranean region in the Northeast of Spain. Healthy general population volunteers between 40 and 65 years with the sole condition of being users of the Spanish National Health Service were invited to be part of the study mostly through the Blood and Tissue Bank, a public agency of the Catalan Department of Health. All eligible participants signed an informed consent agreement form and answered a comprehensive epidemiological questionnaire. Anthropometric measures and blood samples were also collected at baseline by trained healthcare personnel. The GCAT study was approved by the local ethics committee (Germans Trias University Hospital) in 2013 and started on 2014.
Study participants
This study analyses the GCATcore data, a subset of 5459 participants (3066 women) with genotype data belonging to the interim GCATdataset, August 2017 (see the URLs section). GCATcore participants were randomly selected from whole cohort based on overall demographic distribution (ie, gender, age, residence). In this study, in order to increase the robustness of heritability estimates, only Caucasian participants with a Spanish origin (based on principal component analysis (PCA) analysis, see later in this section) and with available genetic data were finally included: 4988 GCAT participants (2777 women). All samples passed genotyping quality control (QC) (see later in this section).
Phenome
Baseline variables were obtained from a self-reported epidemiological questionnaire and included biological traits, medical diagnoses, drug use, lifestyle habits and sociodemographic and socioeconomic variables.18 Description of GCAT variables dataset is available at GCAT (see the URLs section). To keep as many as possible of the genotyped samples in the study, we imputed anthropometric missing values (<1%) from the overall distribution values using statistical approaches. Missing values (<1%) for biological and anthropometric measures (height, weight, waist and hip circumference, systolic and diastolic blood pressure and heart rate) were imputed by stratifying the whole GCAT cohort by gender and age and using multiple imputation by the fully conditional specification method, implemented in the R mice package.19 For GWAS analysis, we retained all variables with at least five observations (n=205). For heritability estimates, only variables with at least 500 individuals per class were retained (n=96) for robustness. The description of the traits and measures included in this study is summarised in online supplementary table S1.
Supplementary file 1
Genotyping, relatedness and population structure
Genotyping of the 5459 GCAT participants (GCATcore) was done using the Infinium Expanded Multi-Ethnic Genotyping Array (MEGAEx) (ILLUMINA, San Diego, California, USA). A customised cluster file was produced from the entire sample dataset and used for joint calling. We applied PCA to detect any hidden substructure and the method of moments for the estimation of identity by descent probabilities to exclude cases with cryptic relatedness. The extensive QC protocol used for cluster analysis and call filtering is accessible at GCAT (see the URLs section) and presented as supplementary material (online supplementary file S1). Briefly, GCAT participants were excluded from the analysis for different reasons, including poor call rate <0.94 (n=61), gender mismatch (n=19), duplicates (n=8), family relatedness up to second degree (n=88) and excess or loss of heterozygosity (n=52). Non-Caucasian individuals detected as outliers in the PCA plot of the European populations from the 1000 Genomes Project (n=96) and born outside of Spain (n=147) were also excluded from the study. After QC and filtering, 4988 GCAT participants and 1 652 023 genetic variants were included. Genotyping was performed at the PMPPC-IGTP High Content Genomics and Bioinformatics Unit.
Supplementary file 2
Multipanel imputation
For imputation analysis, 665 592 SNPs were included (40%). Sexual and mitochondrial chromosomes were discarded as well as autosomal chromosome variants with MAF <0.01 and AT-CG sites. We followed a two-stage imputation procedure, which consists of prephasing the genotypes into whole chromosome haplotypes followed by imputation itself.20 The prephasing was performed using SHAPEIT2, and genotype imputation was performed with IMPUTE2. As reference panels for genotype imputation, we used the 1000 Genomes Project phase 3,21 the Genome of the Netherlands,22 UK10K23 and the Haplotype Reference Consortium.24 All variants with IMPUTE2 info <0.7 were removed. After imputing the genotypes using each reference panel separately, we combined the results selecting the variants with a higher info score when they were present in more than one reference panel. The SNP dosage from IMPUTE2 was transformed to binary PLINK format by using the ‘-hard-call-threshold 0.1’ flag from PLINK. The final core set had approximately 15 million variants with MAF>0.001 and 9.5 million variants with MAF>0.01. Imputation was performed at the Barcelona Supercomputing Center.
Heritability
Trait SNP heritability (h2 SNP) was estimated from SNP/INDEL array/imputed data with the GREML-LDMS method implemented in the GCTA software.25 Since this method is relatively unbiased regarding MAF and linkage disequilibrium (LD) parameters, we considered autosomal variants with MAF>0.001 (15 060 719 SNPs) to avoid under/overestimation of heritability due to the relatively small sample analysed in the core study. Cryptic relatedness of distant relatives was also considered, and individuals whose relatedness in the genetic relationship matrix was >0.025 were discarded (n=4717). Population stratification was controlled in the linear mixed model using the first 20 principal components of the PCA derived from population genetic structure analysis of the GCAT. Gender and age were also included as covariates in the model. The h2 SNPCIs were calculated by using FIESTA.26
Single-trait genome-wide association analysis
We performed independent GWAs analyses for 205 selected traits (61 continuous and 144 binary). A total of 9 499 600 SNPs with MAF>0.01 were considered for this purpose. Linear regression models for continuous traits were assessed with PLINK.27 For binary traits, given the unbalanced design of most of the traits considered, we used a scoring test with saddle point approximation included in the SPAtest R package.28 This approach compensates a slight loss of power with the inclusion of uncommon and rare conditions, without affecting robustness. All the models included the first 20 PCAs, age and gender as covariates. A PCA-mixed analysis was applied to approximate the number of independent traits29 (online supplementary figure S1). Based on these figures, Bonferroni correction for multiple traits was defined at p<5×10⁻¹⁰ accounting for 100 independent traits explaining 80% of the phenome variability.
Supplementary file 3
Multitrait meta-analysis for correlated traits
We applied a multitrait approach for the analysis of anthropometric traits (weight, height, body mass index (BMI) and waist and hip circumference) in a two-stage association study using individuals of British ancestry from the UK Biobank cohort (N=336 107).30 Waist-to-hip ratio was excluded from this analysis due to its unavailability from the UK Biobank resource. UK Biobank summary-level statistics was calculated using linear regression models with the inferred gender and the first 10 PCAs as covariates, similarly to the model applied on GCAT data (see the URLs section). All SNPs with suggestive association p<1x10⁻⁵ for any trait were retained from the GCAT GWAS analysis. Then, only SNPs intersecting with the UK Biobank resource were used for multitrait meta-analysis association testing in both samples, and p<5x10⁻⁹was considered significant. The multitrait association testing was based on the distribution of the sum of squares of the z scores which is insensitive to the direction of the scores.31 Briefly, let Z = ( ,
,  , …,
, …,  ) be the z scores for a given SNP for k phenotypes. The sum of squares of the z scores,
  , can be approximated by the χ2 distribution (
 ). Let
Σ
be the covariance matrix of the genome-wide z scores from the phenotypes under analysis. And let
). Let
Σ
be the covariance matrix of the genome-wide z scores from the phenotypes under analysis. And let  be the eigenvalues of
Σ
, the distribution of
be the eigenvalues of
Σ
, the distribution of  is well approximated by
  , where a, b and d depend on
  . Then, we calculated the p value as:
  . To estimate the covariance matrix of the correlated traits, we selected independent SNPs (LD pruning in PLINK “--indep-pairwise 50 5 0.2”) and filtered out SNPs with |z scores|>1.96 to avoid possible bias in the estimation of
Σ
because of the difference in sample size and association p values in the GCAT-UK Biobank. A summary flow chart of the methods applied in this study is shown in figure 1.
. To estimate the covariance matrix of the correlated traits, we selected independent SNPs (LD pruning in PLINK “--indep-pairwise 50 5 0.2”) and filtered out SNPs with |z scores|>1.96 to avoid possible bias in the estimation of
Σ
because of the difference in sample size and association p values in the GCAT-UK Biobank. A summary flow chart of the methods applied in this study is shown in figure 1.

Flow chart of the methods and criteria used in this study. GCAT, Genomes For Life- Cohort Study of the Genomes of Catalonia; GWAS, genome-wide association studies; MAF, minor allele frequency; QC, quality control.
Polygenic risk score
Genetic architecture was analysed by the polygenic risk score (PRS). Polygenic risk score software (PRSice)32 was used to predict the genetic variability of the identified loci for a given trait. PRSice plots the percentage of variance explained for a trait by using SNPs with different p value thresholds (PT) (online supplementary figure S2). Here, we considered PT=0.05.
Supplementary file 4
URLs
GCAT study, http://genomesforlife.com;
National Human Genome Research Institute GWAS Catalog, http://www.genome.gov/gwastudies/ (gwas_catalog_v1.0-associations_e91_r2018-02-06);
1000 Genomes Project http://www.internationalgenome.org/ (phase 3, v5a.20130502);
Genome of Netherland http://www.nlgenome.nl/ (Release 5.4);
UK10K https://www.uk10k.org/ (Release 2012-06-02, updated on 15 Feb 2016) ;
Haplotype Reference Consortium http://www.haplotype-reference-consortium.org/(Release 1.1);
UKBiobank GWAS Results; https://sites.google.com/broadinstitute.org/ukbbgwasresults/home?authuser=0, (Manifest20170915);
GTExportal, https://www.gtexportal.org/home/. (last data accession, Release V.7, dbGaP accession phs000424. v7. P2);
Results
Heritability estimates
SNP heritability estimation (h2 SNP) in the GCATcore study showed values ranging from 77% to 18%, with height being the trait showing the strongest SNP contribution. The h2 SNP SE for most traits was high (near 10%), with wide CIs, as expected by sample size. However, robustness of the analysis is supported by similar values to those reported elsewhere (see wide summary in Genome-wide complex trait analysis, Wikipedia. The Free Encyclopedia, 2018). Statistically significant h2 SNP estimations for continuous and binary traits (cases >500) are shown in table 1. In particular, values for height: h2 SNP=0.77, 95% CI0.56 to 0.94 and BMI: h2 SNP=0.38, 95% CI0.20 to 0.59 were identical to the maxima achieved in other European populations, using comparable genomic approaches. Besides the anthropometric traits, the Fitzpatrick’s phototype score, a numerical classification schema for human skin colour to measure the response of different types of skin to ultraviolet light, had a high genetic consistency in our sample (h2 SNP=0.63, 95% CI 0.4 to 0.8), and concordantly all related categories (eye colour, hair colour, freckling and skin sensitivity) showed high heritability (h2 SNP>0.3). It is worth noting that skin colour had the lowest value (h2 SNP=0.18, 95% CI 0.02 to 0.38), which is in concordance with the blurred genetic architecture of skin colour.33 Interestingly, other non-biological traits showed relatively high values in our study. Educational level showed the third highest heritability value (h2 SNP=0.54, 95% CI 0.35 to 0.74). Lower estimates have been observed in other Caucasian populations, but this could be explained by the fact that this estimate is for educational level as a categorical variable and not as binary (higher/lower). Self-perceived health was similar to h2 SNP from recent data from a larger UK Biobank study,16 with values around 20% (h2 SNP=0.22, 95% CI 0.04 to 0.43).
h2 SNP of the analysed traits with h2 SNP>0, SE <0.12, p<0.05 and nb >500
Phenome analysis
GWAS identified 6820 associations in 1785 SNPs with genome-wide significance threshold p<5×10⁻⁸ and 29 343 associations with a suggestive association p<1×10⁻⁵. Here, we report 26 genome-wide association hits identified in our study which confirm results previously identified in other European ancestry samples (GWAS Catalog database (release V.1.0, e90, 27 September 2017)).4 In table 2, we show the SNP associations with the minimum p value for each locus, the remaining SNPs are shown in online Supplementary file 5. Five genes associated with pigmentary traits were identified in the analysis with highly significant SNP associations: SLC45A2 (rs16891982, β=−0.546, SE=0.021, p=2.2×10−130), IRF4 (rs12203592, β=1.915, SE=0.118, p=2.8×10−57), HERC2 (rs1667394, β=−0.608, SE=0.02, p=2.8×10−176), OCA2 (rs11855019, β=−0.548, SE=0.022, p=2.4×10−121) and MC1R (rs1805007, β=3.615, SE=0.326, p=7.7×10⁻²²) (online supplementary figure S3). These genes are involved in the regulation and distribution of melanin pigmentation or enzymes involved in melanogenesis itself within the melanocyte cells present in the skin, hair and eyes in Caucasian populations.33–35 Pigmentary traits (mainly the red hair colour phenotype) are related to the defensive capacity of the skin in response to sun exposure (UV-induced skin tanning or sun burning), and it has been established as a risk factor for sun-induced cancers (both melanoma and non-melanocytic skin cancers).36 Other GWAS hits from the phenome-wide analysis validated previously reported findings in CCDC141-LOC105373766 (rs79146658, β=2.359, SE=0.374, p=3.4×10⁻¹⁰), SMARCA4-LDLR (rs10412048, β=−0.5, SE=0.079, p=3.2×10⁻¹⁰; rs6511720, β=−0.493, SE=0.08, p=9.4×10⁻¹⁰) and LINC01432 (rs1160312, β=0.193, SE=0.03, p=1.9×10⁻⁹) loci, related with cardiovascular risk (heart_rate), hyperlipidaemia (icd9_code3_272) and male pattern baldness (hair_loss_40), respectively (see table 2).
Supplementary file 5
Supplementary file 6
Twenty-six genome-wide associated loci with GCAT traits and reported in the GWAS Catalog
Multitrait meta-analysis of anthropometric traits
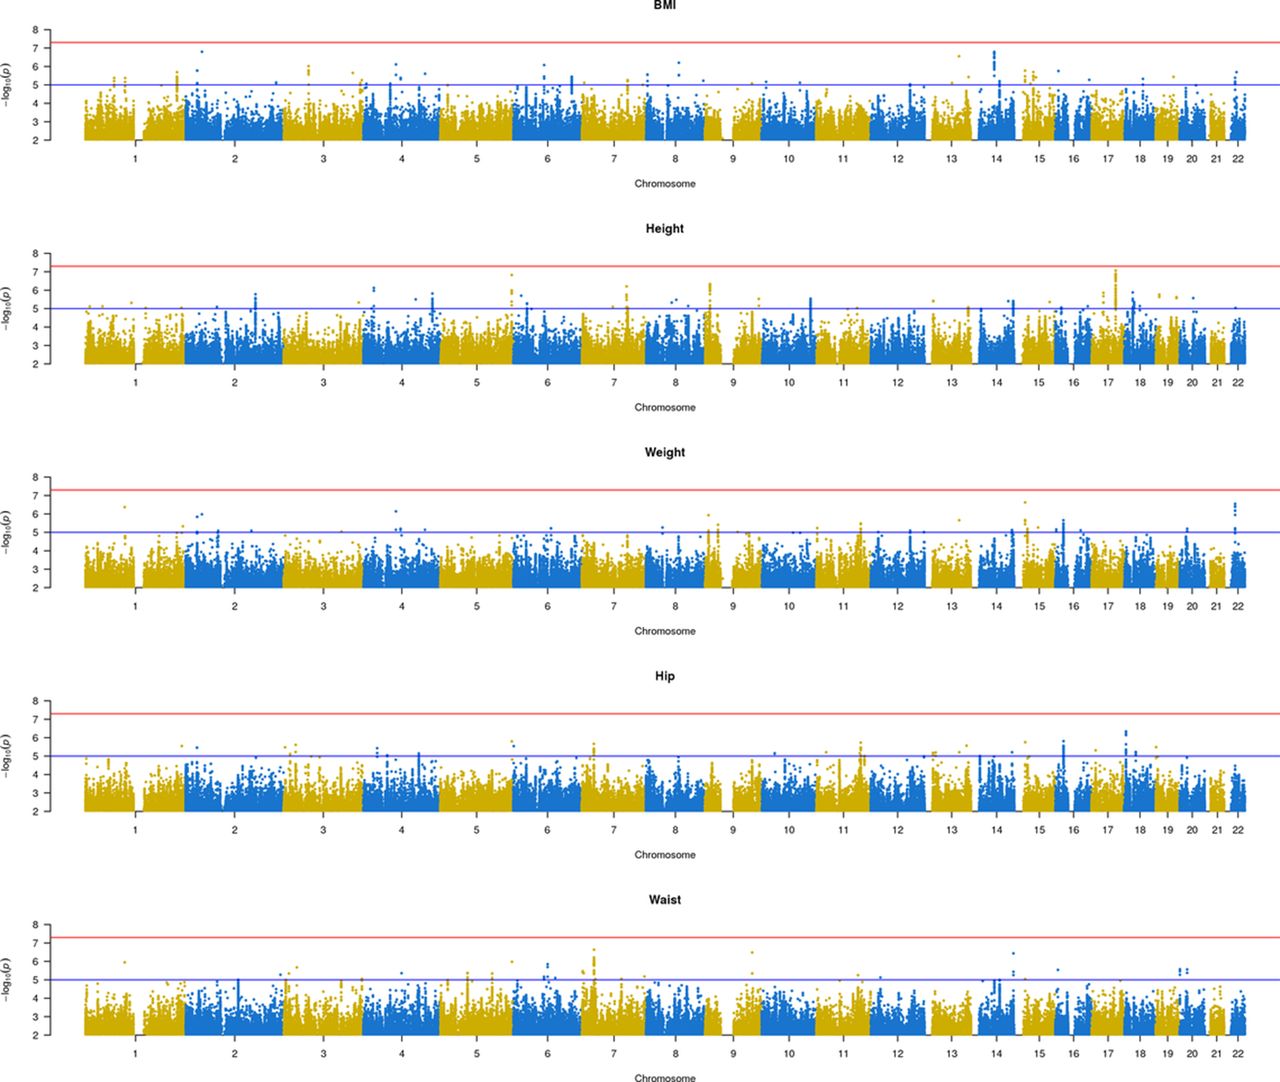
Anthropometric traits had a high heritability in our sample (height=77%, BMI=38%, weight=37%, hip circumference=31% and waist circumference=24%), and all were highly correlated (online supplementary figure S1). In the first stage, from single-trait GWAS, we retained 606 SNPs with suggestive association (p<1×10⁻⁵) (see figure 2). None of them reached the genome-wide significance threshold. In the second stage, we analysed those 476 SNPs that intersected with the UK Biobank cohort dataset. Multitrait meta-analysis identified 111 SNPs in 27 independent loci with p<5×10⁻⁹ (online Supplementary file 7). Table 3 shows the SNPs with the highest significance for each independent loci and the univariate summary statistics of the anthropometric traits in both cohorts.
Supplementary file 7

Manhattan plot of the anthropometric traits (BMI, height, weight and hip and waist circumference) from the GCAT. BMI, body mass index.
Loci associated with anthropometric traits in GCAT and UK Biobank cohorts
We estimated the covariance matrix (Σ) for each dataset (GCAT, UK Biobank and GCAT +UK Biobank). Then, as described in the Materials and methods section, we selected those independent SNPs with |z scores|<1.96, resulting in 765 646, 630 890 and 535 860 being considered for the Σ estimation. Eigenvalues of Σ showed d=1.36, 1.4 and 2.72 values. Covariance matrices were similar in both GCAT and UK Biobank (online supplementary tables S4 and S5). One degree of freedom (GCAT and UK Biobank) and three (GCAT +UK Biobank) of the 2 distribution were considered for multitrait analysis. We identified 27 independent multitrait loci associated in GCAT and UK Biobank (table 3). We intersected these SNPs with the GWAS Catalog, and we found that 5 SNPs had previously been reported in multiple GWAS, 16 loci were reported considering a ±250 000 base pair window from the identified SNP and 6 were new loci involving the following genes/SNPs: MAD1L1 (rs62444886, p=2.3×10⁻¹⁵), PIK3R1 (rs12657050, p=2.8×10⁻¹³; rs695166, p=8.4×10⁻¹⁵), ZRANB2-AS2 (rs11205277, p=1.4×10⁻⁹), EPHA7 (rs143547391, p=6.5×10⁻¹⁰), CACUL1 (rs12414412, p=4×10⁻¹³) and MAP3K9 (rs7151024, p=5.7×10⁻¹⁰). Regarding DPYD, DPYD-IT1 (rs140281723), GABRG3-AS1 and GABRG3 (rs184405367) genes/SNPs, we did not replicate association in UK Biobank samples (UKmulti p=0.035 and 1, respectively). The risk allele, frequency and functional annotation using the Variant Effect Predictor tool37 of identified variants are shown in online Supplementary file 9.
Supplementary file 8
Supplementary file 9
Polygenic risk score
The skin phototype association analysis identified five loci accounting for a high predictive value (PRS of 15.6%) suggesting few main genes (oligogenic architecture) contributing to the phenotype (online supplementary figure S2). However, for anthropometric traits, 27 loci were identified in our cohort but with a lower PRS (2.3%) suggesting a polygenic architecture with multiple genes and a high environmental impact. The newly identified loci only increased PRS slightly over the corresponding single-trait analysis (2.2% to 2.5%, 2.3% to 3.3%, 2.2% to 3.5%, 2.5% to 3.7% and 1.5% to 2.6% for height, weight, BMI and hip and waist circumference, respectively) pointing towards the multitrait approach as an effective screening strategy to identify new biomarkers.
Discussion
Dissecting the architecture of common diseases should incorporate multitrait approaches to understand the phenome and its genetic aetiology, including pleiotropy and the co-occurrence of multiple morbidities, correlated traits and the diseasome as targets for genomic analysis.38 In this study, we used the GCAT study, a South-European Mediterranean population prospective cohort to analyse the phenotypic variation attributable to genotype variability for 205 selected human traits (including diseases as well as biological, anthropometric and social features). Our results show that by considering genetic covariance matrices for interrelated traits, we increased the number of detected loci from six new loci for anthropometric traits, pointing to multitrait analysis as an effective strategy to gain statistical power to identify genetic association.
The relative importance of genetic and non-genetic factors varies across populations. Moreover, this is not constant in a population and changes with age.16 Here, we have reported heritability estimates on an adult population based on SNP data. In the present study, h2 SNP values move in a wide range from 18% to 77%, being anthropometric traits (height) and skin colour-related traits (Fitzpatrick’s phototype score) the traits with the highest genetic determination. In our cohort, heritability of anthropometric traits, such as height and BMI, was likely estimated as a maximum, with negligible missed heritability when comparing with other reported estimates in similar populations39 and in the same way being the observed genetic variance only a small part of their complete variance (around 3%). In the case of skin colour-related traits, the portion of the explained variance was larger, in accordance with a less complex polygenic nature of this trait, and fewer genes baring stronger predictive value (IRF4, HERC2, OCA2, MC1R and SLC45A2) (PRS=15.6%). The variants identified in these loci associated with skin colour-related traits are functional and have been reported elsewhere in several studies. These differences in heritability and prediction values indicate a different genomic architecture, suggesting an exposure variation, the exposome,3 as a main actor for many polygenic traits. Higher estimates in self-perceived health heritability, and probably some other reported traits such as ‘smoking_habits’, ‘smoking_packs’, or ‘sadness’ (item from the Mental-Health Inventory 5-item questionnaire), reflect a pleiotropic effect40 with multiple associated loci. In this sense, a recent meta-analysis on subjective well-being revealed new loci accounting for a polygenic model of well-being status.41
Single-trait GWAS analysis identified a number of genetic variants associated with skin colour-related traits (online supplementary figure S3) and other complex traits (heart rate, hyperlipidaemia or male pattern baldness); whereas failed to identify specific variants associated with any single anthropometric trait (at the p<5×10⁻⁸ threshold cut-off). However, we should observe that gender differences were not considered in this analysis even though it has been shown that genetic effects have a gender bias.42 Applying multitrait analyses of anthropometric traits, we identified 27 loci, six of which had not been reported previously; CALCUL1, ZRANB2-AS2, MAD1L1, EPHA7, PIK3R1 and MAP3K9. Owing to LD and the occurrence of all identified variants in non-coding regions (see online Supplementary file 9), we cannot be certain about the genes involved. Two out of six of the identified associated variants, in CALCUL1 and MAP3K9, are putative expression quantitative trait loci (eQTL) (see the URLs section). Three of the variants (ZRANB2-AS2chr1:71702511, EPHA7chr6:94075927 and MAP3K9chr14:71268446) are specific of the GCAT sample (p<5×10⁻⁹) (online Supplementary files 10,11, S,12) probably due to genetic background differences between populations (ie, LD patterns) or as an expression of a particular genetic contribution of the Mediterranean populations to these polygenic traits. Identified variants implicate genes with diverse functions, involved in several pathways and processes. Some of them are involved in growth, developmental or metabolic processes.
MAP3K9, mitogen-activated protein kinase 9, has been associated to some rare cancers (ie, retroperitoneum carcinoma and retroperitoneum neuroblastoma), and GWAS studies have identified variants associated with reasoning ability.43 Based on GTEx database (see URL section) we identified rs7151024 as an eQTL, expressed in subcutaneous adipose tissue (p=1.4×10⁻⁸, eQTL effect size (es)=−0.38) that may affect fat distribution and anthropometric traits. ZRANB2-AS2 is a non-coding RNA, and GWAS studies have identified variants in ZRANB2-AS2 associated with facial morphology,44 and also with general cognitive function,45 traits which are genetically correlated with a wide range of physical variables. EPHA7 belongs to the ephrin receptor subfamily of protein-tyrosine kinase, implicated in mediating developmental events, particularly in the nervous system. EPHA7 has been implicated in neurodevelopment processes46 as well being as a tumour suppressor gene in cancer.47 CACUL1, CDK2-associated cullin domain 1, is a cell cycle-dependent kinase binding protein capable of promoting cell progression. In the GWAS Catalog, any of the anthropometric traits analysed here have been associated with variants in CACUL1 (online Supplementary file 13). However, the associated rs12414412, reported as an eQTL expressed in skeletal muscle (p=1.4×10⁻⁷, eQTL es=−0.31), may affect body constitution. CACUL1 suppresses androgen receptor (AR) transcriptional activity, impairing LSD-mediated activation of the AR,48 whose genetic variation is associated with longitudinal height in young boys.49 MAD1L1, mitotic arrest deficient 1-like protein 1, is a component of the mitotic spindle-assembly checkpoint, and some cancers (prostate and gastric) have been associated to MAD1L1 dysfunction.50 Our study identified BMI, weight and hip and waist circumference single-trait association (p<10−5) with the intronic variant rs62444886 in the MAD1L1 locus, as well as a significant multitrait association in meta-analysis (table 3, online Supplementary file 14). GWAS analysis identified MAD1L1 as a susceptibility gene for bipolar disorder and schizophrenia, involved in reward system functions in healthy adults,51 but until now, no other study has identified it as a genetic contributor to weight. The higher prevalence of obesity and related disorders such as diabetes in schizophrenia patients could reflect a possible underlying common genetic contribution. In this sense, we observed also GWAS significant signals in INS-IGF2 (GCAT-UKmulti p=1.5×10⁻²¹), an analogue of the INS gene (previously associated with diabetes type I and type II disorders).52 Additionally, epigenome-wide association studies in adults53 and children54 support a role for MAD1L1 in BMI–methylation association, with differentially methylated CpG patterns in CD4+ and CD8+ T cells between obese and non-obese women. PIK3R1, phosphoinositide-3-kinase regulatory subunit 1, plays a role in the metabolic actions of insulin, and a mutation in this gene has been associated with insulin resistance. Moreover, common variants are associated with lower body fat percentage as well as the control of peripheral adipose tissue mobilisation.55 Genetic variation in the GWAS Catalog is also associated with cartilage thickness56 and mineral bone density,57 both related to anthropometric traits. Diseases associated with PIK3R1 include SHORT syndrome,58 characterised by individuals with short stature and a restricted intrauterine growth, in addition to multiple anomalies. Our study identified the intronic variant (rs695166) associated with waist circumference association in single-trait analysis (p<10−6), but not in the UKdataset, which associates with height (p=2.3×10⁻¹⁴). However, analysis of the UKBiobank data supported a similar peak profile overlapping the gene region (see online Supplementary file 12) and multitrait analysis association (GCAT-UK multi p=8.4×10⁻¹⁵) (table 3).
Supplementary file 12
Supplementary file 13
Supplementary file 14
Multiple approaches for multitrait analysis using GWAS data have been successfully applied in the research of genetically complex conditions using raw data or summary-level data statistics. Using raw data, Ferreira and Purcell11 used a test based on the Wilk’s lambda derived from a canonical correlation analysis. Korte et al 13 implemented a mixed-model approach accounting for correlation structure and the kinship relatedness matrix. O’Reilly et al 14 proposed an inverted regression model for each SNP as the response and all the traits as covariates. Regarding the use of GWAS summary-level data statistics, Cotsapas et al 10 developed a statistic for cross-phenotype analysis based on an asymptotic 2 distribution derived from p values of the SNP associations. Zhu et al 15 implemented CPASSOC that accounts for the genetic correlation structure of the traits and the sample size for each cohort. Kim et al 12 proposed an adaptive association test for multiple traits that uses Monte Carlo simulations to approximate its null distribution. Recently, Bayes factor approaches59 have been proposed for studying multitrait genetic associations. Here, for meta-analysis purposes, we chose the multitrait analysis described by Yang and Wang.31 This test, based on the 2 distribution with ‘d’ df, depends on the genetic covariance structure of the traits and considers the distribution of the sum square of the z scores which is insensitive to the heterogeneous effect of the SNP. Nevertheless, this approach doesn’t allow allele effect estimation. In this sense, maximum likelihood methods have been recently proposed to deal with this limitation41 by accounting for different measures of the same phenotypic trait with different levels of heritability.
In complex diseases research, MRPs are the common observation in genome-wide association analysis of large cohorts, and over simplification of extreme phenotypes or the use of standardised phenotypes for meta-analysis reduces the power to detect the underlying genetic contribution to complex traits. As an alternative, multitrait analyses help to detect additional loci that are missing by applying a conventional meta-analysis. Our results highlight the potential value of data-driven multivariate phenotyping for genetic studies in large complex cohorts.
Supplementary file 10
Supplementary file 11
Supplementary file 15
Acknowledgments
The authors thank all the GCAT participants and all BST members for generously helping with this research.
References
Footnotes
Contributors All authors contributed to the feedback of the manuscript and played an important role in implementing the study. IG-F, MP, VM and RdC conceived the study. IG-F and RdC planned the study. LP coordinated the cohort recruitment. AC, JV and XD prepared the samples. MO-S and XD curated the epidemiological data variables. DP, RP, LR, SA and LS conducted the genotyping. IG-F, DP and LS analysed the clustering analysis. IG-F, MG-M, JMM and DT conducted the imputation analysis. IG-F and RdC conducted and supervised the genetic analysis. IG-F, MO-S and RdC wrote the manuscript. RdC submitted and supervised the study.
Funding This work was supported in part by the Spanish Ministerio de Economía y Competitividad (MINECO) project ADE 10/00026, by the Catalan Departament de Salut and by the Departament d’Empresa i Coneixement de la Generalitat de Catalunya, the Agència de Gestió d’Estudis Universitaris i de Recerca (AGAUR) (SGR 1269, SGR 1589 and SGR 647). RdC is the recipient of a Ramon y Cajal grant (RYC-2011-07822). The Project GCAT is coordinated by the Germans Trias i Pujol Research Institute (IGTP), in collaboration with the Catalan Institute of Oncology (ICO), and in partnership with the Blood and Tissue Bank of Catalonia (BST). IGTP is part of the CERCA Programme/Generalitat de Catalunya.
Competing interests None declared.
Patient consent Obtained.
Ethics approval http://www.ceicgermanstrias.cat/.
Provenance and peer review Not commissioned; externally peer reviewed.
Correction notice This article has been corrected since it was published online first. JMM has been added to the authors list and to the ’Contributors' section.