Article Text

Abstract
Background MicroRNA-129-1 (miR-129-1) seems to behave as a tumour suppressor since its decreased expression is associated with different tumours such as glioblastoma multiforme (GBM). GBM is the most common form of brain tumours originating from glial cells. The impact of miR-129-1 downregulation on GBM pathogenesis has yet to be elucidated.
Methods MiR-129-1 was overexpressed in GBM cells, and its effect on proliferation was investigated by cell cycle assay. MiR-129-1 predicted targets (CDK6, IGF1, HDAC2, IGF2BP3 and MAPK1) were also evaluated by western blot and luciferase assay.
Results Restoration of miR-129-1 reduced cell proliferation and induced G1 accumulation, significantly. Several functional assays confirmed IGF2BP3, MAPK1 and CDK6 as targets of miR-129-1. Despite the fact that IGF1 expression can be suppressed by miR-129-1, through 3′-untranslated region complementary sequence, we could not find any association between IGF1 expression and GBM. MiR-129-1 expression inversely correlates with CDK6, IGF2BP3 and MAPK1 in primary clinical samples.
Conclusion This is the first study to propose miR129-1 as a negative regulator of IGF2BP3 and MAPK1 and also a cell cycle arrest inducer in GBM cells. Our data suggests miR-129-1 as a potential tumour suppressor and presents a rationale for the use of miR-129-1 as a novel strategy to improve treatment response in GBM.
- Cancer: CNS
- Cell biology
- Gene therapy
- MicroRNA
- Neuro oncology
Statistics from Altmetric.com
Introduction
Glioblastoma multiforme (GBM) is the most common and malignant form of the primary brain tumours in humans that originates from glial cells or their precursors within the central nervous system. Despite advances in cancer therapy strategies, treatment of patients with GBM can be difficult due to heterogeneous and topographically diffused nature of the brain tumours.1 ,2 The 5 year survival rate of patients is very low at about 10%, which defines GBM as a life-threatening disease. Several pathways such as the RAS, tumour protein 53 (TP53) and phosphoinositide kinase 3 (PIK3), as well as the cell cycle control pathways, have been identified to be disrupted in GBM.3 ,4
For efficient treatment of GBM, understanding the exact molecular mechanism of the disease is crucial. But, several mutations in various molecular pathways and different abnormalities’ contribution to the gliomagenesis make this task difficult to be achieved.5
Interestingly, recent studies have indicated that there is a relationship between the mis-expression of microRNAs (miRNAs or miRs) and pathogenesis of different types of cancer, for example, colorectal,6 lung,7 breast,8 hepatic,9 pancreatic cancer10 and GBM.11 MiRNAs (non-coding RNAs approximately 20–25 nucleotide in length) regulate gene expression at the post-transcriptional level by targeting cognate mRNAs containing partially complementary sequences in their 3′-untranslated region (3′-UTR). This results in the cleavage of the RNA or reduced level of the corresponding protein.12–15 MiRNAs have also been demonstrated to play critical roles as a new and important class of oncogenes and tumour suppressors in tumours. For example, let-716 in lung cancer and the miR15a/16 cluster in chronic lymphocytic leukaemia17 act as tumour suppressors. In contrast, miR-17-92 cluster in malignant lymphoma and miR-155/BIC in Burkitt's lymphoma act as oncogenes.18
MiR-129 family is composed of two members: miR-129-1 located on chromosome 7q32 and miR-129-2 located on chromosome 11p11.2.19 Interestingly, chromosome 7q32 is a frequently deleted region in many cancers.20 ,21 MiR-129 family seem to behave as a tumour suppressor and their decreased expression has been shown in different tumours such as: gastric,22 bladder,23 and endometrial cancer,24 hepatocellular25 and colorectal carcinoma,26 lung adenocarcinoma27 and GBM.11 However, the precise role of miR-129-1 in GBM cancer pathology remains to be defined.
In the current study, we scrutinised the tumour suppressive role of miR-129-1 in GBM cell lines and found that the overexpression of miR-129-1 inhibits cell proliferation and induces G1 arrest in GBM cell lines. Further analysis showed that IGF2BP3, CDK6 and MAPK1, and not IGF1, are important targets of miR-129-1 in GBM cells. In addition, we could find a downregulation in the expression level of miR-129-1 in majority of patients with GBM compared with control samples.
Material and methods
Cell lines and patient sample collection
Human glioma cell lines U87, A172, U251 and human embryonic kidney (HEK) 293 T cells were maintained in Dulbecco's modified eagle's medium supplemented with 10% fetal bovine serum (Hyclone, USA) and 1% antibiotics (100 U/mL penicillin and 100 mg/mL streptomycin sulfate). Cells were grown in 5% CO2 at 37°C.
Fifteen fresh GBM tissues (WHO grade IV) and age-matched and sex-matched non-cancer postmortem brain tissues were obtained from Sina Hospital and Forensics Center, respectively (Tehran, Iran), in 2013 with informed written consent in accordance with the Declaration of Helsinki. All tissue samples were obtained at primary resection. None of the patients had undergone prior chemotherapy or radiation therapy. Patient samples were immediately sliced to <0.5 cm thick and maintained in approximately 10 μL reagent of RNALater per 1 mg of tissue (Qiagen) and stored at −20°C until usage.
Plasmids, viral vectors construction and luciferase assay
For gain-of-function studies, a genomic fragment spanning the miR-129-1 coding region was cloned into pLEX.JRed vector (pLEX-miR-129) and for loss-of-function studies pLenti-miR-Off-129 construct was purchased from ABM Company (see online supplementary data).
For luciferase assays, the partial lengths of IGF1, IGF2BP3 and MAPK1 3′-UTR, harbouring potential miR-129-1 target sites, were cloned downstream of the luciferase gene in the pSICHECK2 vector (Promega). For construction of Mut-miR-129-1, two mutations were created in the seed region of the pre-miR-129-1 and mutated stem-loop structure was cloned in pGFP-V-RS vector. Luciferase activity was measured 48 h after transfection using the Dual Luciferase Reporter Assay System (Promega) and the Renilla luciferase signal normalised to the Firefly luciferase signal activity (see online supplementary data).
To knockdown endogenous IGF2BP3, MAPK1 and IGF1 the small hairpin RNAs (shRNAs) were constructed and cloned into vector pGFP-V-RS (shIGF2BP3, shMAPK1 and shIGF1, respectively). An empty shRNA vector (shCtrl) was used as a negative control (see online supplementary data).
Gene expression analysis
Total RNA was purified from cell lines or tissue specimens using Trizol (Invitrogen) according to the manufacturer's protocol and reverse transcribed to cDNA using random hexamers (for mRNA genes), stem-loop RT specific primers (for miR-129-1 and SNORD47) and M-MuLV RT (Promega).
Real-time PCR for target mRNAs and miR-129-1 was performed using Quantitect SYBR Green PCR Master Mix (Takara). QRT-PCR primer sequences are listed in online supplementary table S1.
In clinical samples, the mean of miR-129 Cts between all of the normal samples was determined and compared with the obtained Cts of each patient. The same procedure was performed for SNORD47, as internal control gene, for normalisation of expression data. Based on the results, patients were divided into two groups: a group in which miR-129-1 gene expression level was lower than normal samples and the other in which miR-129-1 gene expression level was higher than normal samples. Subsequently, relative gene expression of IGF2BP3, IGF1 and MAPK1 was determined by comparing obtained Cts in patients with mean Cts of normal samples.
Cell proliferation of infected cells
A total of 5.0×10⁵ cells for each of the GBM cell lines were seeded into 10 mL plates and transduced with Lentiviruses containing empty vector (pLEX-Ctrl), encoding for scramble sequence of miR-129-1 (pLEX-Scr), miR-129-1 (pLEX-miR-129-1) and miR-Off-129-1 (pLenti-III-miR-Off-129-1). Viable cells were collected and counted 2–4 days after infection by trypan blue exclusion using a ViCell counter (Beckman Coulter).
MTT, chemosensitivity and apoptosis assays
MTT assay was performed using Vybrant MTT Cell Proliferation Assay Kit, according to manufacturer's protocol (Life Technologies). Absorbance was measured at 550 nm using a multiwell spectrophotometer (Bio-Tek).
For chemosensitivity assay, U251 cells were seeded in 24-well plate and transduced with miR-Off-129-1. About 48 h after transduction, normal and transduced U251 cells were treated with LY294002 (20 µM), or PD98059 (20 µM) small molecular inhibitors, and incubated at 37°C, 5% CO2 for 48 h. At this point, MTT assay was performed as above.
Cell apoptosis index was also assessed using Caspase 3 colorimetric activity assay kit (Millipore, USA) according to manufacturer's instruction. Luminescence of each sample was measured by a microtitre plate reader device (Eppendorf).
Cell-cycle analysis
For cell cycle analysis, U87-MG, A172 and U251 cells were seeded in 24-well plates, and transduced with pLEX-Ctrl, pLEX-Scr or pLEX-miR-129, and collected after 3–4 days. Afterwards, cellular DNA content was evaluated by flow cytometry and obtained data were analysed using Flowjo programme.
In order to find the impact of IGF1 on cell cycle progression, 105 cells of U251 line were transduced with pLEX-miR-129-1 in 12-well plates. After 48 h, the conditioned medium was replaced with medium supplemented with 20 ng/mL IGF1 in test group. Cells were collected and cell cycle analyses were performed 48 h later, as described in online supplementary data.
Western blot
Western blotting analysis for CDK6, MAPK1, IGF2BP3, IGF1 and β-actin (antibodies purchased from Abcam) was carried out as mentioned in online supplementary data.
Database prediction of miRNA targets
The miRNA-129-1 targets were predicted using TargetScan web server (http://www.targetscan.org, V.5.1). Biological processes of this target list were analysed using PANTHER (http://www.pantherdb.org, V.7). Furthermore, DIANA-miRPath program (http://diana.cslab.ece.ntua.gr/pathways/) using DIANA-microT-3.0-Strict was used to predict and analyse conserved targets for hsa-miR-129-1 in the Kyoto Encyclopedia of Genes and Genomes (KEGG) database.
Statistical analysis
All experiments were performed at least three times, presented as mean± SD and analysed by student's t test. p Values of ≤0.05 were considered as statistically significant.
Additional information can be found in the online supplementary material.
Results
MiR-129-1 inhibits cell proliferation in GBM cell lines
It has been reported that miR-129-1 is downregulated in GBM cancer, but the role of this miRNA in GBM carcinogenesis and tumour growth needs to be clarified.11 ,28 To investigate the biological effect of miR-129-1, three GBM cell lines (U87-MG, A172 and U-251) were transduced with pLEX-miR-129-1, pLenti-miR-Off-129-1, pLEX-Ctrl and pLEX-Scr and evaluated for cell proliferation, cell cycle and apoptosis (see online supplementary figure S1).
The successful overexpression of miR-129-1 in the cells was confirmed by QRT-PCR (figure 1A). After cell transduction, according to MTT assay, ectopic expression of miR-129-1 resulted in a significant shrinkage in cell absorbance as compared with that of the control groups. Observed phenotype could compensate using pLenti-miR-Off-129-1 (figure 1B). Absorbance reduction in MTT assay could be partially due to the induction of apoptosis or disruption of cell proliferation via several mechanisms such as cell cycle arrest. Thus, we next explored the effect of miR-129-1 on apoptosis and cell cycle regulation.

MiR-129-1 reduced cell proliferation in glioblastoma multiforme (GBM) cell lines. (A) miR-129-1 expression evaluated by QRT-PCR in GBM cell lines, 2 and 3 days after transduction with pLEX-Ctrl, pLEX-Scr or pLEX-miR-129-1 relative to SNORD47 as an endogenous control. Columns, mean of three replicates; bars, SD (∗p<0.001). (B) Measurement of cell absorbance by MTT assay. MiR-129-1 impacts on cell proliferation were measured up to 96 h after transduction. Each time point was expressed as total absorbance at 570 nm after background subtraction (Y axis). Points, mean of three experiments; bars, SD. (C) Cell growth curves for U87-MG, A172 and U251 cells transduced with miR-129-1 and their respective controls. Transduction of pLEX-miR-129-1 decreased the cell proliferation, as compared with the cells transduced with pLEX-Ctrl or pLEX-Scr. Points, mean of three experiments; bars, SD. Three pLEX-Scr construct were used for each test and the values shown are the average obtained from them.
Caspase 3 activity assay showed that miR-129-1 has no significant effect on the induction of caspase 3-mediated apoptosis (data not shown). So, we investigated the role of miR-129-1 in cell proliferation index. Interestingly, an increase in miR-129-1 expression caused significant decrease in cell proliferation rate of GBM cell lines regarding control groups in all three cell lines. Depletion of miR-129-1 in transduced GBM cell lines using pLenti-miR-Off-129-1 diminishes reduction of cell proliferation, indicating that the observed effect was limited to miR-129-1 activities (figure 1C).
Next, we evaluate the influence of endogenous miR-129-1 downregulation via using pLenti-miR-Off-129-1 on proliferation of control GBM cells. Globally, cell proliferation was slightly increased in the three cell lines (see online supplementary figure S2).
The effect of miR-129-1 on cell cycle progression was also examined using flow cytometry. The results indicate that miR-129-1 triggered more accumulation of cells at the G1 stage (59.3% at 72 h and 73.4% at 96 h) as compared with that of pLEX-Ctrl control (43.01% at 72 h and 55.67% at 96 h) in U87-MG cells, whereas, the number of cells in S phase and G2/M phase decreased from 32.21% and 24.36% at 72 h and 27.69% and 15.76% at 96 h in pLEX-Ctrl control group to 24.06% and 13.93% at 72 h and 13.7% and 8.83% at 96 h in pLEX-miR-129-1-treated group of U87 cell lines. Comparable results were also observed in A172 and U251 cells (figure 2).
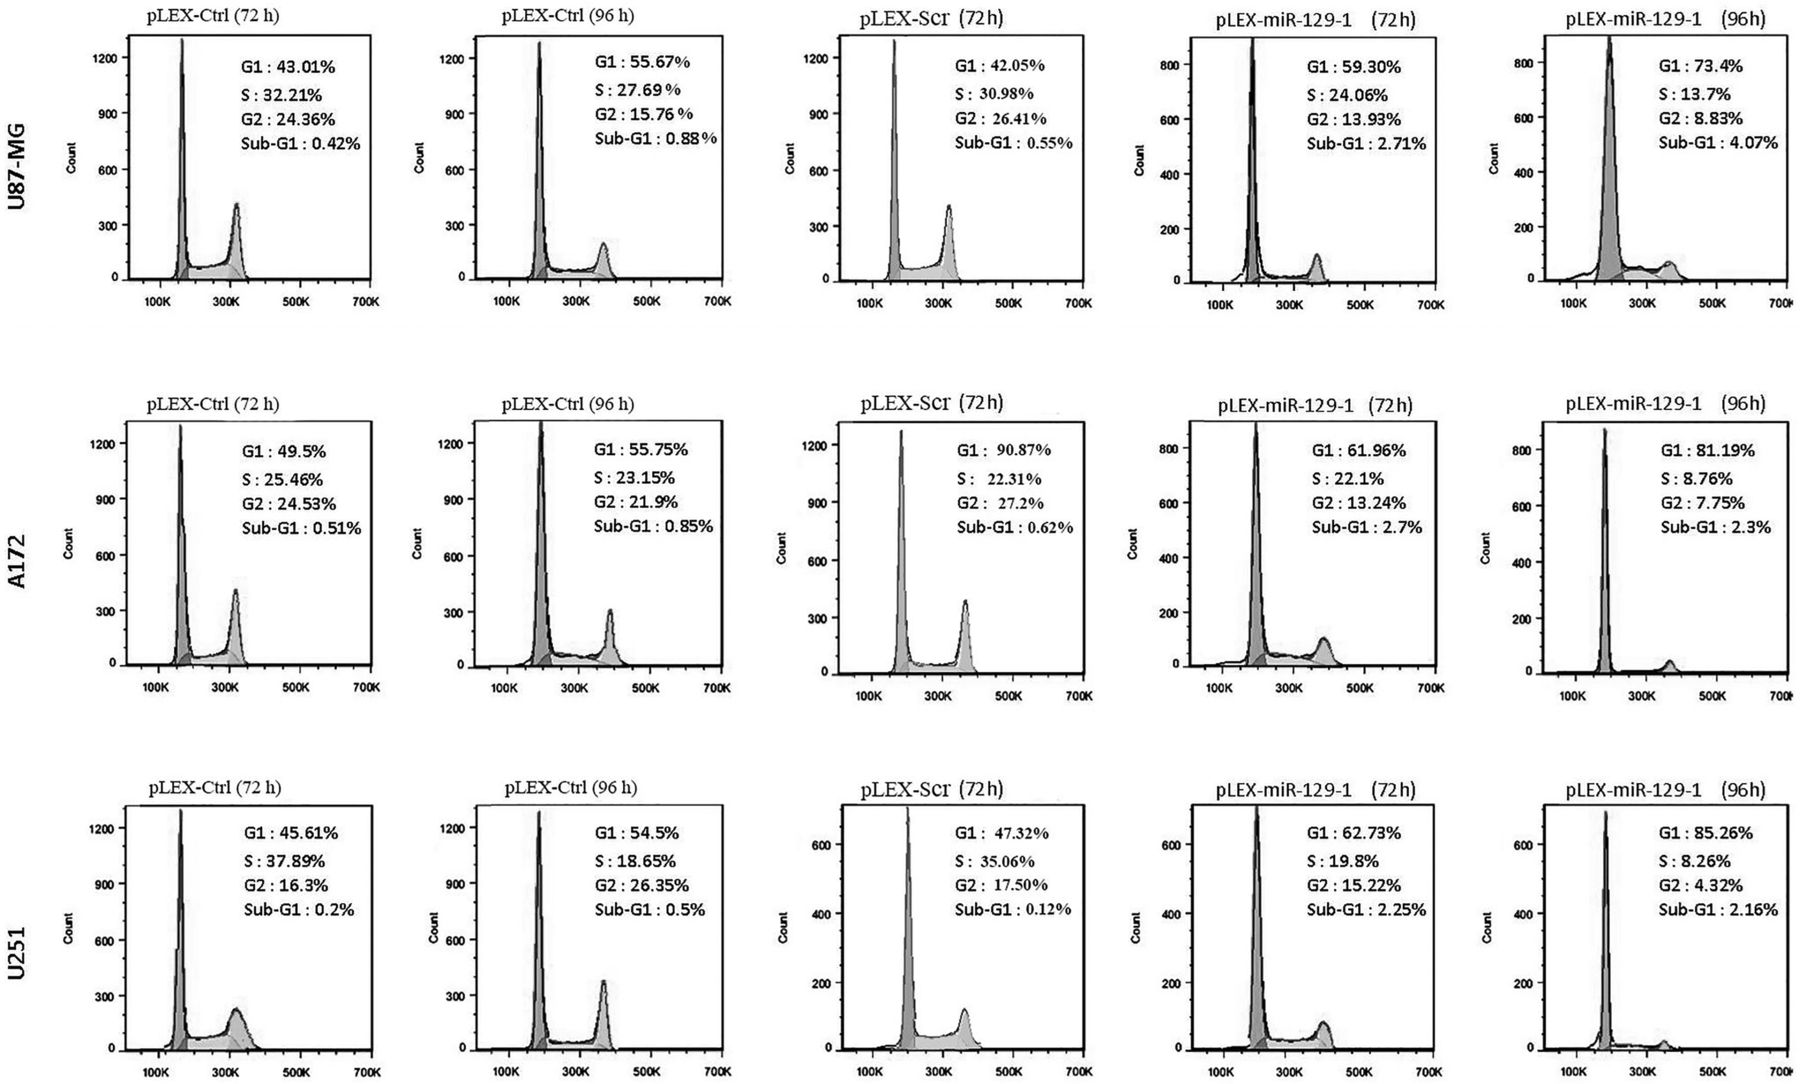
Ectopic expression of miR-129-1 induced G1 arrest in glioblastoma multiforme (GBM) cell lines. Cells were transduced with pLEX-Ctrl, pLEX-Scr or pLEX-miR-129-1, collected after 72–96 h and analysed with flow cytometry, indicating miR-129-1 induced a G1 accumulation in each of GBM cell lines at both time points. The maximum rate of G1 accumulation was observed in U251 cell line at 96 h (approximately 30% compared with the control). Each experiment was performed in triplicates. For transduction with pLEX-Scr, three pLEX-Scr constructs were used and the values shown are the average obtained from them.
Taken together, these results demonstrated that miR-129-1 could inhibit the proliferation of GBM cells in vitro.
Upregulation of miR-129-1 reduced the expression level of IGF1, IGF2BP3, MAPK1 and CDK6 in GBM cell lines
To identify the molecular networks through which miR-129-1 exerts its influence on cell cycle, analysis of conserved mRNA targets of miR-129-1 (∼540 targets) was carried out using TargetScan program and then gene classification was performed by PANTHER.29 ,30 Online supplementary figure S3A shows the biological processes and gene sets for predicted miR targets by TargetScan. In a similar approach, we used the DIANA miRPath program31 to predict miR-129-1 targets (∼1600) with the DIANA-microT-3.0-Strict algorithm32 followed by comparison with the KEGG biological pathways33 (see online supplementary figure S3B). A number of remarkable molecular networks were found as miR-129-1 targets, including cancer signalling, PI3K/AKT and MAPK signalling, all of which are known as important pathways in tumour development. The results of biological processes analysis by PANTHER indicated that 72 genes are involved in cell cycle (see online supplementary table S3). By comparing 72 cell cycle genes with genes affecting cancer progression, 12 genes are found to be involved in both categories. Among them five genes, MAPK1, HDAC2, IGF1, IGF2BP3 and CDK6, those which linked to G1/S arrest in literature and had high score in TargetScan, were selected for further analysis. To evaluate if these five predicted proteins could be considered as miR-129-1 targets, their mRNA levels were compared in cells transduced with pLEX-Ctrl, pLEX-Scr and pLEX-miR-129-1. After transduction (72 h), mRNA expression levels of candidate genes were determined by QRT-PCR analysis. IGF2BP3 and MAPK1 genes were significantly downregulated in U87-MG (4.34-fold and 2.94-fold respectively), A172 (4-fold and 2.4-fold) and U251 (4.89-fold and 3.5-fold) cell lines, compared with negative controls (figure 3A, B). Similarly, the protein levels of IGF2BP3 and MAPK1 were reduced in all three cell lines, with increased miR-129-1 expression. Analysis of IGF1 was performed only in U251 cell line (1.45-fold and 1.3-fold downregulation in mRNA and protein, respectively, in comparison with the control group) because its expression was too low and undetectable in A172 and U87-MG cell lines (figure 3C). There was no differences in CDK6 and HDAC2 mRNA expression between transduced and control cells. So, we analysed CDK6 and HDAC2 protein levels by western blot after miR-129-1 overexpression and found that protein level of CDK6, but not HDAC2, decreased by factor of 2.5 in all cell lines (figure 3D, E).

MiR-129-1 overexpression influence protein and mRNA levels of target genes in Glioblastoma multiforme (GBM) cell lines. Endogenous IGF2BP3 (A), MAPK1 (B), IGF1 (C), CDK6 (D) and HDAC2 (E) protein and mRNA expression were measured at 72 h post-transduction of miR-129-1 in GBM cell lines. β-Actin was used as an internal control in QRT-PCR. For IGF2BP3 and MAPK1, transduction of miR-129-1 induced a decrease in the mRNA and protein levels in all three cell lines. Because of low expression of IGF1 in U87-MG and A172 cell lines, the expression level was analysed only in U251. For CDK6 and HDAC2, there were no significant variations in the levels of their mRNAs compared with the controls. Western blotting of CDK6 indicated a reduction in protein level in three GBM cell lines, whereas no significant changes were found in HDAC2 protein expression of GBM cell lines in transduced cells compared with that of the control cells. Protein normalisation was performed with β-actin. Columns, mean of three different experiments; bars, SD; NC: negative control (cells did not have any treatments); (∗p<0.05, ∗∗p<0.001). In the case of pLEX-Scr, transduction with three pLEX-Scr construct was performed and the values shown are the average obtained from them.
To further investigate miR-129-1 targets, GBM cell lines were transduced with anti-miR-129-1 virus particles. The results demonstrated a trend towards a slight increase in IGF2BP3 and MAPK1 mRNAs and CDK6 protein (figure 4A, C), although there was no significant increase in the IGF1 expression level between pLenti-miR-Off-129-1-treated group and control group.

MiR-129-1 downregulation via anti-miR raises protein and mRNA levels of target genes in glioblastoma multiforme (GBM) cell lines. Endogenous IGF2BP3 (A) and MAPK1 (B) mRNAs and CDK6 (C) protein expressions were analysed according to miR-129-1 inhibition by pLenti-miR-Off-129-1. Transduction of pLenti-miR-Off-129-1 into GBM cells was followed by a slight increase in mRNAs and protein levels of target genes expect of IGF1. β-Actin was used as an internal control. Columns, mean of three different experiments; bars, SD; (∗p<0.05).
MiR-129-1 targets IGF1, IGF2BP3 and MAPK1
To validate that IGF1, IGF2BP3 and MAPK1 are direct targets of miR-129-1, the 3′-UTRs of these three genes were cloned into the psiCHECK-2 plasmid (the predicted binding sites for miR-129-1 are shown in figure 5A–C) and cotransfected with wild type (WT) miR-129-1 or Mut-miR-129-1 into HEK293 T cells. Since, there is more than one recognition site in 3′-UTR of each target; for negative control, seed sequence of miR-129-1 was mutated instead of creating mutations in each recognition site of targets. Specifically, in the presence of the WT-miR-129-1 expression vector, the constructs bearing the 3′-UTR of IGF1, IGF2BP3 and MAPK1 mRNA showed decreases in luciferase activity (figure 5D). The suppression was specific to the predicted miR-129-1 target sites, as mutations in the seed region abrogated the interactions.

Interaction between miR-129-1 and 3′-untranslated region (3′-UTR) binding sites of target genes. The 3′-UTR of IGF1 (A), MAPK1 (B) and IGF2BP3 (C) containing miR-129-1 target sites were cloned in the pSICHEK2 reporter vector and co-transfected with the pLEX-miR-129-1 expression vector in HEK293 cells for luciferase assays. (D) For construction of Mut-miR-129-1, two mutations were created in seed region of miR-129-1 and mutated pre-miR-129-1 was cloned in pGFP-V-RS. (E) MiR-129-1 expression significantly inhibited the luciferase activity of IGF2BP3, IGF1 and MAPK1 3′-UTRs. Luciferase activity was detected at 48 h after transfection. The empty pLEX and Mut-miR-129-1 vectors were used as negative controls. MiR-129-1 overexpression inhibited luciferase activity in the IGF2BP3, MAPK1 and IGF1 vector but had no effect on the control. MiR-129-1 mature sequence is indicated in purple colour. The mutated forms of the bases were presented as letter in the ≤. Data shown are mean values±SD of the ratio of luciferase activity, obtained from at least three independent experiments; (∗p<0.001).
IGF2BP3 and MAPK1 are involved in miR-129-1 dependent cell cycle arrest
In order to investigate the association between miR-129-1 antiproliferative effect and targeting predicted mRNAs, U251 cells were transfected with each of shIGF2BP3, shMAPK1, shIGF1 or shCtrl vectors. To avoid erroneous off-target effect, two different shRNA target sequences were used, and their silence efficiency were examined by QRT-PCR (figure 6A). Intriguingly, mRNA knockdown resulted in G1 accumulation of the cells transfected with shIGF2BP3 and shMAPK1, but not shIGF1, vectors compared with the cells transfected with scrambled control (figure 6B). Our data indicate that, among the examined targets, only IGF2BP3 and MAPK1 knockdown recapitulates the antiproliferative effect of miR-129-1.

Reduced expression of IGF2BP3 and MAPK1 promotes G1 arrest. (A) Expression levels of predicted mRNAs were evaluated by Q-RT-PCR in U251 cells, 72 h after transfection of shIGF2BP3, shMAPK1, shIGF1 and shCtrl. (B) Cell cycle of U251 cells were transfected with each of the shRNA vectors and shCtrl. Transfection of U251 cells with shIGF2BP3 and shMAPK1 significantly increased accumulation of G1 cells. However, the number of G1 cells in shIGF1-treated cells was not significantly different from the cells treated with shCtrl vector. (C) Stimulation of U251 cells by IGF1 did not rescue miR-129-1-induced G1 arrest (p>0.05). About 48 h after transduction, 20 ng/mL IGF1 was added to conditional cell media of U251 cells. Next, cell cycle assays were performed 48 h after IGF1 addition. (D) Proliferation was measured by MTT assay 48 h after treatment of pLEX-miR-129-1-transduced U251 cells with dimethyl sulfoxide (DMSO) (negative control), LY294002 (20 µM) or PD98059 (20 µM). This is clear that DMSO-treated pLEX-miR-129-1 U251 cells grow slower than control U251 cells. Furthermore, both LY294002-treated and PD98059-treated control U251 cells illustrate faster growth than pLEX-miR-129-1-transducted U251 cells, indicating that miR-129-1 overexpression through repression of both of these pathways involved inhibition of glioma proliferation rate. Data were the averages of at least three independent runs; bars, SD (∗p<0.01, ∗∗p<0.001).
To further support these findings, we tried to determine whether IGF1 could revert the inhibition of cell proliferation caused by miR-129-1 overexpression in U251 cells. Therefore, transduced U251 cells were stimulated with 20 ng/mL IGF1 and cell cycle analysis was performed after 48 h. The assays obviously indicated that the ectopic expression of IGF1 has no effect on the suppression of G1/S transition (p>0.05, figure 6C).
The mechanism underlying the antiproliferative effect of miR-129-1 was investigated using LY294002 and PD98059 small molecules which inhibit PI3K/AKT and MAPK/ERK signalling pathways, respectively. For this purpose, U251 cells were divided into two groups, one of them was treated with either of the small molecules, which represent the control group. The other one was treated with both miR-129-1 and one of the small molecules. We observed a significant decrease in the proliferation of cells treated with both miR-129-1 and small molecules in comparison with control group (figure 6D).
Thus, these results together emphasised miR-129-1 downregulation as a causal factor involved in augmenting GBM cell proliferation through modulating these two major pro-oncogenic pathways presumably by targeting IGF2BP3, MAPK1 and CDK6.
IGF2BP3, MAPK1 and CDK6 expression correlate inversely with miR-129-1 expression level in clinical GBM samples
MiR-129-1 overexpression in GBM cell lines provided some important information about the mechanism of its action in regulating genes. To obtain insights into the role of miR-129-1 in ‘steady-state’ target gene regulation in GBM, we correlated miR-129-1 expression level with identified target mRNA expression levels in 15 primary GBM and 15 normal brain samples. The expression level of miR-129-1 is reduced up to 50% (p<0.0001) in 67% (10 out of 15) of GBM cancer tissues compared with the non-cancerous brain tissues. Subsequently, based on the mean expression level of miR-129-1 in normal samples, patients were divided into two groups. The first group had lower expression than reference (≤1) and the other group showed higher expression levels compared with the reference (>1, p=0.001). The distributions of IGF1, IGF2BP3 and MAPK1 mRNA levels and CDK6 protein expression level in GBM samples are shown in figure 7A–F. The median expression levels of IGF2BP3, MAPK1 and CDK6 were significantly higher in the tumours expressing lower levels of miR-129-1 compared with those expressing higher levels of miR-129-1. However, there was no significant difference between median expression levels of IGF1 between two groups. Consistent with the cell line data, these results additionally proved that miR-129-1 expression affects the expression of predicted target genes except for IGF1.

Direct correlation of miR-129-1 and IGF2BP3, MAPK1 and CDK6 expression levels in clinical glioblastoma multiforme (GBM) tissues. (A) Distribution of relative miRNA-129-1 gene expression in GBM samples. (B) Distribution of GBM samples according to low and high expression of miR-129-1. (C) Distribution of relative gene expression of IGF1 in GBM samples according to miRNA-129-1 levels, p=0.39. (D) Distribution of relative gene expression of IGF2BP3 in GBM samples according to miRNA-129-1 levels, p=0.007. (E) Distribution of relative gene expression of MAPK1 in GBM samples according to miRNA-129-1 levels, p=0.006. (F) Distribution of relative CDK6 protein concentration in GBM samples according to miRNA-129-1 levels, p=0.013. (G) Model of cell cycle progression inhibited by tumour suppressor miR-129-1 through IGF2BP3-mediated, MAPK1-mediated and CDK6-mediated pathways. Data represent the mean of at least three independent experiments. Circles represent the expression levels for individual patients. The results are relative gene expression after normalisation with SNORD47 for miR-129-1 and β-actin for target genes using 2−ΔΔCt method. Horizontal lines represent the mean.
Discussion
Global alterations in miRNA expression have been illustrated in a large number of malignancies.18 ,34 ,35 Some studies have reported the downregulation of miR-129-1 expression in GBM tumors11 ,28 but its function remains unknown.36 Here, our results clearly demonstrate that miR-129-1 acts as a tumour suppressor gene in GBM and its overexpression prevents cells from completing the G1–S transition and delays the cell cycle progression of U87-MG, A172 and U-251 GBM cell lines. These results confirm previously published data in mouse lung epithelial (E10) cells and human lung adenocarcinoma cell line.22 ,27
In order to obtain an insight into the cell cycle arrest in the presence of miR-129-1, we tried to identify putative targets of this miRNA. By recruiting KEGG/DIANA algorithm, we found most of miR-129-1 target genes associated with cancer development. Moreover, TargetScan/PANTHER search algorithm results identified genes that have important role in cell cycle. Among these targets, five shared genes (IGF1, IGF2BP3, MAPK1, HDAC2 and CDK6), whose roles in G1/S arrest have been shown in various studies, were chosen for more investigation.27 ,37–39 Although two putative miR-129-1-binding site predicted by TargtScan in 3′-UTR of HDAC2 gene, our analysis showed no significant changes in the HDAC2 mRNA or protein level. These data indicate that miR-129-1 does not act through HDAC2.
IGF-1 activates PI3K/AKT/GSK-3β pathway, leading to an increase in GSK-3β phosphorylation. This stabilises cyclin D1 and downregulates CDK inhibitors (p27KIP1 and p57KIP2), all contributing to G1/S regulation.38 ,40 Luciferase assay results demonstrated that miR-129-1 targets IGF1. However, stimulation of U251 cells by IGF1 could not rescue the inhibitory effect of miR-129-1. In addition, no significant difference was found in IGF1 expression level between GBM clinical and normal samples. These results indicate that although IGF1 is one of the targets of miR-129-1, it does not play a major role in GBM pathogenesis. There are two explanations. First is the presence of other important factors involved in the mechanism of miR-129-1 antiproliferative effect.
Second, in a recent study, Masamha et al showed that CFIm25 downregulated in GBM cell lines.41 CFIm25 has a key role in mRNA alternative polyadenylation. Downregulation of CFIm25 results in a preferred proximal site mRNA polyadenylation (relative to stop codon). This inclination towards proximal site leads to the removal of negative regulatory elements such as miRNA target sequences within the 3′-UTR of genes. Elimination of regulatory elements preserves mRNA, mostly associated with cell cycle and tumour development, from degradation through miRNA targeting system. This may be the reason for lack of correlation between IGF-1 and miR-129-1 in GBM cell lines.
Moreover, we showed that miR-129-1 targets MAPK1, IGF2BP3 and CDK6. Our results were further confirmed by luciferase assay and shRNA knockdown. Remarkably, low miR-129-1 expression level is correlated with higher expression levels of these genes in GBM clinical samples. As shown in figure 7G, IGF2BP3 elevates IGF2 protein concentration via increasing the stability of IGF2 mRNA.39 ,42 ,43 IGF2 ligand was originally discovered as a mitogen; its mitogenic effect is mediated through binding to IGF-1 receptor and activation of MAPK/ERK and PI3 K/AKT cascades.44 MAPK/ERK pathway, in turn, promotes G1–S transition by increasing the expression level of cyclin D1 and CDK4/6 genes.45 ,46 Hence, targeting IGF2BP3, MAPK1 and CDK6 by miR-129-1 decreases the MAPK/ERK and PI3K/AKT cascades which lead to the postponement of G1–S transition in cell cycle. Collectively, our results suggest miR-129-1 as a tumour suppressor that downregulates the components of extrinsic and intrinsic signalling pathways, which have critical role in the proliferation of GBM cells. Further evidence came from the use of pharmacological inhibitors of PI3K/AKT and MAPK/ERK pathways, indicating that the antiproliferative effect of miR-129-1 can be mediated through these pathways.
Finally, we elucidated that miR-129-1 is downregulated in GBM cancer tissues compared with adjacent normal brain tissues and inhibits cell proliferation in GBM cell lines without inducing apoptosis in vitro. The exact underlying mechanism that is responsible for the downregulation of miR-129-1 has yet to be identified in GBM samples, but there is evidence that the hypermethylation of the promoter region can be the reason for this phenomenon.6 ,47
Overall, our findings identify miR-129-1 as one of the tumour suppressor microRNAs that can be useful in getting a better understanding of GBM cancer pathogenicity.
Acknowledgments
The authors are grateful for the valuable contribution of the patients included in the study. They thank Hamid Aghaee and Anita Pottekat for their excellent technical assistance and scientific advice. This work was supported by a research grant from Stem cell Technology Research Center, Tehran, Iran.
References
Supplementary materials
Supplementary Data
This web only file has been produced by the BMJ Publishing Group from an electronic file supplied by the author(s) and has not been edited for content.
- Data supplement 1 - Online supplement
Footnotes
NM and MS-Z are shared second authors. FK and SMAHR are shared third authors.
Correction notice This article has been corrected since it published Online First. Affiliation 2 has been corrected.
Contributors FK and MS have designed the study and performed the statistical analysis. NM carried out the western blot tests. MS-z and SZ participated in the sequence cloning and virus packaging. MF-R and RL carried out the cell cycle analysis and drafted the manuscript. AH and RT performed QRT-PCR tests. FK and SMAHR participated in shRNAs studies. HH is the neurologist who gave normal and patient samples. All authors read and approved the final manuscript.
Funding This work was fully supported by funding from Stem Cell Technology Research Center, Tehran, Iran.
Competing interests None declared.
Patient consent Obtained.
Ethics approval Brain tissue.
Provenance and peer review Not commissioned; externally peer reviewed.