Article Text

Abstract
Background As a result of the epigenetic phenomenon of X chromosome inactivation (XCI) every woman is a mosaic of cells with either an inactive paternal X chromosome or an inactive maternal X chromosome. The ratio between inactive paternal and maternal X chromosomes is different for every female individual, and can influence an X-encoded trait or disease. A multitude of X linked conditions is known, and for many of them it is recognised that the phenotype in affected female carriers of the causative mutation is modulated by the XCI ratio. To predict disease severity an XCI ratio is usually determined in peripheral blood samples. However, the correlation between XCI ratios in peripheral blood and disease affected tissues, that are often inaccessible, is poorly understood. Here, we tested several tissues obtained from autopsies of 12 female individuals for patch size and XCI ratio.
Methods XCI ratios were analysed using methyl-sensitive PCR-based assays for the AR, PCSK1N and SLITRK4 loci. XCI patch size was analysed by testing the XCI ratio of tissue samples with decreasing size.
Results XCI patch size was analysed for liver, muscle, ovary and brain samples and was found too small to confound testing for XCI ratio in these tissues. XCI ratios were determined in the easily accessible tissues, blood, buccal epithelium and hair follicle, and compared with ratios in several inaccessible tissues.
Conclusions Buccal epithelium is preferable over peripheral blood for predicting XCI ratios of inaccessible tissues. Ovary is the only inaccessible tissue showing a poor correlation to blood and buccal epithelium, but has a good correlation to hair follicle instead.
- Molecular genetics
- Genetic screening/counselling
- Genetics
This is an Open Access article distributed in accordance with the Creative Commons Attribution Non Commercial (CC BY-NC 4.0) license, which permits others to distribute, remix, adapt, build upon this work non-commercially, and license their derivative works on different terms, provided the original work is properly cited and the use is non-commercial. See: http://creativecommons.org/licenses/by-nc/4.0/
Statistics from Altmetric.com
Introduction
Female XX mammals equalise their X chromosomal gene dosage to XY men by inactivating one of their two X chromosomes in a process called X chromosome inactivation (XCI).1 XCI is initiated early during embryonic development, and once the inactive X chromosome (Xi) is established it is propagated through a near infinite number of cell divisions. As a result every woman is a mosaic of cells with an inactive paternal X chromosome (Xp) and cells with an inactive maternal X chromosome (Xm).2 XCI mosaicism will be organised in clones of cells that have the same Xi. The size of these clones, or XCI patches, might differ between tissues and depends on the number of cells present at the moment of XCI, and the extent of cell migration. To assess XCI mosaicism most studies use the ratio between cells with a different active X chromosome in a population of cells largely exceeding the patch size. This X inactivation ratio (XIR) will be approximately 50:50 in most women, but deviations from this 50:50 XIR are common. When 80% of cells have the same Xi this is termed skewed XCI, while for extremely skewed XCI over 90% of cells should have the same Xi.3 ,4
A skewed XIR can be caused by conditions that influence the XCI process itself, resulting in primary skewed XCI, or as a result of secondary cell selection. Primary skewed XCI occurs around gastrulation of the early embryo, when XCI is initiated. Initiation of XCI is a stochastic process, resulting in a cell autonomous random choice of which X chromosome will be inactivated. After establishing an Xi, the silent state of this X chromosome will be clonally passed on to all daughter cells. The random nature of this choice makes most female embryos end up with a ratio of 50:50. By coincidence, the majority of cells can inactivate the same X chromosome, resulting in primary skewed XCI. The chance of this happening increases if the cell population undergoing XCI is smaller in size.5 ,6 Primary skewed XCI can also be caused by mutations or variations in the genes involved in the inactivation process.7 ,8 Secondary skewed XCI is the result of postinactivation cell selection that occurs when there is a selective pressure for a heterozygous X linked gene. Such a selection can occur at any age, in all tissues or might be tissue-specific. Secondary skewed XCI might also be the result of a decreasing stem cell pool during life, increasing the chance that most stem cells have the same Xi.9
A skewed XIR is clinically important whenever an X chromosomally encoded trait or disease is involved. By inactivating predominantly the healthy or the mutated allele, skewing of XCI can modulate the severity of an X linked disease. This has been established for fragile X syndrome, where the full mutation does not affect cell viability, but only cell functioning. Conversely, an X encoded mutation can also induce secondary skewed XCI. This can be clearly seen in incontinentia pigmenti, where cells with an active IKBKG mutation are more prone to undergo apoptosis. For some conditions women carrying the mutation might even appear to be unaffected, because they display completely skewed XCI. Despite the correlation between disease severity and skewed XCI, the mechanism through which this skewing is achieved remains unclear for some diseases.10–12 Currently, clinical analysis of the XIR is widely used to explain disease severity in female carriers of X linked diseases, or to predict disease severity in women with a heterozygous X linked recessive disease, like fragile X syndrome, Barth syndrome or Rett syndrome.
Interestingly, there are also several clinical conditions for which no causative X linked locus has been identified, but that have been associated with skewed XCI. This association has, for example, been shown for autoimmune thyroiditis, where it is thought that female individuals with extremely skewed XIR can develop autoimmunity to self-antigens encoded by the X chromosome that is inactive in the majority of cells.13 ,14 Also for polycystic ovary syndrome (PCOS) skewed XCI is thought to play a role in its aetiology, by preferentially inactivating the less sensitive androgen receptor (AR) gene and thereby contribution to the hyperandrogenaemic phenotype. However, both these associations are still under discussion.
When analysing the XIR to assess or predict the severity of an X linked disease, the tissue being tested should have a high degree of correlation with the affected tissue. A complicating factor is that secondary skewed XCI might occur mainly in the disease affected tissue without affecting other tissues. Peripheral blood is most commonly used for testing the XIR, but its correspondence to other tissues has been investigated only infrequently. Other easily accessible tissues, such as buccal epithelium and hair follicles have scarcely been evaluated. One previous study performed an elaborate comparison between several tissues using autopsy samples. However, a direct comparison to blood was not performed, because blood samples were only available in a limited number of individuals, and instead XCI patterns from spleen were also used to represent blood.15 In the present study, we test the correlation between the easily accessible tissues, blood, buccal swab and hair follicles, and a number of inaccessible tissues (thyroid, heart, liver, kidney, muscle and ovary), using samples collected during autopsy of 12 female individuals.
Results
Before testing the XIR of several tissues, we verified that our analysis is not confounded by the XCI patch size. If a sample taken for XIR analysis consists largely of a single clone, or patch, the observed XIR does not represent the XIR of that tissue, but rather the contribution of the patch to the analysed sample. To exclude an influence of patch size on XIR analysis, we attempted to identify the patch size for different tissues by determining the XIR for tissue samples with decreasing size. A sample composed entirely of a single patch will have the same X chromosome inactive in all cells, instead of a mixture of both X chromosomes. Liver and muscle were used first to determine patch size, because these organs have a homogeneous structure. Liver is mainly comprised of hepatocytes and muscle mainly of myocytes, and both tissues have relatively little contamination of other cell types that could possibly affect the XIR. An organ-specific XIR, to which the test samples could be compared, was determined by taking the average of three samples of approximately 6 mm3 from different sites of each tissue fragment. Liver samples used to determine patch size were obtained from four individuals and were 0.008–0.064 mm3 in size, containing 17 000–100 000 cells. Sensitivity tests of the human androgen receptor assay (HumARA) on samples of equal size, using male DNA and female DNA with a known XIR of 10%, confirmed that the assay provides a reliable XIR in this range of cell number (data not shown). When using the threshold for extremely skewed XCI (below 10% and above 90%) to identify an XCI patch, no sample encompassing a patch could be detected (figure 1A). Muscle samples contained a lower number of cells, ranging from 700 cells to 46 000 cells. Since striated muscle consists of multinucleated cells, the calculated cell number does not represent the actual number of cells, but instead represents the number of nuclei in a sample. The amount of nuclei reflects the number of cells that have fused to one or more multinucleated cells. Although the term ‘nuclei’ might be more appropriate, for convenience we will use the term ‘cells’ instead. Also for muscle skewed XCI was not observed, but, several samples showed a clear deviation from the tissue-specific XIR in one individual. This deviation occurred in the range of 4000 cells to 6000 cells (figure 1B), possibly indicating that these samples approach the patch size in muscle.
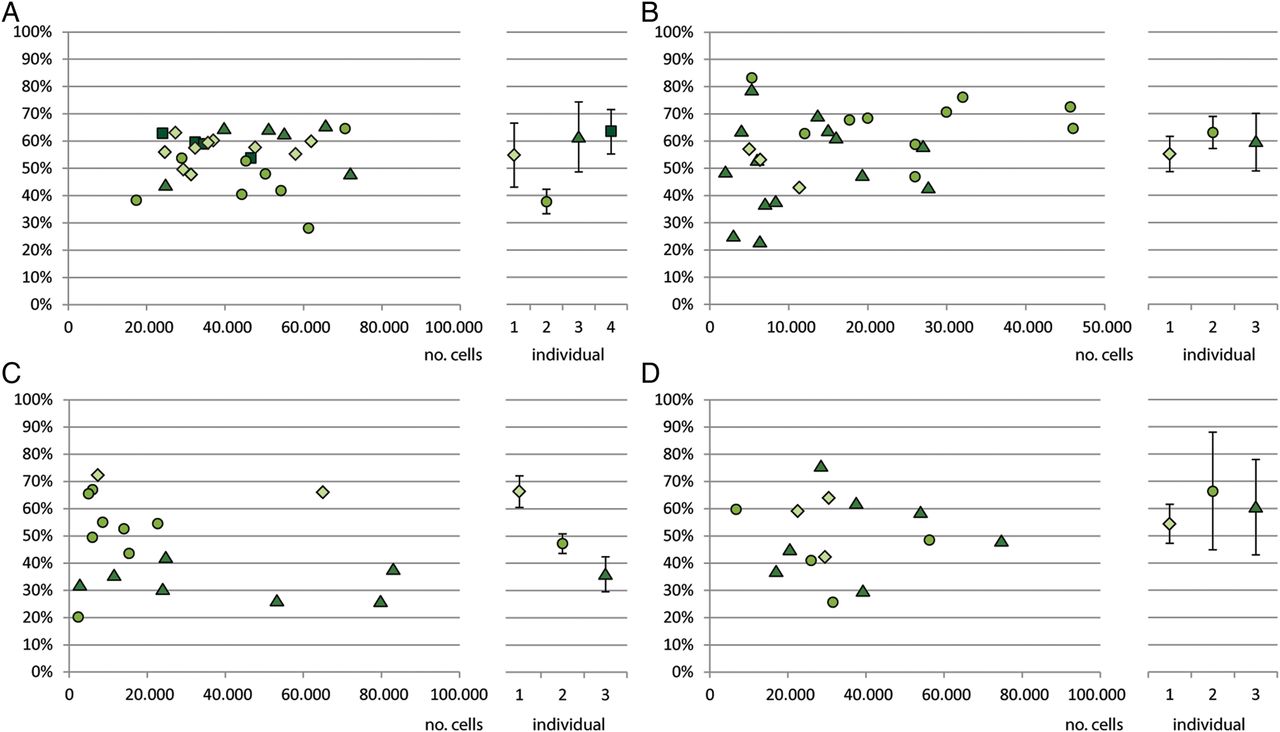
X inactivation ratios compared with number of cells. Patch size analysis for: (A) liver samples of four different individuals (B) muscle samples from three individuals (C) brain samples of three individuals (D) ovarian samples samples from three individuals. The left part of the graph shows the X inactivation ratio plotted against the number of cells. Different symbols represent different individuals. The right part of the graph shows the tissue-specific X inactivation ratio determined for each individual, as determined from three larger samples. Error bars show 2 SDs from the tissue-specific average.
Next, patch size analysis was performed for brain and ovary, because of the clinical relevance of these tissues. The XCI patterns in brain are of particular clinical relevance, because the X chromosome is relatively enriched for genes involved in neuronal functioning.16 Samples obtained from cerebral cortex contained 3000 cells to 100 000 cells, but did not display an extremely skewed XIR, nor a clear deviation from the tissue-specific XIR (figure 1C). Ovarian patch size is of clinical importance for ovarian phenotypes involving hyperandrogenism, such as PCOS. Ovarian samples for patch size analysis were isolated from the cortical region using laser microdissection to ensure they did not contain any follicles or vascular structures with possible oligoclonal expansion. The obtained samples were 0.001–0.002 mm3 in size and contained 7000 cells to 75 000 cells. No skewed XCI was observed in these samples, indicating that the patch size in the ovarian cortex is less than 7000 cells (figure 1D). These results show that the patch sizes for liver, muscle, brain and ovary are smaller than 17 000 cells, 6000 cells, 3000 cells and 7000 cells, respectively. A sample of 1 mm3 will therefore be large enough to measure XIR, without being biased by patch size.
After validating that patch size does not affect skewing analyses, we compared XIRs between different human tissues. We obtained tissues from 12 female individuals, with a median age of 58 years (table 1). Cause of death varied from blood loss, to infection or sepsis and complications of an organ transplantation. Of the 12 individuals from whom tissue samples were collected, 9 were informative for the AR locus. To analyse XCI in all 12 individuals we used the assays designed by Bertelsen et al, that are based on a technique similar to the HumARA, but use a methyl-sensitive HpaII site in proximity of a dinucleotide repeat in the PCSK1N and SLITRK4 genes.17 The PCSK1N and SLITRK4 assays were informative in 7 of 12 and 8 of 12 individuals, respectively, which is a slightly lower frequency of heterozygosity than the 75% and 80% observed by Bertelsen et al.17 After performing the three assays on all informative tissue samples, we tested the correlation between the three assays in our samples. For the AR and PCSK1N assays we found a Pearson correlation coefficient of 0.80, for the AR and SLITRK4 assays 0.64, and for the PCSK1N and SLITRK4 assays 0.81, indicating a good correlation between the three assays (figure 2).
Characteristics of individuals from whom autopsy samples were obtained

Correlation between the three assays used for analysing X chromosome inactivation (XCI): AR, PCSK1N and SLITRK4 (A) Plot showing the correlation between the X inactivation ratio (XIR) obtained by analysing the AR and PCSK1N loci for each tissue of all informative individuals using a Pearson correlation coefficient. (B) Plot showing the correlation between the XIR obtained by analysing the AR and SLITRK4 loci for each tissue of all informative individuals using a Pearson correlation coefficient. (C) Plot showing the correlation between the XIR obtained by analysing the PCSK1N and SLITRK4 loci for each tissue of all informative individuals using a Pearson correlation coefficient.
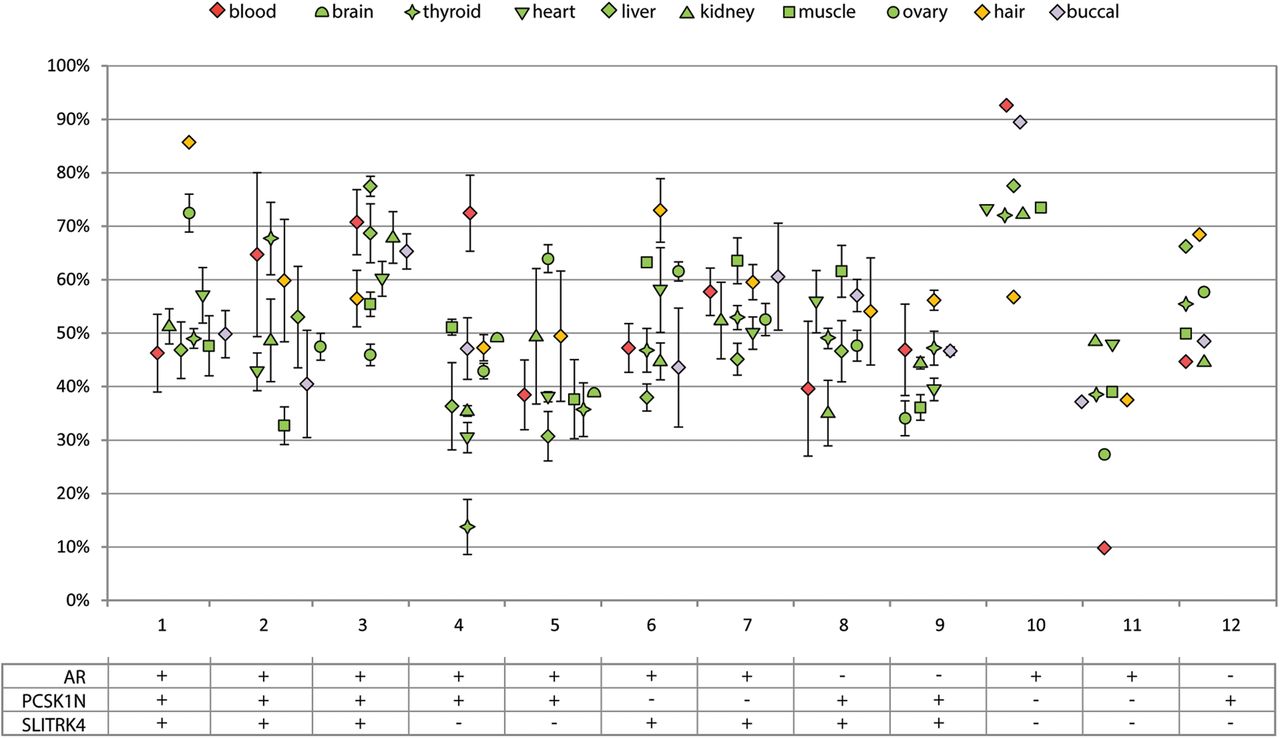
For testing the XIRs between different tissue samples, we used the average XIR from all informative assays. When XIRs are compared between tissues of an individual they cluster together, although there is considerable variation between tissues (figure 3). The largest observed difference between two tissues of the same individual was 58.8% between blood and thyroid of individual 4. The average difference between all tissues within one individual ranged from 6.9% in individual 7 to 17.2% in individual 4. Information regarding infection and blood transfusion was documented, because theoretically these conditions could be accompanied by proliferation of a subpopulation of lymphocytes, possibly resulting in a secondary skewed XCI in blood. Also, occurrence of monoclonal diseases and administration of cytostatic drugs was documented, since these conditions could also theoretically result in the selective increase of a subpopulation of cells in any tissue. No clear pattern was observed between these conditions and the occurrence of skewed XCI >90% in a single tissue or in multiple tissues.

X inactivation ratio (XIR) analysis in all accessible and inaccessible tissues of female individuals. Each data point represents the average XIR value from the assays informative in an individual. For every assay PCRs were performed in triplicate. Error bars represent the SD from the assays that were used. Different tissues are represented by different symbols. The table below shows which assays were informative for each individual.
The correlation of the easily accessible tissues to the inaccessible tissues was tested using Pearson's correlation coefficient. Using blood as easily accessible tissue, a good correlation was found with liver (r=0.58, p=0.078), kidney (r=0.50, p=0.097) and buccal epithelium (r=0.70, p=0.016) (table 2 and see online supplementary figure S1). When buccal epithelium was used as easily accessible tissue a much stronger correlation (r>0.68) was found with all tissues, except for ovary and hair, and for several tissues this correlation was significant. Surprisingly, blood and buccal epithelium have a weak correlation with the ovarian XIR (r=0.18 and r=0.23, respectively). Instead, hair follicles show a strong correlation to ovarian XIR (r=0.77, p=0.005), while for all other inaccessible tissues there is a weak correlation (r<0.40) with hair follicles.
Pearson product moment correlation between XIRs of easily accessible tissues and inaccessible tissues
Since long it has been described that there is an age-related increase of skewing in blood, occurring above the age of 60 years.4 ,18 ,19 This has been attributed to oligoclonal expansion from a limited number of stem cells, an effect that might be increased by a possible decrease of the number of stem cells in older women.4 ,9 If this is true, it can be expected that within a female individual the XIRs of different tissues initially cluster together around the same value, but diverge at later ages. To test if tissue-specific XIRs within an individual diverge with increasing age, the average XIR difference was calculated from the XIR differences for every tissue combination within an individual. The average XIR difference is the smallest in the youngest individual and the largest in the oldest individual and showed a significant correlation with age (r=0.72, p=0.008) (see online supplementary figure S2). These data suggest that XIRs of different tissues within an individual diverge with increasing age, although a larger number of individuals will be required to confirm this hypothesis.
Discussion
We performed a XIR-based patch size analysis for several inaccessible tissues, to avoid XIR analyses being confounded by XCI patch size. The results obtained show that the patch size for liver, muscle, brain and ovary is smaller than 17 000 cells, 6000 cells, 3000 cells and 7000 cells, respectively. These results are consistent with results from previous studies, that have all been performed on epithelial layers. Most of these studies used a mutation in the glucose-6-phosphate dehydrogenase (G6PD) gene, to stain tissue sections for the presence of G6PD activity. These studies estimated the patch size of endothelium in the arterial wall to be 50 cells of the epidermis, to be smaller than 30 mm2, and smaller than 1 mm2 in hair follicles.20–22 Another study employed the HumARA to assess patch size in bladder urothelium and estimated the patch size to be 120 mm2.23 Unlike in some of the abovementioned studies we did not identify an XCI patch in our samples, although our sample sizes were in the same range or smaller. A possible explanation is that epithelium has a larger patch size, compared with tissues that contain a mixture of parenchyma and stromal cells, as parenchyma and stromal cells might have already originated from different embryonic germ layers with different XIRs.
While the HumARA assay is probably the most widely used assay to determine the XIR, the AR locus is not informative for every individual. To analyse the XIR in all individuals, we used recently published assays for the SLITRK4 and PCSK1N loci alongside the HumARA. Like the HumARA, these assays determine XCI by assessing the methylation status of a locus neighbouring a polymorphic repeat. A methylation sensitive restriction enzyme is used to digest unmethylated DNA, leaving methylated templates intact, which are subsequently amplified by PCR. The amplified polymorphic repeat is used to discriminate between the two alleles. Although a strong correlation was found between all three assays, the three assays do not always perfectly agree. The average difference between two assays was 6.4% for the AR and PCSK1N assays, 6.2% for AR and SLITRK4, and 4.8% for PCSK1N and SLITRK4. The largest observed difference comparing all three assays was 27.1%, in blood of patient 2. This difference in XIR between the assays might be explained by the low number of methylation sites that are analysed. When using only one (PCSK1N and SLITRK4) or two (AR) methylation sites, this might not always reflect the methylation status of the complete locus. Indeed, it was shown for the HumARA that DNA methylation not always corresponds to relative expression of the two alleles.24 Expression of the PCSK1N and SLITRK4 loci has not been compared with methylation status, but instead with AR methylation.17 Theoretically, the three assays may also differ because of tissue-specific gene silencing, independent of X inactivation status. Altogether, this difference shows that analysing a single methylation site might not be representative for the inactive status of an entire X chromosome, and using three loci increases reliability.
The tissues that were used in this study were collected during autopsies of women that died of various causes, and theoretically several clinical conditions might affect the XIR of different tissues. In case of cancer or cytostatic therapy the XIR of all analysed tissues could theoretically be affected. Any tissue could be affected by cancer, altering the XIR through monoclonal expansion of the primary tumour or metastases. In addition, cytostatic therapy could also affect any tissue by dramatically reducing the number of stem cells, resulting in oligoclonal expansion and a secondary skewed XIR. In both conditions the expected result would be a shift of the XIR towards extremely skewed XCI, which was not observed. In several other individuals, the T lymphocyte composition in peripheral blood, that was used to assess XIR, could have been altered. First, the occurrence of infection and sepsis is likely to alter T lymphocyte composition in the peripheral blood samples analysed. However, this is not likely to skew the XIR, as this would require an oligoclonal expansion of thymocytes and during an immune response a larger number of thymocytes will be activated. Therefore, it can be considered unlikely that infection or sepsis will affect the XIR. Second, after major blood loss the peripheral T lymphocyte population is largely lost and needs to be replaced. However, as the peripheral T lymphocyte population is a reflection of the stem cell population, it is not likely that the population of newly circulating T lymphocytes will have a different XIR. An erythrocyte transfusion will not affect the XIR of a peripheral blood sample, as erythrocytes are enucleated cells. In none of the individuals suffering from any of the conditions that could alter the peripheral T lymphocyte population extremely skewed XCI was observed. Although this argues against an oligoclonal expansion, we cannot exclude that these conditions have affected the XIR of peripheral blood to a small degree.
The comparison of tissue-specific XIRs yielded an interesting correlation pattern for hair follicle, as hair follicles display a weak correlation with all inaccessible tissues, except ovary. Contradictory to our results, a previous study analysed XIRs in hair follicles of 21 individuals and found a significant correlation to blood XIR (r=0.67; p=0.009).25 One possible explanation for this difference is the number of hair follicles used to assay XCI. We used 20 hair follicles, where Kaupert et al used 3–4 follicles to assay XCI. Hair follicles originate from a small number of precursor cells, and the chance that a hair follicle is monoclonal regarding XCI status has been estimated around 50%.26 Consequently, using a smaller number of hair follicles, increases the chance that patch size confounds XIR analysis. Given the strong correlation between hair follicles and ovary, we conclude that when interested in the XIR of an ovary, of use in, for instance, patients with PCOS, testing XCI in hair follicles should be preferred over testing peripheral blood samples or buccal swabs.
The comparison of XIRs between easily accessible tissues, blood and buccal swab and inaccessible tissues demonstrated that buccal epithelium has a better correlation to inaccessible tissues compared with blood. To date most studies analysing skewing of XCI in single patients or patient populations use peripheral blood samples for analysis. A good correlation between XCI in blood and buccal epithelium has been reported earlier by two studies, and is confirmed by our results.19 ,27 However, given the stronger correlation of buccal epithelium to all examined tissues we conclude that when testing for XCI skewing, buccal swab should be the method of choice.
Many studies have reported an age-related increase of skewing in blood, occurring above the age of 60 years, which has been attributed to the oligo-clonal expansion and/or decreasing number of stem cells in older women.4 ,9 ,18 ,19 Given the small number of individuals included in this study we were unable to test for an age-related increase in skewed XCI. However, the obtained XIRs from different tissues presented a unique opportunity to test if an age-related increase in skewed XCI might be caused by a decreasing stem cell number. Indeed we find that tissue-specific XIRs within an individual diverge, although a larger number of individuals will be required to confirm this hypothesis.
In conclusion, we show that the patch size of XCI in liver, muscle, brain and ovary is small enough not to confound XIR analysis of 1 mm3 biopsies. When comparing blood, buccal epithelium and hair follicle as easily accessible tissues for assaying XIR, hair follicles show the best correlation with ovary. For all other inaccessible tissues buccal epithelium shows the best correlation. Moreover a buccal swab is non-invasive, and should therefore be considered the best and most convenient method for determining XIR.
Materials and methods
All samples used in this study were obtained from the Erasmus MC Tissue Bank, in accordance with the Dutch Law on Medical Research and autopsy materials, and were only used for research after permission was obtained through signed informed consent from the next of kin. Tissue samples for comparison of tissue-specific XIRs were collected during autopsies performed in the Erasmus Medical Centre in Rotterdam, between June 2012 and August 2014. Tissue samples were snap frozen and DNA was extracted using phenol-chloroform purification. Blood samples could not be extracted by peripheral vein puncture and were therefore obtained through cardiac puncture. Ovarian samples for XIR analysis were cut by hand from the ovarian cortex, only selecting regions that did not contain any visible follicles.
Samples for patch size analysis were obtained by cutting cryosections of 8 µm thick, from which final samples were cut by hand measuring 1–8 mm2. DNA was isolated using phenol-chloroform extraction. The number of cells in each sample was calculated back from the total amount of DNA present, assuming a single cell contains 6 pg DNA. Ovarian samples for patch size analysis were obtained during autopsies of three female individuals of premenopausal age. Samples 0.10–0.16 mm² were isolated from 14 µm cryosections using a laser microdissection microscope (Carl Zeiss PALM Microbeam).
XIRs were analysed by amplification of polymorphic repeats in the AR, SLITRK4 and PCSK1N loci. DNA samples were digested with the methyl-sensitive restriction enzyme HpaII and EcoRI, or EcoRI alone for 24 h at 37°C, followed by inactivation of the enzyme by incubating at 80°C for 25 min. The CAG repeat in the AR locus was amplified using primers TGCAGTTAGGGCTGGGAAGG and CTGTGGGGCCTCTACGATGG. The AC repeat in the SLITRK4 gene was amplified using primers GCACACAAGCAGTCCTTCCT and TGGCTTCTTGGTTGCTCTCT. The tandem CA and AG repeat of PCSK1N was amplified using primers ATGCGAAGACCATTCCCTCT and GTGCGTGTGATGTGAGGAGA. The amplified products were analysed separately on an ABI3130 genetic analyser. Correlations of XIRs between different tissues were calculated using Pearson's correlation coefficient. All individuals were pooled in a single group, regardless of their age and menopausal status.
Acknowledgments
The authors thank Ruben Boers for helping with sample collection and Guido Breedveld, Bianca de Graaf and Marialuisa Quadri for technical assistance. The authors also thank all department members for helpful discussions.
References
Supplementary materials
Supplementary Data
This web only file has been produced by the BMJ Publishing Group from an electronic file supplied by the author(s) and has not been edited for content.
- Data supplement 1 - Online supplement
Footnotes
Funding This work was supported by NWO grant number 865.10.003, and ERC grant number 260.587 to JG.
Competing interests None declared.
Ethics approval The local medical ethical committee of the Erasmus MC (MEC-2011–145).
Provenance and peer review Not commissioned; externally peer reviewed.
Data sharing statement All data published in this work are available on request. Please contact the corresponding author.