Article Text

Abstract
Background Common low-risk variants are presently not used to guide clinical management of familial breast cancer (BC). We explored the additive impact of a 313-variant-based Polygenic Risk Score (PRS313) relative to standard gene testing in non-BRCA1/2 Dutch BC families.
Methods We included 3918 BC cases from 3492 Dutch non-BRCA1/2 BC families and 3474 Dutch population controls. The association of the standardised PRS313 with BC was estimated using a logistic regression model, adjusted for pedigree-based family history. Family history of the controls was imputed for this analysis. SEs were corrected to account for relatedness of individuals. Using the BOADICEA (Breast and Ovarian Analysis of Disease Incidence and Carrier Estimation Algorithm) V.5 model, lifetime risks were retrospectively calculated with and without individual PRS313. For 2586 cases and 2584 controls, the carrier status of pathogenic variants (PVs) in ATM, CHEK2 and PALB2 was known.
Results The family history-adjusted PRS313 was significantly associated with BC (per SD OR=1.97, 95% CI 1.84 to 2.11). Including the PRS313 in BOADICEA family-based risk prediction would have changed screening recommendations in up to 27%, 36% and 34% of cases according to BC screening guidelines from the USA, UK and the Netherlands (National Comprehensive Cancer Network, National Institute for Health and Care Excellence, and Netherlands Comprehensive Cancer Organisation), respectively. For the population controls, without information on family history, this was up to 39%, 44% and 58%, respectively. Among carriers of PVs in known moderate BC susceptibility genes, the PRS313 had the largest impact for CHEK2 and ATM.
Conclusions Our results support the application of the PRS313 in risk prediction for genetically uninformative BC families and families with a PV in moderate BC risk genes.
- Polymorphism, Genetic
- Medical Oncology
- Genetic Predisposition to Disease
Data availability statement
Data are available upon reasonable request. The gene sequencing and SNP array genotyping results, and digitalised family histories of this study are part of the BCAC database. Access to the BCAC data is governed by a data access coordinating committee. If you are interested in gaining access to the BCAC data, please contact the BCAC coordinator by email (BCAC@medschl.cam.ac.uk). Summary results from the iCOGS and OncoArray projects are now publicly available and can be accessed via the links on the BCAC website (https://bcac.ccge.medschl.cam.ac.uk/bcacdata/).
This is an open access article distributed in accordance with the Creative Commons Attribution Non Commercial (CC BY-NC 4.0) license, which permits others to distribute, remix, adapt, build upon this work non-commercially, and license their derivative works on different terms, provided the original work is properly cited, appropriate credit is given, any changes made indicated, and the use is non-commercial. See: http://creativecommons.org/licenses/by-nc/4.0/.
Statistics from Altmetric.com
WHAT IS ALREADY KNOWN ON THIS TOPIC
The Polygenic Risk Score (PRS) is useful in stratifying women into different risk categories but is presently not used to guide clinical management of familial breast cancer (BC).
WHAT THIS STUDY ADDS
Including the PRS313 in addition to family history-based risk prediction may change screening recommendations in up to 34% of individuals from BC families with no pathogenic variant in any of the five BC genes modelled in BOADICEA (Breast and Ovarian Analysis of Disease Incidence and Carrier Estimation Algorithm) and up to 18% and 26% for ATM and CHEK2 pathogenic variant carriers, respectively.
HOW THIS STUDY MIGHT AFFECT RESEARCH, PRACTICE OR POLICY
This study supports the implementation of a comprehensive risk prediction and shows the impact on clinical management recommendations for women from BC families as seen in the context of clinical genetic services.
Introduction
Breast cancer (BC) is the most common cancer among women.1 Current screening strategies to reduce the burden of the disease have several disadvantages, including overdiagnosis.2 By taking into account all relevant risk factors, personalised estimation of risk of BC could help to target preventive measures to those who would benefit the most and to reduce screening for women in the lowest risk categories.
One of the main risk factors for BC is having a positive family history of the disease.3 The familial relative risk of ~2 is partly explained by germline pathogenic variants (PVs) in the BC susceptibility genes BRCA1/2, PALB2, ATM and CHEK2. Furthermore, another important part is explained by common low-risk variants,4 5 which if summarised in the Polygenic Risk Score (PRS) are useful in stratifying the population into different risk categories.5 6 A similar stratification of risk of BC by the PRS is observed in the familial setting,7–10 providing an opportunity to personalise risk and clinical management of women from BC families who are seen at clinical genetic services. Furthermore, the PRS can be useful in refining the risk of women carrying a PV in BRCA1/2, PALB2, CHEK2 or ATM.11–14 However, using the PRS for risk prediction is not yet implemented in the practice of genetic counselling for familial BC in the Netherlands.
Currently, risk prediction for women from non-BRCA1/2 BC families is mainly based on family history, which can be calculated by various well-validated risk prediction algorithms,15 16 such as the Breast and Ovarian Analysis of Disease Incidence and Carrier Estimation Algorithm (BOADICEA).17 Several studies have shown improved discriminative power between BC cases and controls by combining the PRS with other risk factors in a BC risk prediction tool.18–21 Previously, we showed that in a selected group of high-risk non-BRCA1/2 BC families, a 161-variant PRS alone would have led 20% of women to receive different screening recommendations based on the Dutch screening guideline (Netherlands Comprehensive Cancer Organisation (IKNL) guideline).22 Currently, an established PRS based on 313 variants (PRS313)5 is one of the several PRS incorporated in the validated, comprehensive risk prediction model BOADICEA,17 which was recently made easily accessible to clinicians through the CanRisk webtool.23
Here, we explore the clinical applicability of the PRS313 for risk prediction in a new cohort of 3918 familial Dutch BC cases who tested negative in a diagnostic setting for PVs in BRCA1/2 and of whom the majority were evaluated for PVs in PALB2, CHEK2 and ATM in a research setting. The clinical impact of the PRS313 on BC risk prediction based on family history and PV carrier status was investigated by determining the potential change in clinical management, as stipulated by three currently used guidelines (National Comprehensive Cancer Network (NCCN),24 National Institute for Health and Care Excellence (NICE),25 and IKNL guidelines).22
Materials and methods
We used the Strengthening the Reporting of Observational Studies in Epidemiology case–control checklist when writing our report.26
Study cohorts
Dutch familial BC cases, henceforth ‘cases’, were derived from three different cohorts: the Hereditary Breast and Ovarian cancer study in the Netherlands (HEBON),27 the Amsterdam Breast Cancer Study-Familial (ABCS-F),28 and the Rotterdam Breast Cancer Study (RBCS)29 (online supplemental methods). All three studies included participants who visited a clinical genetic centre in the Netherlands for familial BC counselling. During this counselling, a DNA test was performed according to the clinical guidelines applicable at the time. Women with BC who met the following criteria were eligible for this study: (1) negative DNA test result for BRCA1/2 PVs; (2) family without BRCA1/2 PVs; (3) available DNA sample or genotyping data; (4) European ancestry based on genotyping data; and (5) available pedigree. In total, 3918 cases were included (online supplemental figure S1). All cancers were verified by linkage to the Dutch Cancer Registry and the Pathological Anatomical National Automated Archive (HEBON cases) or by clinical confirmation from medical records in the hospital (ABCS-F and RBCS cases).
Supplemental material
In total, 3474 Dutch population controls of age 18 years or older were included. These controls were healthy female blood donors (ABCS, Oorsprong van borstkanker integraal onderzocht (ORIGO)) or healthy women who were included after DNA diagnostic testing for cystic fibrosis carrier status (RBCS)4 29 for which age of last follow-up was known. For the ABCS and ORIGO control cohorts, BC status was known to be negative at age of last follow-up. For the RBCS control cohort, BC status was unknown. In total, 2584 controls were known to be negative for BRCA1/2 PVs. For the remaining 890 controls, BRCA1/2 status was unknown.
Informed consent was obtained from all included cases. All controls were anonymised.
Gene panel
As part of the BRIDGES project (Breast cancer RIsk after Diagnostic GEne Sequencing), 2586 cases and 2584 controls were sequenced for a panel of 34 genes, as described elsewhere.30 For all controls and 2037 cases, we received variant call files of all 34 genes, including their last exons. Truncating and missense variants were reported as described previously.30 In summary, pathogenic truncating variants were defined as frameshift insertions/deletions, stop/gain or canonical splice variants as classified by the Ensembl Variant Effect Predictor,31 with the exception of variants in the last exon of each gene. In our study, we included truncating variants in the last exon of PALB2 as this exon encodes an important functional domain and variants in this exon were shown to destabilise the resulting PALB2 protein.32 Missense variants were included if their frequency in the gnomAD database or among the BRIDGES project control data set30 was below 0.001. For genes with evidence of an association with BC,30 pathogenicity was reported for missense variants based on the ClinVar archive.33 Variants that were classified as (likely) pathogenic by at least one submitter were manually curated by two experts according to the ACMG/ACP (American College of Medical Genetics and Genomics/American College of Physicians) variant classification guidelines. For the remaining 549 cases, however, only pseudo-anonymised results of truncating variants in the three additional BC genes, ATM, CHEK2 and PALB2, were received, excluding truncating variants in the last exon.
Genotyping and imputation
The DNA samples of all included individuals were genotyped for common variants with either the iCOGS,34 OncoArray4 or Global Screening Array (GSA), containing 211 155, 499 170 and 642 824 SNPs, respectively. Genotyping and quality control of the samples genotyped with iCOGS and OncoArray were performed as part of association studies conducted by the Breast Cancer Association Consortium (BCAC).4 34 Genotyping and quality control of the samples genotyped with the GSA are described in the online supplemental methods.
The variants that were not directly genotyped were imputed using the Michigan Imputation Server,35 using the Haplotype Reference Consortium (HRC) V.1.1 reference panel,36 including both the reference panels 1000 Genomes Phase 3 and Genome of the Netherlands.37 38 In total, 72 of the 313 variants could not be imputed with the HRC V.1.1 reference panel and were imputed with the 1000 Genomes Phase 3 reference panel only38 (online supplemental table S1).
Supplemental material
Polygenic Risk Score
The PRS was calculated as described previously.5 The three PRS (for overall BC, estrogen receptor (ER)-positive BC and ER-negative BC) were calculated for all included individuals. The variants and their corresponding weights used in the PRS as published previously5 and the imputation quality are listed in online supplemental table S1. The PRS for each individual was standardised to the mean of all population controls in this study and to the SD in the BCAC population controls that were included in the validation data set.5 These SDs were 0.6093, 0.6520 and 0.5920 for the overall BC PRS, ER-positive BC PRS and ER-negative BC PRS, respectively. Using these SDs, the OR estimates for the associations of the standardised PRS313 in our study are directly comparable with the OR estimates reported in the BCAC population-based study.5
Pedigree collection
Pedigrees were collected for all families and were drawn previously in the clinical genetic centres during counselling and DNA diagnostic testing of BRCA1/2 PVs. The pedigrees were used as they were drawn in the clinic, including at least all known first-degree and second-degree relatives of the genotyped individuals. Imputation of missing data is described in the online supplemental methods.
Family history score
A model-based family history score for BC, also called the ‘polygenic load’, was derived from the BOADICEA V.3 model based on the available pedigree, as described previously.7 The polygenic load in BOADICEA is a latent polygenetic component representing the combined effect of a large number of variants, each of small effect to capture the residual familial aggregation of BC and is therefore a measure of the BC family history,7 10 henceforth referred to as BOADICEAFH. No pedigree or family history data were available for the controls. Therefore, BOADICEAFH was imputed based on the distribution of BOADICEAFH (normally distributed with mean=0 and SD=1).
BC lifetime risk
As all cases had developed BC, the lifetime risks of developing a first breast tumour were calculated for all included individuals with the BOADICEA V.5 model,17 simulating an individual to be aged 1 year and unaffected. Initial lifetime risks (BOADICEAILR) were calculated based on BRCA status (all negative), pedigree information (for cases) as described above and birth year. The BRCA1 and BRCA2 mutation detection sensitivity in BOADICEA was set at 0.9. For individuals in whom information regarding PVs in the BC genes CHEK2, PALB2 and ATM was available, initial risks included the PV carrier status of these genes as well. To make it uniform for all included cases, PVs in the last exon of PALB2 were ignored. The initial lifetime risks were compared with the lifetime risks calculated with the above information and the PRS313 (BOADICEAPRS313).
Statistical analysis
The BC lifetime risks for cases and controls with (BOADICEAPRS313) and without (BOADICEAILR) inclusion of the PRS313 were compared to define the change in risk category and thus advice for BC surveillance according to three different guidelines: NICE,25 NCCN24 and IKNL.22
To define how much of the variance in the PRS313 is explained by family history in this study, the degree of correlation between the standardised PRS313 and the BOADICEAFH for cases was determined by the Pearson correlation coefficient. This coefficient was calculated as well to estimate the linear correlation between the PRS313 of the proband (ie, youngest BC diagnosis) and the PRS313 of other affected family members. If more than two family members were included, the average PRS313 of the family members was used. The association between overall BC (first breast tumour, invasive or in situ) and the PRS313 was determined with logistic regression using generalised estimating equations, adjusting for age and family history (BOADICEAFH). SEs were corrected to account for relatedness of individuals using a robust estimator of the variance. To reduce overfitting, association analyses included only cases that were not part of the development data set for the PRS313, as described in Mavaddat et al.5
In a secondary analysis, we determined the association of the PRS313 with invasive and in situ BC risk separately. Cases that developed an invasive BC after the development of an in situ BC were only included in the invasive BC analysis with the age of diagnosis of the invasive breast tumour. Two of these cases were excluded because the age of diagnosis of invasive breast tumour was unknown.
In addition, the association between risk of BC and the prevalence of a truncating variant in each of the 34 genes included in the BRIDGES gene panel30 was determined with a two-sided Fisher’s exact test.
Statistical significance was established at 5%. Analysis was performed using R V.4.0.3.39
Results
The analyses included 3918 cases from 3492 families and 3474 female population controls. In the association analyses, a subset of cases were included, that is, those not included previously in the development data set of the PRS313.5 These comprised 1968 cases from 1602 families (online supplemental figure S1 and table 1).
Characteristics of the participants
The characteristics of the included cases and controls are shown in table 1. The mean age at last follow-up for controls and age at diagnosis for cases was similar, 45 years, with an age range between 18 and 93 years. Most of the included cases had an invasive breast tumour (91%), 8% an in situ breast tumour and 1% a tumour of unknown invasiveness. Of all included cases, 18% developed a second breast tumour. The standardised PRS313 was higher for cases compared with controls, with a mean of 0.71 (SD=0.96) compared with 0 for controls (SD=1.03). The distribution curves and descriptives of the standardised PRS313, ER-positive PRS313 and ER-negative PRS313 are shown in online supplemental figures S2 and S3 and online supplemental tables S2 and S3. In total, 218 (8.4%) cases and 47 (1.8%) controls were carriers of a truncating PV in either ATM, CHEK2 or PALB2, excluding PVs in the last exon.
Gene panel results
The BRIDGES study30 completed sequencing for 2037 cases with clinical data and 2584 controls. Truncating (likely) PVs were found in 22 of 34 genes for 227 (11.1%) cases and 105 (4.1%) controls (online supplemental table S4). The majority (6.4% of cases, 1.2% of controls) had a truncating variant in CHEK2, which, in all except one, was the founder PV c.1100delC. In addition, truncating variants were relatively frequently found in ATM, FANCM and PALB2 (1.8%, 0.7% and 0.6% of cases and 0.3%, 0.6% and 0.3% of controls, respectively). The number of (pathogenic) missense variants is listed in online supplemental table S5.
PRS-based individualised risk score
Adding the PRS313 into the BOADICEA model (BOADICEAPRS313) changed the absolute lifetime risk of almost all women (figure 1) to a maximum of 34.5% for cases and to a maximum of 22.1% for controls (online supplemental figure S4 and online supplemental table S6). Clinically relevant shifts, that is, from one to another screening category, based on the IKNL,22 NICE25 or NCCN24 guidelines, were 32.4%, 36.0% and 25.7%, respectively, for 1331 cases without a gene test result (ie, only tested negative for a BRCA1/2 PV in diagnostic setting) (table 2 and online supplemental tables S7 and S8). Similar results were seen for 2369 cases that were known non-carriers of a PV in PALB2, CHEK2 and ATM. In both groups and all age categories, a higher percentage of cases shifted to the moderate-risk and high-risk category compared with the lowest risk category (online supplemental table S9). Change towards higher risk categories was less frequent in controls than in cases (online supplemental tables S7 and S8). For cases carrying a PV in ATM or CHEK2, the proportions changing risk category were 26.3% and 17.9%, respectively, for IKNL, and 23.4% and 17.9% for NICE guidelines, but substantially lower based on the NCCN guideline (6.7% and 0.0%); this was due to the single cut-off point of 20% in the NCCN guideline. The 10 PALB2 PV carriers in the study did not change risk category based on any of the three guidelines.

Change in individual breast cancer lifetime risk after including the PRS313. Scatter plot of the change in breast cancer lifetime risk. For every individual, BOADICEAILR was plotted against BOADICEAPRS313. Non-carriers do not have a pathogenic variant in ATM, CHEK2 or PALB2 in addition to BRCA1/2. The solid lines represent the 20% and 30% breast cancer lifetime risk cut-off levels based on the Dutch IKNL breast cancer screening guideline.22 BOADICEA, Breast and Ovarian Analysis of Disease Incidence and Carrier Estimation Algorithm; BOADICEAILR, initial breast cancer lifetime risk at age 80 based on BRCA status (all negative), CHEK2, ATM and PALB2 status (if applicable), pedigree information (for cases), and birth year. BOADICEAPRS313, breast cancer lifetime risk at age 80 including the PRS313 in addition to initial breast cancer lifetime risk; IKNL, Netherlands Comprehensive Cancer Organisation; PRS, Polygenic Risk Score; PV, pathogenic variant.
Breast cancer lifetime risk category change based on the IKNL guideline
Of the 890 controls without a gene test result for ATM, CHEK2 or PALB2 status, 4.4%, 12.0% and 4.4% changed to another risk category based on the IKNL, NICE and NCCN guidelines, respectively. Similar results were seen for the group where no PV was found. For CHEK2 PV carriers, and to a lesser extent ATM PV carriers, these percentages were higher. Similar to cases, no change in risk category was seen for the seven controls with a PALB2 PV carrier with either of the three guidelines.
The distributions of the absolute lifetime risk after including the PRS313 for all groups (BOADICEAPRS313) are shown in online supplemental figure S5.
Correlation analysis
For cases, there was a very weak correlation between the PRS313 and the BOADICEAFH (r=0.053, p=8.23×10⁻⁴); only 0.3% of the variance in the PRS313 is explained by family history. This poor correlation is visualised in online supplemental figures S6 and S7, where respectively the continuous and categorical BOADICEAFH are shown versus the PRS313.
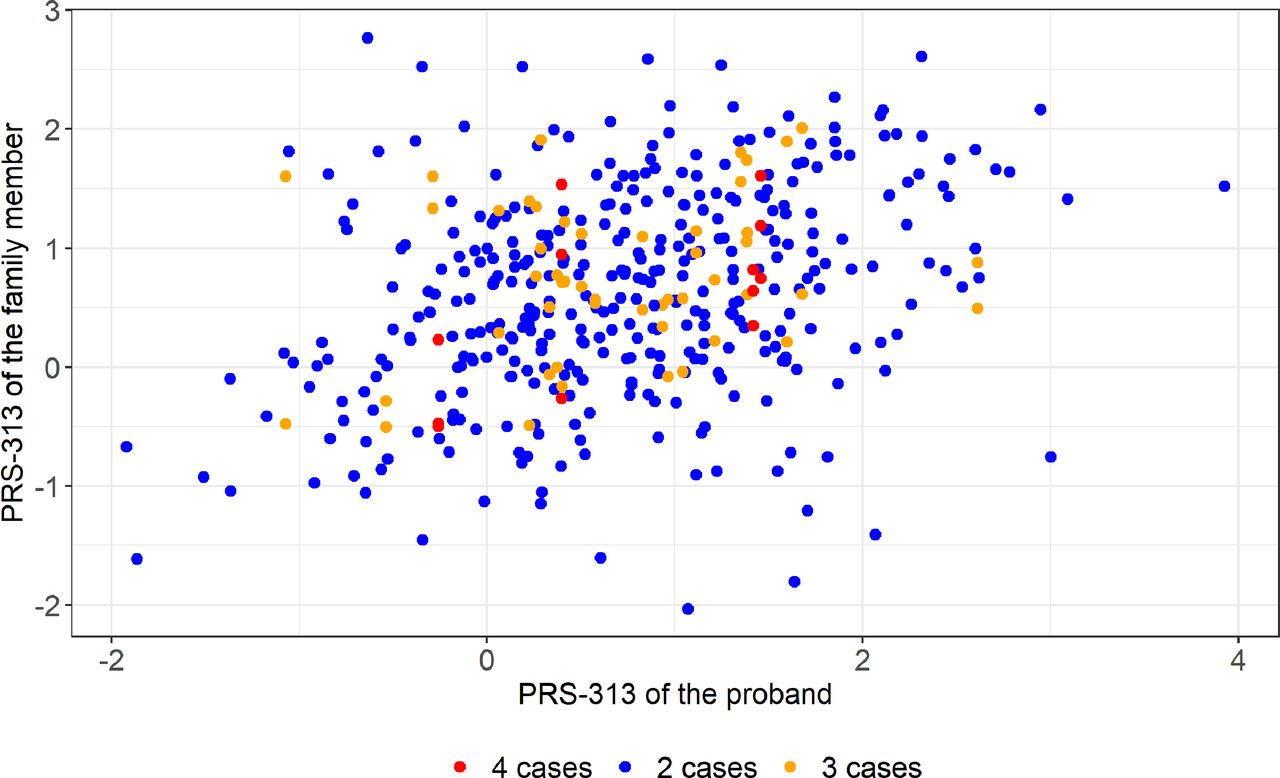
In contrast, there was a significant correlation between the PRS313 of the 393 probands and that of their affected family members (r=0.333, p=1.00×10⁻¹¹; figure 2).

Correlation between the PRS313 of the proband and their family members. Scatter plot of the PRS313 of the proband (youngest breast cancer diagnosis) and their family members. Families with two individuals included are shown as blue dots, three individuals included with orange dots and four individuals included with red dots. PRS, Polygenic Risk Score.
Association analyses of PRS and BC
The PRS313 was significantly associated with overall BC (OR per SD=1.97, 95% CI 1.84 to 2.11, p≤2.00×10⁻¹⁶) (table 3 and online supplemental figure S8). The analyses per decile followed the trend for the continuous PRS313, despite the CIs of the two lowest and highest categories not overlapping with the continuous line (table 3 and online supplemental figure S9).
Results of the association analyses between breast cancer and the PRS313
Secondary analyses for invasive BC showed similar results. In situ BC was also significantly associated with the PRS313 (OR=1.69, 95% CI 1.50 to 1.89, p≤2.00×10⁻¹⁶) (table 3 and online supplemental figure S8).
Discussion
In this study, we have shown that including a well-validated PRS for BC based on 313 variants5 leads to substantially different patient stratification from current clinical practice, in which only family history is included in risk prediction. This supports the implementation of the PRS313 in standard care for individuals from these families in clinical genetic services. Using a validated, comprehensive risk prediction model, BOADICEA,17 40 pedigree-based family history can be easily combined with the individual PRS313, as well as with gene panel results, to calculate personal BC lifetime risk. We have shown that this procedure leads to a different risk category and corresponding clinical advice for substantial numbers of both non-carriers and carriers of a PV in a moderate BC risk gene. Furthermore, our results confirm the association between risk of BC and the PRS313 in familial BC cases in the Dutch population.5 41
For ATM and CHEK2 PV carriers, previous studies showed that including the PRS is of additive value for risk prediction and risk management.13 14 42 A population-based study using a PRS of 105 variants13 and a case–control study using a PRS of 86 variants14 found similar results for CHEK2 PV carriers and showed that there is no need for intensified breast screening for about 30% of the women. Dissimilar percentages were found for ATM carriers; about 50% based on the PRS105 but a substantially lower percentage using the PRS86 would not need intensified screening after including the PRS.13 14 These results were based on the NCCN guideline, with a single cut-off of 20% guiding clinical management. Compared with these results and using the same guideline, we found a slightly higher percentage of CHEK2 carriers in the unaffected population would have received different screening advice (39%), but a much lower percentage (7%) for cases with a positive family history. Although we did not see a shift in screening category for PALB2 carriers, there was an absolute risk difference, with a maximum of 9.8% for cases and 4.8% for population controls, corresponding to a lifetime risk range of 47%–91% for cases and 48%–56% for controls. A previous study found a similar effect for cases by including the PRS.43 Such differences in risk could inform choices regarding preventive surgeries. It is to be expected that we will have a more extensive PRS for BC in the future, knowing that the PRS313 explains about half of the estimated part of the familial relative risk that could be explained by common low-risk variants4 5 and that recent studies already discovered 38 novel BC susceptibility loci at genome-wide significance level.44 45 Using a more extensive PRS in the future possibly gives an even better risk stratification and may lead to a higher percentage of women shifting to another risk category.
Our study did not have enough power to perform an association analysis between the PRS and BC for PV carriers in PALB2, CHEK2 or ATM. However, previous studies showed that the per-SD effect size of a PRS with BC in PV carriers of moderate BC genes, such as CHEK2, is similar as in non-carriers or untested individuals,13 46 but lower in carriers of PV in BRCA1/2. 12 Few studies have been performed on ATM or PALB2 carriers, but a recent study showed that the effect sizes of the associations were in between those for BRCA1/2 and CHEK2. 14 However, BOADICEA assumes that the effect of the PRS is similar for non-PV carriers and carriers of a PV in the genes PALB2, ATM and CHEK2, that is, PVs and the PRS contribute to risk independently. This may need some adjustment once the exact per-SD effect sizes and interactions are known for these specific genes.
We found a higher effect size for the association between BC and the PRS313 (OR=1.97, 95% CI 1.84 to 2.11) than found in the population-based cohorts of BCAC (OR=1.61, 95% CI 1.57 to 1.65)5 or the Dutch population (HR=1.56, 95% CI 1.40 to 1.73).41 This can possibly be explained by a higher genetic predisposition in families that visit the clinical genetic centre for counselling. Although we adjusted for family history, the weak correlation between the PRS and family history showed that adjustment for family history does not suffice to correct for the higher genetic predisposition based on the common low-risk variants. Furthermore, family history (BOADICEAFH) of the controls was imputed based on the assumption that the family history in controls was normally distributed with mean=0. This might have introduced bias since the real family history of each control is unknown.
The virtually absent correlation between family history and the PRS313 was found in previous studies as well,7 10 19 underscoring the additive value of including the PRS in family-based risk prediction. However, to avoid double-counting this requires careful joint consideration of family history and an explicitly measured PRS as provided by the BOADICEA algorithm. Altogether, risk stratification using the PRS in addition to family-based risk prediction in non-carriers and PV carriers highlights the need for using a comprehensive model including the PRS to calculate individual BC lifetime risks to guide screening and prevention advice. Of note, there is also no evidence that the per-SD PRS313 OR differs across strata defined by lifestyle and hormonal risk factors.47
The strengths of this study include the detailed family history that was available for the cases. As we used only cases who visited clinical genetic centres for counselling, this cohort is a good representation of the families that are seen in a clinical genetic context. Furthermore, our results are based on a well-validated, comprehensive risk prediction model, BOADICEA, which has been shown to have accurate risk predictions for the general population and in familial setting.40 41
A limitation of this study is that we had only data for women of European ancestry, even though some studies have shown that (a subset of) the PRS313 is associated with BC in other ancestries as well.48 49 For Asian48 and Latina49 populations, the PRS showed similar performance as in the European population, but for the African population50 there was an attenuated effect size. Therefore, caution is needed for comprehensive risk prediction including the PRS for women of African ancestry.
In summary, including the PRS313 in family history-based risk prediction may change screening recommendations in up to 34% of individuals from families with no PVs in any of the five BC genes modelled in BOADICEA. Adding the PRS313 also had a large impact on screening recommendations for ATM and CHEK2 PV carriers. Because BOADICEA has been prospectively validated and calibrated,40 41 clinical implementation of comprehensive risk prediction should be considered, although this will be a logistic challenge for clinical genetic centres and would require clinical geneticists to become aware of its limitations.
Data availability statement
Data are available upon reasonable request. The gene sequencing and SNP array genotyping results, and digitalised family histories of this study are part of the BCAC database. Access to the BCAC data is governed by a data access coordinating committee. If you are interested in gaining access to the BCAC data, please contact the BCAC coordinator by email (BCAC@medschl.cam.ac.uk). Summary results from the iCOGS and OncoArray projects are now publicly available and can be accessed via the links on the BCAC website (https://bcac.ccge.medschl.cam.ac.uk/bcacdata/).
Ethics statements
Patient consent for publication
Ethics approval
This study involves human participants and was approved by NKI-AVL: pTC11.1799; LUMC, P06.021; EMC, MEC-2011-471; UMCG, 011/303; UMCN, 2015-2207; UMCU, 11/339; UMCM, 11-4-089; VUmc: 2011-253. Participants gave informed consent to participate in the study before taking part.
Acknowledgments
We would like to thank Mary Velthuizen (University Medical Center Utrecht), J Margriet Collée (Erasmus Medical Center Rotterdam), Wendy Prager-van den Smissen (Erasmus Medical Center Rotterdam), Daoud Ait Moha (The Netherlands Cancer Institute - Antoni van Leeuwenhoek Hospital), Jan C Oosterwijk (University Medical Center Groningen), Janet R Vos (Radboud University Medical Center), Jeroen FJ Laros (Leiden University Medical Center) and Adri JM Krol (Leiden University Medical Center) for collecting and converting the pedigree files of the included families.
References
Supplementary materials
Supplementary Data
This web only file has been produced by the BMJ Publishing Group from an electronic file supplied by the author(s) and has not been edited for content.
Supplementary Data
This web only file has been produced by the BMJ Publishing Group from an electronic file supplied by the author(s) and has not been edited for content.
Supplementary Data
This web only file has been produced by the BMJ Publishing Group from an electronic file supplied by the author(s) and has not been edited for content.
Footnotes
Contributors Conceptualisation: PD, CJvA, IMML, MR-G. Collected the data: IMML, MEB, NC. Formal analysis: IMML, MR-G, AL. Resources: all authors. Supervision: PD, CJvA, MKS, MR-G. Writing—original draft: IMML, PD, CJvA, MKS, MR-G. Writing—review and editing: all authors. Guarantors: PD, CJvA.
Funding This work was supported by the Dutch Cancer Society (KWF) (grant UL2014-7473).
Competing interests AL is listed as an inventor of BOADICEA V.5, which is commercialised through Cambridge Enterprise, part of Cambridge University.
Provenance and peer review Not commissioned; externally peer reviewed.
Supplemental material This content has been supplied by the author(s). It has not been vetted by BMJ Publishing Group Limited (BMJ) and may not have been peer-reviewed. Any opinions or recommendations discussed are solely those of the author(s) and are not endorsed by BMJ. BMJ disclaims all liability and responsibility arising from any reliance placed on the content. Where the content includes any translated material, BMJ does not warrant the accuracy and reliability of the translations (including but not limited to local regulations, clinical guidelines, terminology, drug names and drug dosages), and is not responsible for any error and/or omissions arising from translation and adaptation or otherwise.