Article Text

Statistics from Altmetric.com
Editor—Prader-Willi syndrome (PWS) is a genetically determined disorder in which the absence of expression of one or more maternally imprinted gene(s) in the chromosomal region 15q11-13 results in a characteristic facial appearance, learning disabilities (mental retardation), and severe overeating behaviour owing to an abnormal satiety response to food intake, together with a range of other behaviours. Initially, as reported by Praderet al,1 PWS was conceived as a syndrome of obesity, short growth, cryptorchidism, and mental retardation following hypotonia in the neonatal period. As more and more people with PWS were reported and research into the syndrome began, behavioural characteristics and other clinical features were added, culminating in the consensus diagnostic criteria.2Concurrently, the genetics of the disorder were receiving attention. First was the discovery that for many there was a visible chromosomal deletion in the proximal part of the long arm of chromosome 15 (15q11-13). Reports of an apparently similar deletion being associated with a phenotypically very different syndrome (Angelman syndrome, AS),3 and the observation that PWS was the result of a deletion on the chromosome 15 of paternal origin, and AS the chromosome 15 of maternal origin, led to the recognition that gender specific imprinting of genes at that locus accounted for two diverse syndromes being associated with apparently similar chromosomal deletions.4 Maternal chromosome 15 disomies, mutations of an imprinting centre, and chromosomal translocations accounted for non-deletion cases of PWS.5
In published reports on Prader-Willi syndrome (PWS), prevalence has been variously quoted as “about 1 in 25 000 live births”,6 “between one in 25 000 and one in 10 000 live born children”,7 “[estimates] vary 6-fold from 1 in 5000 to 10 000; 1 in 10 000; 1 in 15 000; 1 in 25 000; to 1 in 10 000 to 30 000”.8 Only two estimates appear to be based on epidemiological data, those of Akefeldt et al 7 and Burd et al.8 In the latter North Dakota study, the authors surveyed paediatricians, neurologists, and clinical geneticists and also contacted the state's comprehensive evaluation centre, the state hospital, the state institution for the “mentally retarded”, and group homes for the developmentally disabled, including one for people with PWS. In most communities, at least four of these sources of information were consulted. Each was sent a one page questionnaire pictorially illustrating the signs of PWS to aid identification. The response rate was 99%. These procedures yielded eight males, eight females, and one person whose gender was not given, with an age range from 9 to 30 years. At that time the population of North Dakota for that age range was 263 444, giving a prevalence rate of 1:16 062, equivalent to 1:38 395 in the entire population. No figures were given for the number of cases with a genetic diagnosis.
In the study of Akefeldt et al,7 the authors estimated the prevalence of PWS in the age range 0 to 25 years in the rural Swedish county of Skaraborg, by surveying paediatricians, neuropaediatricians, child psychiatrists, school health visitors, general practitioners, and doctors working in the fields of general medicine, rehabilitation, and mental disabilities. The authors circulated diagnostic criteria for PWS to these professionals and also invited all school nurses in the county to seminars where PWS was described. Requests were made that all people with possible PWS be notified to them. All people with possible PWS were examined by a neuropaediatrician, a child psychiatrist, a child psychologist, and a speech pathologist. Clinical diagnoses were made on the basis of their findings. Eleven people (seven male and four female) were considered definitely to have PWS and a further five (two male and three female) were considered probable. These numbers gave a population prevalence of “clear PWS” up to the age of 25 years of 1:8 500 and between 7 to 25 years 1:8000. If the people with suspected PWS were also included, these prevalence rates became 1:6700 and 1:5000, respectively.
These different population estimates can be reconciled in several ways, including sampling errors, differences in ascertainment, high mortality rates between the ages of 25 and 30, or varying prevalence rates in different populations. The first two of these probably apply, at least to some extent. High mortality rates have never been reported as specific to a particular age group. The final explanation is at odds with the accepted view of PWS as a randomly occurring de novo genetic mutation. This accepted view is supported by the fact that in both studies the gender ratio is close to 1:1, if, in the Swedish study, people with “probable” as well as “definite” PWS are counted. Clearly, if the explanation was that prevalence rates vary depending on the population studied, then these estimates cannot be generalised to other countries.
We describe a population prevalence study in the UK that was undertaken as part of a larger study investigating the heterogeneity of the PWS phenotype. The aim was to locate all definite or possible cases of PWS in the previous Anglia & Oxford Health Region, comprising the counties Bedfordshire, Berkshire, Buckinghamshire, Cambridgeshire, Norfolk, Northamptonshire, Oxfordshire, and Suffolk (population approximately 5 million people). All ages were to be included, so as to obtain some estimate of mortality rates in the PWS population, and as far as possible the diagnosis was confirmed by the routine diagnostic method using SNRPN methylation,9 or, if that was not possible, the presence of accepted diagnostic criteria.
Methods
Since the ideal method of random sampling is impractical for rare disorders requiring clinical diagnosis, the method of counting all known cases in the region was used, as it was in the studies quoted above. The size of the region studied was chosen after administrative and statistical considerations. The region chosen comprises approximately five million people, about one tenth of the population of England and Wales. Using a Health Region is advantageous administratively, since ethics committees and laboratory and clinical facilities are region based. The population prevalence rates found in the previous studies quoted above, together with statistical power considerations, suggested that the study of the phenotype would require a population of at least this size.
Health, education, and social services professionals (as detailed in the ) were contacted and sent a list of common PWS characteristics and asked if they knew of anyone fulfilling at least half of these (see ). In addition, the UK PWS Association was asked to advise about numbers known to the Association living in the study area. To preserve anonymity, initials, gender, and date of birth (or age) of their nominees were requested; these were necessary in order to avoid double counting of people who possibly had the syndrome. They were also asked if they were prepared to forward a letter from us to the person with PWS inviting their participation in the phenotypic study. (Note that anonymity and indirect contact were conditions of ethical approval for the study; therefore no other details are known of people nominated who did not contact us). All responders who were willing were recruited into the phenotypic study for cognitive assessment of the person with PWS and in depth interviews (including a section asking about the presence or not of the symptoms included in the consensus diagnostic criteria) with a parent or main carer or both. Blood samples were later collected from all those who were willing and able to provide samples. In some cases, when the subject was unwilling or there were difficulties obtaining a sample, permission was given for access to previous genetic records. For most participants in the phenotypic study, therefore, a diagnosis of PWS could be confirmed either clinically (parents/carers were asked at interview about the presence or not of consensus diagnostic criteria) and/or genetically. In the region, there is a collection of group homes for people with PWS. Only those funded from within the study region were included in the population part of the study, the others coming from outside the region.
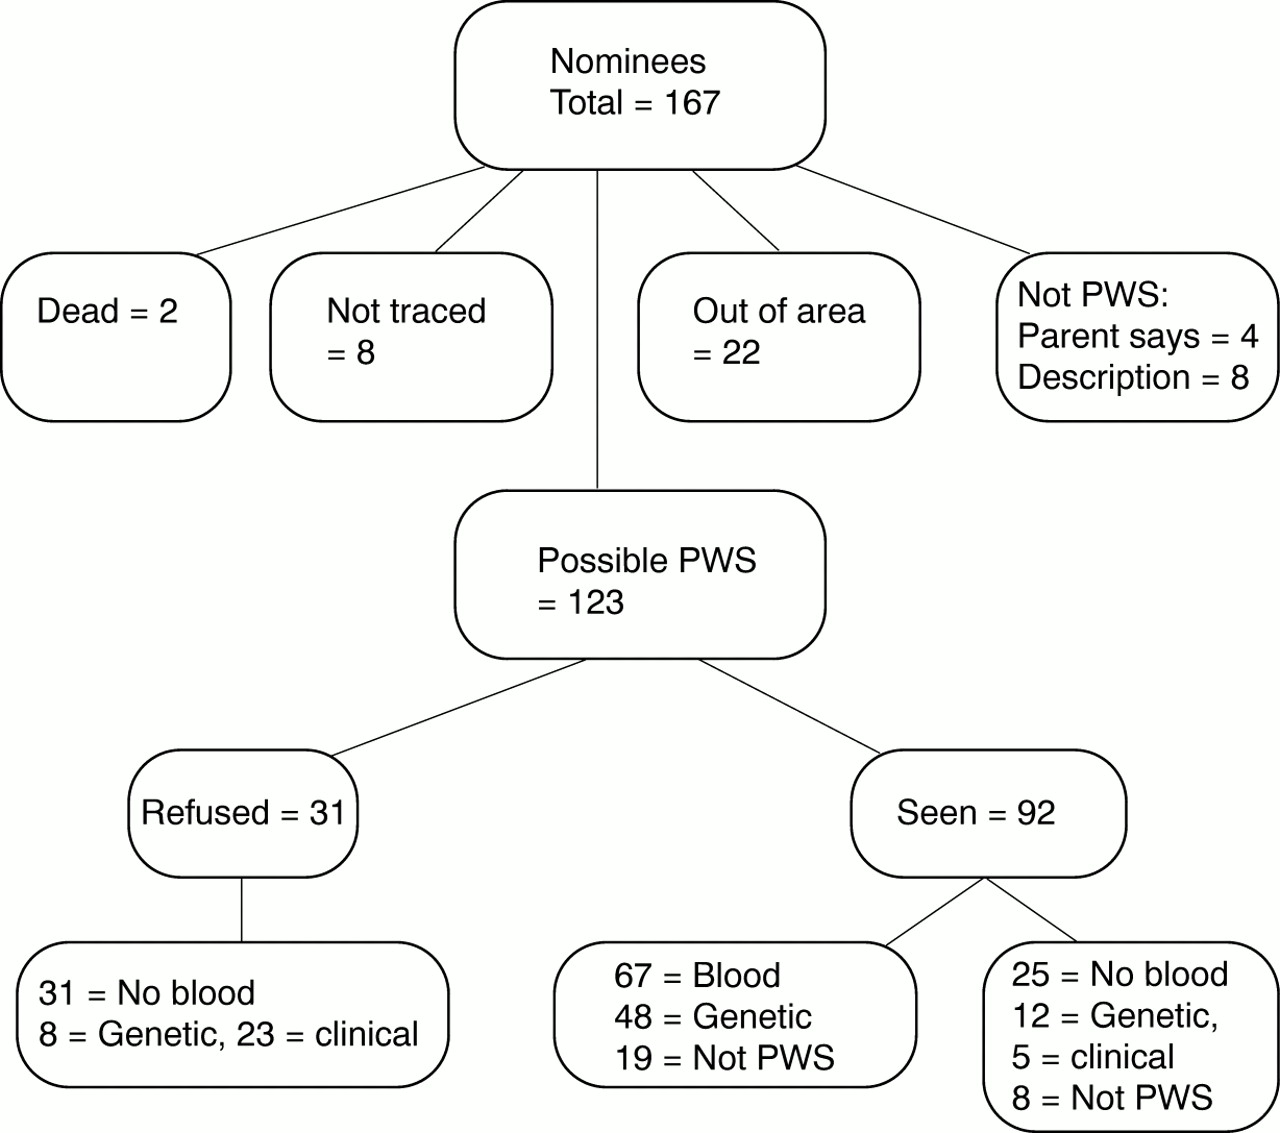
During the active period of the study, between September 1998 and June 2000, 167 people with a diagnosis of PWS or with PWS symptoms were notified to us from the sources listed earlier, including nominations by parents and other relatives of people with eating problems and other PWS symptoms who responded to media appeals. Fig 1 shows the breakdown of this group in terms of participation in the phenotypic study, blood samples obtained, genetic test results, and clinical diagnoses. This figure shows that after eliminating those nominees who were found to have died, were untraceable, found on preliminary investigation not to have PWS, or had moved out of the region, 123 people with possible PWS were included. Of these 123, 31 with a previous diagnosis of PWS did not wish to participate in the phenotypic study, and therefore the only data are those provided by those who referred the person to the research study. Eight of these were from genetic laboratories, and in the remaining 23 cases the genetic status was not given. Many (75) of the 123 nominees were from multiple sources, as detailed in table 1; many were nominated as “maybe”, particularly parental nominations. None of the 31 not seen were “maybe”. Table 1 also gives the hit rates (that is, number of positive cases) for the cases seen among the various sources.
Breakdown of group.
Population classification of nominees by source
Among the 92 who agreed in principle to participate in the phenotypic study, genetic testing was possible for 67 participants. Of the other 25, eight were considered not to have PWS at interview. With 12, results of previous genetic tests were obtained confirming the diagnosis. The remaining five were included as they met clinical criteria. Altogether, 27 people out of 92 were deemed not to have PWS (the above eight on clinical grounds only, 11 on both clinical and genetic grounds, a further eight on genetic grounds) and 65 met clinical and/or genetic criteria. Our report is based on the latter group (65 people) and the 31 who did not wish to be involved in the larger study, giving a total of 96.
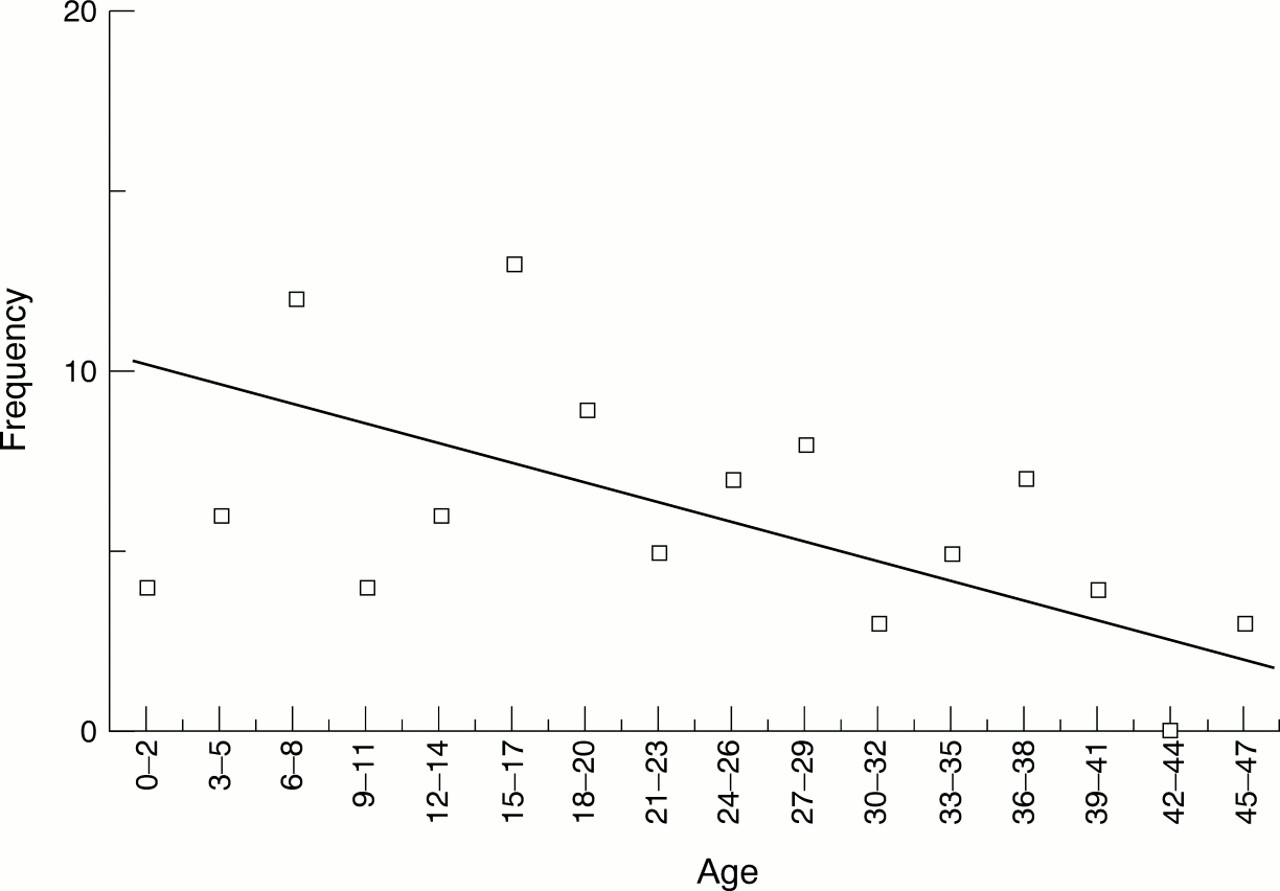
Fig 2 shows the frequencies by age (standardised to midnight 31.12.99) of these 96 people.

Frequencies by age.
Results
There are two obvious potential sources of error in our results, false positives and missing cases. With respect to the former, among those people seen, we have 60 with genetic confirmation and five who did not have a genetic test (three refused, two tried and failed) but met clinical diagnostic criteria. Among the 31 not seen, eight had genetic confirmation; table 1 suggests that at least 80% of the others are expected to be positive, so that we should expect at most five false positives even before consideration of the firmness of the nominations, which led us to include all cases.
With respect to missing cases, we believe this to be more of a problem for several reasons. The weakest evidence for missing cases is regional variations in prevalence, much stronger are age by county and gender variations.
Table 2 gives the numbers of people with PWS divided according to each county. The overall population rate was 1:52 000, with county rates varying from 1:42 000 to 1:67 000 (not statistically significant). This could indicate that identification was better in some areas than in others, and a conservative estimate suggests that there may be another seven people with PWS within those counties with low reported rates. But such variation may also indicate random variation and that the two previous prevalence study estimates can be reconciled by random sampling. North Dakota is similar in population size to a single county, while Skaraborg is only half that population size.
Numbers, gender differences and ages of people with PWS identified by county
Ages were standardised to midnight on 31 December 1999. Table 3 gives the numbers of people with probable or definite PWS across the age range. Assuming that roughly the same number of babies with PWS are born every year, an examination of the overall age structure of our sample suggests that some very young children with PWS may not yet have been diagnosed (table 3), awaiting the onset of eating and behavioural problems to prompt investigations. (This is supported by age at diagnosis data collected in interviews; new diagnoses were common in the first year and between 3 and 5 years). If we assume a zero mortality rate for children under 6, table 3 suggests that as many as five children with PWS may not yet have been diagnosed. The age structure of identified cases within counties also supports the “missing cases” hypothesis. In Norfolk, for example, only one person under 18 years out of 13 was identified, while in Berkshire there was only one person with PWS over 17 years out of 11 identified.
Numbers across the Region divided by age and sex
In all but one county, we found more males than females (55 males, 33 females, eight gender not stated). Assuming that the gender ratio in PWS is close to unity, as the two previous studies found, it therefore seems that females with PWS were either specifically not being diagnosed or were less likely to be referred to the study than males, and we estimate there may be between 14 and 30 more females with PWS in the region. Of the four infants aged 0-2, three were male, and in both Cambridgeshire and Norfolk we found six more males than females (table3).
Unlike the previous population studies which yielded 17 probable cases, age range 9-30, in North Dakota and 16 cases, age range 0-25, in Skaraborg, we have a sufficiently large sample to look at age frequencies. A number of different methods are available to estimate birth incidence from the raw data (which is shown at the top of fig 2). All methods depend on the different assumptions we are prepared to make, the chief common assumption being that PWS results from a randomly occurring genetic fault, that is, the age frequencies constitute a random sequence about a steady incidence rate. (We note that this sequence would vary slightly if we chose a different date for age standardisation.) This sequence can be smoothed in various ways, as shown in fig 2, where the data have been grouped in three year intervals and in nine year intervals. In the latter case, the data were fit by a quadratic with an R2=0.996 (an exceptionally good fit). We have also assumed no false positives in ascertainment. Assuming no missing data would then give lower bounds for the prevalence and birth incidence for a particular method of calculation of the latter.
Assuming no missing data and using the smoothed data obtained from nine year groupings, we find rates of 22, 23, 21 cases in the first three nine year periods, a rate of 1:28 000, with a zero mortality rate to age 27 and thereafter an average rate of 6.1% (from 2.44 to 0 in 20 years).
A similar calculation with eight year grouping (fit by a quadratic with R2=0.85) and rates of 17, 17, 25, 17 cases in the first four eight year periods, gives a rate of 1:29 000, with a zero rate of mortality to age 32 and thereafter an average rate of 7.9% (from 2.375 to 0 in 15 years).
The paragraphs above suggest that data are missing (females) but may be fairly evenly spread across the age groups (age by county). If this is the case, then the falling number of cases with age is probably because of mortality and we can use the whole distribution to estimate lower bounds for birth incidence and mortality rate. Fig 3 illustrates this method, where the fitted line is the result of ignoring ages 0-5 (since we hypothesised that cases might be missing in this age range, their eventual diagnosis awaiting the onset of the second phase of PWS symptoms). A straight line, as shown, was found to be near the optimum fit with R2=0.41 (R2 could be increased to 0.44 by fitting a fourth order polynomial). This would imply a steady death rate across the age groups, rather than an increasing rate with age. (Anecdotally, we were told of two people with PWS who died before we could see them, a 3-4 year old girl and a 13 year old boy). From fig 3, we see that 10.2 children are expected in the age range 0-2 (that is, in three years), giving a birth incidence of 1:20 000 in the population studied (68 000 births per year). We also see that the overall death rate in this PWS population is about 3% per year (that is, from 3.4 to 0 over 56 years). This compares with an overall death rate in the population of England and Wales of about 1% per year, and only about 0.13% per year in those up to 55 years.
Birth incidence and mortality rate.
Another set of assumptions is that advances in genetics would result in increasing numbers of accurate diagnoses, so that ascertainment by age would be a step function, with steps corresponding to identification of deletions (c 1981, age 18), maternal disomy (c 1989, age 10), and the imprinting centre methylation tests (c 1995, age 4). This is clearly not supported by our data.
A final set of assumptions are that data are missing only, or mainly, from the older age groups. This is consistent with the 8 year and 9 year groupings if we assume little or no mortality. But there are two arguments against this. First, the county data and age at diagnosis data suggest that missing cases are not confined to older age groups; in some counties such age groups are over-represented. Secondly, several older people were nominated as possible PWS and were interviewed but were found to be genetically negative, so failure to find older people was not because of lack of candidates.
Discussion
There are a number of problems related to this method of conducting a prevalence study of PWS. The three main questions are: how should PWS be defined?, do all nominees have PWS?, and do all other people in the region not have PWS?
The first question still remains to some extent unresolved as neither the genetic test nor the clinical diagnosis is 100% definitive. Although it is generally agreed that genetic abnormalities of the Prader-Willi critical region on the chromosome 15 of paternal origin underlie the clinical manifestations of the syndrome, and that the dual genetic tests used will detect probably 99% of such abnormalities, the precise gene(s) involved have not been identified and therefore a definitive genetic test is not available. From the clinical perspective, it is clear that there are other chromosomal abnormalities, such as deletions of part of chromosome 6 leading to PWS-like symptoms (one such case is known to us), which show that reliance on clinical diagnosis may result in the inclusion of those whose clinical phenotype results from a different genotype. There was one person in our population study with a score of 9 on the diagnostic criteria who was excluded when extensive genetic tests proved negative.
With respect to the second question, we cannot be certain whether everyone included in this study definitely has PWS. Some nominated did not respond to requests to take part in the phenotype study, and therefore we have had to rely on previous clinical and/or genetic data. Others did not wish for a blood test and, in the absence of a previous test, a genetic diagnosis was not possible. However, we have been restrictive about who was or was not included. We excluded all those 27 nominees who did not meet either clinical criteria (no blood), genetic criteria, or both clinical and genetic criteria for PWS. These people had normal maternal and paternal methylation patterns and gene expression at the SNRPN locus (where blood was available) and typically had less than 50% of the required diagnostic criteria. We have included 60 people who had definite genetic diagnoses and five others who had definite clinical diagnoses (in the absence of genetic confirmation). The 31 who did not wish to participate in the phenotypic study were all included as having PWS, as detailed earlier.
Our assessment of findings relevant to the third question leads us to believe that there are other people in the region who do have PWS. If it is assumed that the syndrome is indeed caused solely by random genetic error (that is, with no environmental component), it follows that prevalence should not be biased with respect to gender, race, or environment. Although some relationship to paternal occupation in the hydrocarbon industry has been described in the past, which might possibly lead to clustering,10 this has not been replicated. With the above assumptions, it is possible to look for internal consistencies within our regional sample, such as by county, by gender, or by race. There is not enough variation in racial background to test our sample with respect to race. In all but one county, we found more males than females (55 males, 33 females, eight gender not stated); this agrees with previously published reports.11 Assuming that the gender ratio in PWS is close to unity, as the two previous studies found, it therefore seems that most of any missing cases (estimate 14 to 30) will be female. This is not surprising; at all ages, suspicion of PWS is more likely in males (hypogonadism in childhood, short stature with obesity in adulthood). However, in two of the three age groups in which females did in fact outnumber males, the age group was in the over 30s raising the possibility that, with PWS, as in the general population, women outlive men. Given the assumptions about those with PWS not identified, the findings suggest that a population prevalence of 1:52 000 is a lower bound and that the true prevalence is somewhat higher, nearer to 1:45 000.
Unlike the two previous population surveys of PWS, the present survey was large enough to allow the age structure of the PWS population to be examined. We were able to estimate both birth incidence and death rate. The estimate of mortality rate assumes that there is no systematic age related ascertainment bias. For example, the age data might have been stepped corresponding to advances in awareness and diagnostic refinements, but the age structure found argues against such a cohort effect. However, it is possible that there are older adults with PWS born before the syndrome was well known and in whom the diagnosis has never been considered. While this possibility cannot be ruled out, we would argue that an increased mortality rate is the most likely explanation of the age profile of this population based cohort of people with PWS. High rates of both physical and psychiatric disorder have been reported12 and preliminary analysis of further data from this study provides evidence of significant morbidity. It would seem likely that obesity and associated complications are the main contributory factor. However, a systematic prospective study is required to establish whether this is the case or not. The physical health needs of people with learning disability are often not properly assessed or adequately met,13 and disorders such as type 2 diabetes might easily be missed in this population. There is also concern that misguided support strategies in adult life may result in marked weight increase and that resultant obesity related problems then occur.14 15
-
The identification of all people in one Health Region, who may have the genetically determined Prader-Willi syndrome, was attempted by direct contact with health, social, and educational services and through the PWS Association and by appeals through the local media.
-
From a total of 167 people referred with possible PWS, 96 were included having PWS on genetic and/or clinical grounds. Variation across the eight counties in the Health Region and observed gender differences enabled us to estimate the numbers of people with PWS which were missed by the ascertainment methods used. From the age related prevalence data, both birth incidence and mortality rate were estimated.
-
We concluded that a lower bound for the population prevalence was 1:52 000. A lower bound for the birth incidence was estimated to be 1:29 000. The mean mortality rate was estimated to be 3% per year across the age range or about 7% per year above age 30, depending on assumptions made.
-
While differential ascertainment across the age range might be a factor, we conclude that these findings largely indicate significant morbidity and associated mortality. We predict that this is because of a failure to manage weight gain in later life and thereby prevent associated obesity related health problems.
Acknowledgments
JW and JB were supported by a grant from the Wellcome Trust with further support from the PWS Association. We are very grateful to both organisations for their funding of this study. We would specifically like to thank Rosemary Johnson of the PWSA for all her administrative support, and all those people with PWS, their families, and other carers and many people who helped us with this study. This includes medical professionals, those working in genetic clinics, social services placements, education and learning disability services, and the media for contacting people on our behalf.
. Contacts with groups and professionals in search for people with PWS: PWSA (UK)
Genetics Departments - all known postholders.
Paediatricians - registered members of the Royal College of Paediatricians.
Paediatricians - listed in the Anglia & Oxford Health Region Handbook.
Psychiatrists in learning disabilities - registered members of the Royal College of Psychiatrists.
Psychiatrists in learning disabilities - listed in the Anglia & Oxford Health Region Handbook.
GPs - Cambridge area only (not cost effective).
Dieticians.
Community nurses.
County Councils
Special education.
Social services.
Special schools for learning disabilities.
Residential homes for learning disabilities.
Media - newspapers, television, radio.
Information given to contacts
Do you know anyone who has been diagnosed as having PWS or may have had five of the following characteristics?
Floppiness at birth.
Initial failure to thrive or difficulty in sucking.
The development of severe overeating and rapid weight gain in early childhood.
Obesity or the need for weight control.
Problems with sexual development (for example, undescended testes, delayed periods).
Some learning disability (mental handicap).
Small hands and feet.
Short stature or the need for growth hormone.
An abnormality of chromosome 15.