Article Text

Statistics from Altmetric.com
- ACSA, automated comparative sequence analysis
- CSA, comparative sequence analysis
- GRD, GAP-related domain
- NF1, neurofibromatosis type 1
- NIH, National Institutes of Health
Neurofibromatosis type 1 (NF1), formerly known as Von Recklinghausen Neurofibromatosis, is a common genetic disorder affecting approximately 1 in 3000–5000 people. It is a fully penetrant autosomal dominant disorder. Strict diagnostic criteria that include café au lait spots, neurofibromas, plexiform neurofibromas, freckling in the axillary or inguinal regions, Lisch nodules (iris haematomas), optic or chiasma glioma, pseudoarthrosis, and sphenoid dysplasia define NF1. Most disease features are present in more than 90% of patients at puberty.1 Further manifestations are known to occur in this disorder, including macrocephaly, short stature, learning difficulties, scoliosis and certain malignancies.2–4 There is, however, great intra and interfamilial phenotypic variability. In addition a number of patients who have a clinical picture suspected to be NF1 do not fulfil the diagnostic criteria particularly in the younger age groups. As a consequence genetic testing would have a major impact on the diagnosis and management of these families.
The NF1 gene maps to chromosome 17q11.2 and is thought to be a tumour suppressor gene because loss of heterozygosity is associated with the occurrence of benign and malignant tumours in tissues derived from the neural crest5–7 as well as myeloid malignancies.8 It spans a region of about 350 kb of genomic DNA and contains 60 exons.9–11 It harbours at least three other embedded genes—EV12A, EV12B, and ONGP—transcribed from the opposite strand of NF1 intron 27b. The NF1 gene transcribes several mRNAs in the size range 11–13 kb expressed in neurones, oligodendrocytes and non-myelinating Schwann cells.12 The most common transcript codes for a polypeptide of 2818 amino acids called neurofibromin.13–15 A 360 amino acid region of the predicted protein product shows homology with the GTPase activating (GAP) family of proteins in yeast and mammals.16 The GAP related domain (GRD) is the only known functional domain of the NF1 gene and spans exons 20–27a (bases 3497–4661). It has been found to interact with p21ras17 and GTP, and is thought to prevent uncontrolled cell proliferation by converting active RasGTP to inactive RasGDP. In keeping with this, RasGTP levels may be elevated in human NF1 peripheral nerve tumours in which neurofibromin is reduced or absent.18 This region of the gene has also been reported as representing a “hot spot” for mutations consistent with an important functional role.19 More recently, it has also been shown that learning deficiencies associated with NF1 may be caused by excessive Ras activity, which leads to impairments in long term potentiation caused by increased GABA mediated inhibition.20 A putative second hot spot in a possible functional domain upstream of GRD, comprising exons 11–17, has been described.21 The region encodes a domain rich in cysteine and serine, with three cysteine pairs suggestive of ATP binding, as well as three potential cAMP dependent protein kinase recognition sites. Further evidence for cAMP signalling being perturbed in NF1 comes from mutations in Drosophila neurofibromin that have been shown to inhibit the cAMP and protein kinase signalling pathway.
Key points
-
Neurofibromatosis type 1 (NF1) is a common autosomal dominant genetic disorder caused by mutations in the NF1 gene. Mutation detection in NF1 has been a major challenge due to the large size of the gene and lack of mutational hotspots.
-
We report here a study on 91 subjects fulfilling the National Institutes of Health (NIH) NF1 diagnostic criteria, in which we achieve a mutation detection rate of 89% using automated comparative sequence analysis (ACSA). This detection rate is the highest for a single technique and is therefore appropriate for routine clinical practice.
-
Our data show that mutations are evenly distributed along the coding sequence of the NF1 gene and not clustered at the GAP-related domain (GRD). However, we confirm the presence of a second putative functional domain upstream of the GRD at exons 11–17.
Mutation detection in NF1 has been made difficult by the large size of the gene, the existence of a number of homologous pseudogene sequences spread throughout the genome, and the lack of defined mutational hotspots. To overcome these problems, a variety of techniques have been employed for screening the NF1 gene. Most studies have been based on single strand conformation polymorphism, heteroduplex analysis, temperature gradient gel electrophoresis and denaturing gradient gel electrophoresis. In the largest study to date, involving 500 patients, Fahsold et al21 used a protein truncation test, temperature gradient gel electrophoresis, and direct genomic sequencing to examine all of the individual exons, finding sequence variants in 301 patients. Within these variants 278 mutations were considered pathogenic. In two more papers published recently, the methodologies were used sequentially to raise mutation detection rates. In the study of Ars et al22 on 80 patients, using cDNA single strand conformation polymorphism and heteroduplex analysis, a detection rate of 70–80% of mutations was achieved. Messiaen et al23 used a protein truncation test, fluorescence in situ hybridisation, southern blot and cytogenetic analysis to study 67 patients, and reported a detection rate of 95%, including a high frequency of unusual splicing defects. The sensitivity of each individual technique is hard to establish, as mutation analysis reports have either concentrated on groups of exons, included small numbers in their studies, or used a combination of techniques. In reviews of known NF1 mutations,1 several mutation types are described, but no correlation with phenotype was documented. Most of the fully characterised NF1 mutations are either nonsense or frameshift mutations, which presumably lead to premature truncation of neurofibromin. Large deletions of the NF1 gene are thought to account for less than 10% of cases. A relationship between whole gene deletions and a more severe NF1 phenotype has been reported.1
Although the application of these different techniques allows a clinically useful mutation detection rate, the extremely time consuming nature of the work makes them impractical for routine clinical work. An alternative strategy based on automated sequencing techniques would clearly be a more sensitive and informative method for mutation testing. However these techniques are not widely used as a first screen since analysis of the results can be both cumbersome and time consuming, and with current methodologies raw sequence data often require extensive manipulation before analysis. We have previously described a novel analytical approach, comparative sequence analysis (CSA), to overcome this problem.24 This technique allows automation of data analysis, with accurate analyses of 96 lanes, and is therefore achievable in 1–2 minutes. Complete processing of four 96 well plates is therefore now feasible for a high throughput team in a single day. It is particularly suited to the scanning of large genes, with large numbers of different mutations, which are expected to be in heterozygous form. Here we apply this technique to the problem of NF1 gene mutations.
MATERIALS AND METHODS
Subjects
One hundred and sixty seven subjects were screened in three batches designated D02, D04, and D05. These included 131 unrelated patients suspected of having NF1, 24 relatives of the probands, and 12 normal controls. All subjects were assessed using the criteria of the National Institutes of Health (NIH)25 to determine NF1 status. Ninety one unrelated subjects fulfilled the NIH criteria for NF1 and were categorised as definitely affected. Thirteen unrelated subjects fell marginally outside the NIH criteria and were categorised as possibly affected. The remaining 27 unrelated patients were classified as unaffected.
Polymerase chain reaction
Genomic DNA was extracted from peripheral blood using the Nucleon BACC2 kit and resuspended in TE buffer to a concentration of approximately 500 μg/ml. The entire reading frame of the NF1 gene was PCR amplified exon by exon, in a total of 58 amplicons. In general primers were designed so that each amplicon comprised an exon flanked by at least 50 base pairs of intron on either side. One primer in each pair was tailed with an M13 primer sequence (M13F, TGTAAAACGACGGCCAGT or M13R, CAGGAAACA GCTATGACC) to provide a binding site for M13 universal sequencing primer. Care was taken to ensure any repetitive sequences flanking the exon lay at the opposite end of the amplicon with respect to the M13 sequencing primer sequence. In general the PCR temperature profile was: initial denaturation at 95°C for 2 min, followed by 30 cycles with annealing for 30 s, elongation at 72°C for 1 min, and denaturation at 95°C for 30 s. Primer sequences, annealing temperatures and buffers used are given in Table 1.
Primer sequences, annealing temperatures, and buffers used for PCR reactions
Sequencing
Polymerase chain reaction products were purified by adding 1 U shrimp alkaline phosphatase (Amersham) and 10 U exonuclease I (NEB) to each reaction and incubating at 37°C for 30 min followed by 95°C for 10 min to denature the enzymes. Purified PCR products were then sequenced in a single orientation dependant on the location of the M13 tail on the PCR primers. Reaction mixtures comprised 2 μl of PCR product, 0.7 μl BigDye V sequencing reaction mix (Applied Biosystems), 1.05 μl 5×sequencing diluent (Applied Biosystems), 0.35 μl primer at 10 pmol/μl, 5% (v/v) betaine (Sigma) and ddH2O to 7 μl. Initial denaturation was at 95°C for 5 min, followed by 25 cycles with annealing at 50°C for 15 s, elongation at 60°C for 4 min, and denaturation at 95°C for 30 s. For batches D02 and D04, completed sequencing reactions were purified using Dynapure™ Dye Terminator Removal Ver.2 (Dynal AS, Oslo, Norway) according to the manufacturer’s protocol. Products were resuspended in 1.5 μl formamide and 0.8 μl dotted on 96 well RapidLoad™ membrane combs (Web Scientific Crewe, UK). The ABI 377 was loaded using the “water protocol” as described by Web Scientific. For batch D05, four plates of sequencing reactions were transferred to a single Multiscreen 384 well filter plate (Millipore, Bedford, UK) and purified according to the manufacturer’s protocol. The samples were then resuspended in 15 μl Hi-Di formamide (Applied Biosystems) with 0.05 μl GeneScan™ 500 LIZ size standard (Applied Biosystems) for each reaction and transferred to a 384 MicroAmp optical plate (Applied Biosystems) for loading on the ABI 3100.
Analysis
Analysis was carried out using an automated comparative sequence analysis (CSA) program, AutoCSA12. This will be described fully elsewhere. In brief, the technique involves horizontal alignment of each of the four base traces separately with a control trace. The program then calculates peak position and height for each base and will highlight all differences. No electrophoretograms were examined directly unless variations were called by the program. Called variations were examined in GeneScan V3 (Applied Biosystems) by non-automated CSA.24 For batches D02 and D04, horizontal alignment was achieved by generating an artificial size standard that applied arbitrary numbers to the peaks in one of the four traces (usually the red C trace). Batch D05 was horizontally aligned using the GeneScan™ 500 LIZ size standard. Sequence variations were confirmed by resequencing using a new aliquot of DNA. Fig 1 shows an example of CSA.

Example of mutation detected by CSA. Normal sequence indicated in black, test sample indicated in colour. The base represented by each track is indicated in the top left of each panel. A heterozygote point mutation is seen C>T. The half height peak in the C trace and the extra peak in the T trace can be easily seen. These differences can be read by the software program ACSA.
RESULTS
We have studied 131 unrelated subjects referred for NF1 screening. Of the 91 subjects who fulfilled the NIH criteria for NF1 we found putative mutations in 81 subjects (89.0%). In the possibly affected group of 13 patients we found putative mutations in 8 patients (61.5%). No mutations were found in any of the patients classified as unaffected. Thus, of the 104 patients with possible or definite NF1 we detected a total of 89 putative mutations (85.6%). Altogether, 77 different potentially significant sequence variations were found, of which 57 (74%) were novel. Sequence variants were classified as pathogenic mutations if they fulfilled one of the following criteria: a) they resulted in the introduction of a stop codon that truncated the protein—for example, frame shifts—or an amino acid alteration to a stop codon, b) they affected an invariant splice consensus sequence, c) they could be demonstrated to be de novo in the patient (that is, not present in the parents), d) they were previously reported as pathogenic in the literature and fulfilling any of the above or with supporting data to show that function was impaired. Table 2 provides a summary of the NF1 mutations and sequence variations found.
Summary of NF1 mutations and sequence variations found. A total of 77 different potentially significant sequence variations were found, of which 57 (74%) are novel
Mutation spectrum
By far the largest group of variations were single base pair substitutions, which were detected in 61 cases (67%). Of these, 43 (72%) were transitions and 17 (28%) were transversions, proportions corresponding closely with those observed by Ars et al.22 Mutation at CpG dinucleotides account for 20/60 (33%) of the single base pair substitutions. Of these single base pair substitutions, the most frequently detected single group of sequence variants was that of missense substitutions, which were found in 25 subjects (28%). Of these, 18 were found in patients who fulfilled the NIH criteria while seven were found in possibly affected patients. Only five of these have been previously described but a further 11 have closely related variations (affecting the same codon) in the literature. There were two mutations of note. First, the variant of codon 844 (2531T>C L844P), which was found twice in this study, and is one of at least four known variations of this codon, which was found in conjunction with a second variant affecting codon 838 (2514 C>G I838M). It is not known if these two variants occurred in trans or cis. Second, the missense variant 1722 C>A S574R, which affects the first base of exon 12a and may exert an effect by amino acid substitution or by interfering with normal splicing.
We also detected 22 nonsense mutations within the single base pair substitutions, of which 16 (73%) have been described by previous investigators. In 13/22 (59%) of the nonsense mutations the mutation occurs at a CpG dinucleotide and alters the primary base of the codon to a T (HGA>TGA), forming a termination signal.
Ten of the missense mutations affected bases potentially involved in splicing. These included five substitutions altering splice acceptors and one altering a splice donor. In addition we found two intronic deletions, which directly alter invariant splice site dinucleotides. 2991-4 del ATA changes the intron 17 acceptor site AG>TG, while 6641+1 del G appears to shift the intron 35 donor site 1 bp upstream. Three other potentially significant intronic sequence variations were found: 3113+3 ins A, 4111-8 del GTT, and 288+5 G>C. None of these has been previously reported.
A second class of mutations, frame shifts, was detected in 21 patients. Fourteen were small deletions ranging from 1 bp to 23 bp in length. In this group only 499 del TGTT and 1756 del ACTA have been previously reported by other investigators. However, four other deletions had closely related mutations described in the literature, such as 3758 to 3762 del TCTAC related to 3759 to 3763 del CTACC, which was reported by Ars et al.22 All deletions were entirely exonic except 1–14 to 7 del 21bp which deletes 14 bp of non-coding sequence upstream of exon 1 together with 7 bp of exon 1, thereby removing the start codon.
Together, frameshift and nonsense mutations that would be expected to truncate the reading frame constituted 44 of the 89 mutations detected (49.4%) in patients who fulfilled the NIH criteria. The distribution of these mutations appears to be evenly spread within the gene, with 27/44 (61%) predicted to terminate the protein in or upstream of the GRD.
A third class of mutations, insertions and deletions, was detected in 11 patients. Seven insertions were detected comprising five 1 bp insertions and two 2 bp insertions. None of these insertions has been previously described. Deletions detected included four in frame deletions; two removing a single amino acid and two removing two consecutive amino acids. Only 2970 del AAT ΔM991 and 7096 del 6 ΔNF2366-7 have been previously reported.
Four different conservative base substitutions were found in five unrelated, definitely affected patients. No other variations were detected in any of these patients and none of these conservative base substitutions were found in 260 normal chromosomes. Sequence variations 2040 C>T C680C and 5427 C>T R1808R were found in two patients in whom no other family members were available for testing at the time of writing. Another patient was found to have 5172 G>A K1724K and, on testing this patient’s parents, the affected mother was found to carry the same variation while the father was found to be normal at this position. Finally, the variation 846 G>A Q282Q was found in two unrelated patients of eastern decent.
Recurrent mutations
Twenty of the 77 novel variations were detected in more than one unrelated individual or have been previously reported by other investigators (table 2). Ten variants were observed more than once in this study. All of these variations were single base pair substitutions and seven of them occurred at hypermutable CpG dinucleotides. In this study eight sequence variations were each found in two unrelated cases; 1885 G>A G629R, 2530 C>T L844F, 3721 C>T R1241X, 4537 C>T R1513X, and 6709 C>T R2237X have also been previously reported by other investigators, whereas 3826C>G R1276G, 3827 G>A R1276Q, and 846 G>A Q282Q have not. Two sequence variations were detected in three unrelated patients; the nonsense mutation 1318 C>T R440X has been previously reported while the missense variation 1466 A>G Y489C is novel.
Two pairs of mutations were found to be very closely related, affecting a different base in the same codon. Codon 844 was alternatively mutated CTT>TTT (L844F), which was found twice and has been previously described, and CTT>CCT (L844P), which is novel and was only found in one patient. Neither 3826C>G R1276G, 3827 G>A R1276Q have been previously described and both were found in two unrelated cases in this study. However two other mutations of this codon, 3826 C>T R1276X, 3827 G>C R1276Q have been previously reported.26,27 Twenty other mutations found in this study were also found to have closely related mutations in the literature. Of particular note is 1466 A>G Y489C, which was found in three cases in this study but has not been previously reported although Fahsold et al21 reported an identical mutation of an identical codon 2 bp downstream of Y489C (1472 A>G Y491C).
Although there seems to be a general spread of mutations found throughout the gene, we found no sequence changes in exons 1, 5, 15, 20, 27b, 29, 30, 34, 35, 43, 44, 45, 47, 48, or 49.
Polymorphisms
Twenty sequence variations were found either in a normal subject or in an affected patient who already had a mutation characterised (table 3). Of these 14 had a rare allele frequency of less than 0.05 and eight were only found in a single subject in the entire study (167 subjects). Eight of the polymorphisms found were in the coding sequence and the remaining 12 all fell within 40 bases of an exon. All but three of the polymorphisms were single base pair substitutions, six being transversions and 11 being transitions, of which four occurred at CpG dinucleotides. The remaining three polymorphisms comprised two deletions involving a single T and one deletion of 5 bp.
Polymorphisms found during the mutation analysis process. Twenty such sequence variations were recorded in a normal subject or in an affected patient who had already had a mutation characterised
DISCUSSION
In this study we used direct sequencing and automated comparative sequence analysis to study 167 subjects including 91 unrelated definitely affected NF1 patients. Putative mutations were found in 81 of these affected patients (89%), which means that our study achieved the highest recorded mutation detection rate using a single technique for this gene. Given that the current estimate of whole gene deletions in this disorder is approximately 10%, this technique may therefore pick up all the remaining classes of mutations and potentially replaces all existing technologies, used either alone or together, with advantages of increased specificity and sensitivity associated with decreased cost and considerably reduced analysis times. When 96 well plates are used, an approximate cost for sequencing the entire NF1 coding region for 1 patient is £220. Although commercial sequencing centres exist that may be able to match these prices the level of quality assurance, follow up, and guarantees needed for diagnostic laboratory purposes cannot be assured. A class of mutations that would not be detected with this assay are large gene deletions, as the test is not dosage sensitive. We plan to set up a multiplex ligation dependent probe amplification assay to look for whole exon and whole gene deletions in the patients in whom we have not found pathogenic mutations by sequence analysis.
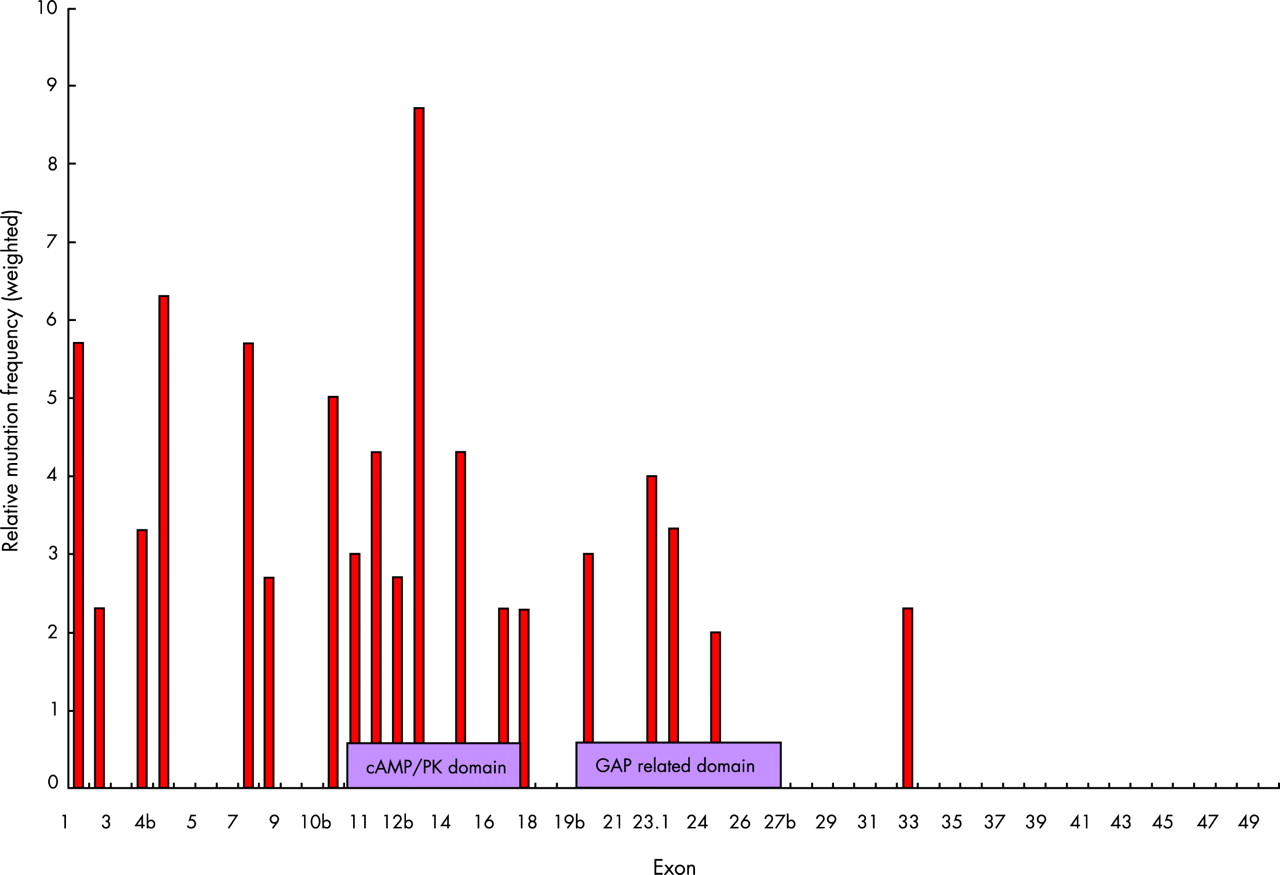
Many new mutations have been identified in our study, with 74% being novel. This confirms that there are few recurrent mutations in NF1. While we find that mutations are evenly distributed along the NF1 coding region, the scale of our present study allows further analysis of possible mutation hot spots and functional domains. The RasGAP activity of the central GAP related domain (GRD) and the structure of the GRD from neurofibromin have already been well characterised.1,28 Indeed clustering of mutations has been reported in this region, and much attention has since been concentrated on this area. The GRD is not shown to be a significant mutation hot spot in this study, with only 22% of mutations falling within this region. A second possible functional domain upstream of GRD has also been reported around exons 11–17.21 When our mutations were analysed by type and a weighted distribution was calculated for each exon, the number of missense and in frame deletions found to be clustered in this region was assessed visually and by means of a χ2 analysis on mutation percentage. This is shown in fig 2, confirming that exons 11–17 represent an important area of the NF1 protein. A similar cluster, which was termed a hot spot, was seen in the study of Fahsold et al21 although we detected more mutations in upstream exons. This region is known to be a domain rich in cysteine and serine domain, as defined by Izawa et al. This domain has three cysteine pairs suggestive of ATP binding as well as three potential cAMP-dependent protein kinase recognition sites, which are subject to phosphorylation by protein kinase.29 As abnormalities of cAMP signalling have been demonstrated in Drosophila neurofibromin mutations, it will be important to clarify further the link between cAMP and the Ras signalling pathway in NF1.

Weighted distribution of missense mutations and single base changes in the NF1 gene. The relative mutation frequency was calculated by dividing the number of missense or single base changes by the number of base pairs per exon. The value is then shown as a ratio between the exon specific mutation densities and the average mutation density for the whole gene (30/8473 bp). A clustering can be seen between exons 10–17. Between exon group and number of mutations present χ2 = 20.85, df 3, p = 0.0001. Mutation rate is greatest between exons 1–20: χ2 = 11.74, df 2, p<0.005, compared with exons 21–49: χ2 = 9.1, df 2, p<0.01.
In previous studies that examined the effect of mutations at the RNA level it was found that 50% resulted in mutations causing splicing alterations. Splicing defects therefore appear to be the most common molecular defect in NF1.22 We have developed a functional splicing assay using a minigene system,30 which will allow us to clarify the significance of point mutations including missense or silent changes. One mutation found in this study has already been studied in this way. The 288+5 G>C was found to exclude exon 3 and further investigation showed that this aberrant splicing could be rescued by co-expression of an altered U1-snRNA complementary to the mutation, proving that the mutation induces exon 3 skipping by preventing binding of U1 snRNA and thus causes the disease. This assay will be of great value in the analysis of mutations such as the previously described 6792 C>G (Y2264X), which affects splicing.22
In addition to clinical utility, the availability of a powerful mutation detection technique for the NF1 gene will allow us to address two long standing questions in NF1. First, do phenotype-genotype correlations exist? This could be studied in a large number of patients where the whole gene is sequenced and attention paid to the type of mutation and clinical sign or symptom. Second, what is the contribution of the NF1 gene to some of the rare related disorders, such as segmental NF, gastrointestinal NF, familial spinal NF and familial café au lait spots? For example, using this technique we have recently examined the rare syndrome Noonan-Neurofibromatosis where patients exhibit features of both disorders. Mutation analysis found Noonan-Neurofibromatosis to be a subset of NF1 in some cases, with mutations in the NF1 gene.31 The high sensitivity of automated CSA makes analysis of the other rare related disorders feasible.
Acknowledgments
We thank the patients and their families for their cooperation and Dr S Goodburn for help with the statistical analysis.
REFERENCES
Footnotes
-
Dr D Baralle is supported by Action Research and Prof. C ffrench-Constant is supported by the Wellcome Trust.