Article Text

Abstract
Background Several recent studies have demonstrated the use of single nucleotide polymorphism (SNP) arrays for the investigation of intellectual disability, developmental delay, autism or congenital abnormalities. In addition to LogR ‘copy number’ data, these arrays provide SNP genotyping data for gene level autozygosity mapping, estimating low levels of mosaicism, assessing long continuous stretches of homozygosity (LCSH), detection of uniparental disomy, and ‘autozygous’ regions. However, there remains little specific information on the clinical utility of this genotyping data.
Methods Molecular karyotyping, using SNP array, was performed on 5000 clinical samples.
Results Clinically significant ‘LogR neutral’ genotyping abnormalities were detected in 0.5% of cases. Among these were a single case of chimerism, 12 cases with low level chromosome mosaicism, and 11 cases with an LCSH associated with uniparental disomy. In addition, the genotyping data revealed several LCSH associated with clinically relevant ‘recessive type’ genetic defects.
Conclusions These results demonstrate the utility of SNP genotyping data for detection of clinically significant abnormalities, including chimerism/mosaicism and recessive Mendelian disorders associated with autozygosity. The incidence of clinically significant low level mosaicism inferred from these cases suggests that this has hitherto been underestimated and chromosome mosaicism frequently occurs in the absence of indicative clinical features. The growing appreciation among clinicians and demand for SNP genotyping data poses significant challenges for the interpretation of LCSH, especially where there is no detailed phenotypic description to direct laboratory analysis. Finally, reporting of unexpected or hidden consanguinity revealed by SNP array analysis raises potential ethical and legal issues.
- Mosaicism
- chimerism
- SNP array
- B allele frequency (BAF)
- long continuous stretches of homozygosity (LCSH)
- copy-number
- cytogenetics
- diagnostics
- molecular genetics
- microarray
- genetics
- chromosomal
- clinical genetics
Statistics from Altmetric.com
- Mosaicism
- chimerism
- SNP array
- B allele frequency (BAF)
- long continuous stretches of homozygosity (LCSH)
- copy-number
- cytogenetics
- diagnostics
- molecular genetics
- microarray
- genetics
- chromosomal
- clinical genetics
Introduction
Single nucleotide polymorphism (SNP) genotyping arrays have been used widely in the research setting for gene level autozygosity mapping1–3 and for large scale genome-wide association studies.4 5 More recently, several groups have demonstrated the use of SNP arrays for the detection and direct quantification of chromosomal mosaicism and chimerism as well as for assessing long continuous stretches of homozygosity (LCSH) and uniparental disomy.6–10 These studies have exploited two distinct characteristics of SNP genotyping data: the ability to detect homozygosity (specifically LCSH) and B-allele frequency (BAF). The latter of these represents the B-allele proportion of the total allelic composition for a given SNP (for a detailed description see Yau and Holmes11 and Alkan et al12). For a diploid DNA segment (ie, copy number state 2) the BAF is expected to have a trimodal distribution consisting of AA (BAF=0), BB (BAF=1), and AB (BAF=0.5) genotypes. Deviation from the ‘typical’ trimodal BAF state (ie, AA, AB, BB) is indicative of allelic imbalance, which may or may not be associated with a LogR copy number change. This enables detection of not only deletions and duplications but also amplifications (>3 copies), LCSH, mosaicism, chimerism, and ploidy.
Mosaicism for structural and numerical chromosome abnormalities can be identified by conventional cytogenetic analysis. However, low level mosaicism may go undetected by routine karyotyping, unless prompted by clinical suspicion, as the standard analysis of 15 cells provides diagnostic accuracy only for mosaicism ≥20%.13 Typical clinical features of mosaicism such as pigmentary disturbance, asymmetry or contractures generally indicate the need for extended cell counts or karyotypic analysis of other cell types such as fibroblasts. More recently, improved detection of mosaicism has been achieved by molecular karyotyping with array comparative genomic hybridisation (aCGH), which detects mosaicism for whole chromosome and segmental chromosome abnormalities down to 10% and 20%, respectively.14–16
LCSH can arise through a number of mechanisms. Shared parental ancestry, in which an individual inherits chromosomal segments that are autozygous (ie, ‘identical-by-descent’), is one mechanism. If detected in a single chromosome, LCSH may also represent a segment of isodisomy reflecting uniparental disomy (UPD). In cases with several LCSH involving more than one chromosome, the proportion of the genome affected by autozygosity can reveal the origin (ie, recent or ancient) and degree of parental consanguinity.17
Despite the growing implementation of SNP and ‘hybrid’ aCGH/SNP array analysis in the clinical setting, there remains little specific information on the clinical utility of SNP genotyping data for the investigation of intellectual disability, developmental delay, abnormal growth, autism or congenital abnormalities. Here, we formally audit the incidence and spectrum of clinically significant ‘LogR neutral’ genotyping abnormalities detected by molecular karyotyping using SNP array in a consecutive set of 5000 referrals. Furthermore, we investigate the genome wide patterns of LCSH found and highlight the power of using homozygosity mapping in specific cases for identifying pathogenic variants associated with autosomal-recessive disorders.
Methods
Subjects
Molecular karyotyping using SNP array was performed on 5000 consecutive samples referred to the VCGS Pathology Cytogenetics Laboratory, Melbourne, Australia, over an 18 month period. All cases were referred for investigation of one or more of the following; intellectual disability, developmental delay, abnormal growth, autism or congenital abnormalities. As no formalised criteria were applied for patient selection, this cohort showed considerable variation in the severity of phenotypic abnormality and, notably, included patients with subtle phenotypes (eg, behavioural problems or mild mental retardation without additional dysmorphic features). The median patient age was 4.2 years (range 1 day–79 years). Within this cohort, a pathogenic sub-microscopic copy number change (not including mosaic findings) was identified in 12.8% of cases.
DNA isolation
DNA was isolated from peripheral blood, or tissue specimens (skin biopsy, saliva), using the Nucleobond CB Kit (Macherey-Nagel, Düren, Germany) according to the manufacturer's instructions. The NanoDrop ND-1000 UV-VIS spectrophotometer was used to assess both the genomic DNA concentration and purity, according to the manufacturer's protocol. Suitable DNA samples were those with an A260/A280 and A260/A230 ratio of 1.8 to 2.0 and >2.0, respectively.
Molecular karyotyping
Molecular karyotyping was carried out on all 5000 DNA samples using the Illumina HumanCytoSNP-12 array (versions 1.0, 2.0 and 2.1). All procedures for fragmentation, labelling, and hybridisation were performed at the Australian Genome Research Facility (Melbourne, Australia) and were done according to the manufacturer's protocol.
Raw data were uploaded in KaryoStudio software (Illumina) and log2 ratios (LogR) and BAFs were calculated by normalisation to a reference ‘cluster’, which was generated from a set of 150–300 clinical samples processed within a 2 month period of the ‘test’ samples. For each sample, the primary analysis consisted of visual inspection of the individual chromosome LogR and BAF profiles. Automated detection of copy number changes and LCSH was carried out using the cnvPartition algorithm (versions 1.2.1 to 3.1.6) in KaryoStudio software. All identified abnormalities were further characterised by visual inspection of the LogR and BAF chromosomal plots.
Notably, as the cnvPartition algorithm (DNA Copy Number and Loss of Heterozygosity Analysis Algorithms, 2010) does not take into account conflicting BAF and LogR deviations, detection of ‘LogR neutral’ aberrations (ie, mosaicism and chimerism) relied heavily on manual inspection of the BAF and LogR chromosomal profiles for each case. Estimation of the level of mosaicism for each aberration was performed according to the formulae described by Rodriguez-Santiago et al,10 which use the ‘measured’ deviation in the BAF distribution(s) (Bdev).
Quality control
Quality assessment of the array data was performed using the standard deviations of BAF (ie, BAFdev) and LogR (ie, LogRdev) for all autosomal probes. All samples had a BAFdev <0.030 and LogRdev <0.16. The median BAFdev and LogRdev across all samples was 0.022 and 0.11, respectively. Samples found to have a BAFdev >0.03 or LogRdev >0.16 were re-tested, provided that visual inspection of the BAF and LogR profiles showed no gross genotyping or copy number aberration.
Long continuous stretches of homozygosity
A lower threshold of five megabases for calling of LCSH regions was chosen as it represents the upper end of the size distribution of LCSH identified in previously reported healthy demonstrably outbred populations.18 19
Characterisation of genotyping aberrations
Where possible, all ‘LogR neutral’ aberrations indicated by SNP genotyping were further characterised by additional conventional cytogenetic (metaphase G-band analysis) or molecular analysis (fluorescence in situ hybridisation (FISH), microsatellite PCR analysis, methylation studies) to delineate the chromosomal aberration further. These are described in the online supplementary material.
Spiking experiments (mosaicism/chimerism series)
In order to determine the sensitivity of the BAF data for detection of mosaicism and chimerism, SNP array was performed on artificially generated mosaicism and chimerism series. For the mosaicism series, DNA was obtained from a single prenatal case that was shown by conventional karyotyping to be trisomic for chromosome 22 in chorionic villi but disomic for chromosome 22 in amniotic fluid. Before DNA extraction, interphase FISH analysis was performed on 500 cells to confirm non-mosaic diploidy and trisomy 22 in the respective cell lines. The mosaicism series was generated by mixing chorionic villus (ie, trisomy 22) DNA to amniotic fluid DNA (ie, ‘diploid’) at concentration ratios of 2%, 4%, 7%, 12%, and 20%. Both chorionic villus and amniotic fluid DNA had previously been tested by SNP array; neither showed a mosaic genotyping pattern for chromosome 22.
The chimerism series was generated by mixing DNA, which had previously been tested by SNP array and found to be unremarkable, from two unrelated individuals at concentration ratios of 5%, 10%, 20%, 30%, 40%, and 50%. Analysis of the variation (SD) in the BAF data for AA (BAF range 0–0.25) and AB (BAF range 0.38–0.63) genotypes was investigated as a means of objectively detecting mosaicism and chimerism. Calculation of the SD for AA and AB BAF clusters was performed in Microsoft Excel using BAF data obtained from GenomeStudio software (Illumina). The distribution (mean and SD) in BAF measurements for these clusters was determined using data from 100 karyotypically (by SNP array) normal clinical samples.
Results
Clinically significant ‘LogR neutral’ aberrations were detected using the SNP genotyping data in 24 (0.5%) cases (25 aberrations in total). Abnormal BAF patterns were observed for a chromosome segment in 17 cases, the whole of a chromosome in seven cases, and the entire chromosome set in a single case. Crucially, none of the ‘aberrant’ segments showed a detectable deviation in the LogR data (see supplementary figure 1). The aberrations were associated with separation of the typical unimodal heterozygous BAF population in 13 cases, the presence of additional BAF populations in two cases, and extended homozygosity (ie, LCSH) in 11.
Mosaicism
Based on previously published reports of atypical BAF data,6 7 9 10 13 of the BAF aberrations were consistent with chromosomal mosaicism for two or more genetically distinct cell lines. Overall, the calculated percentage of chromosomal mosaicism was in good agreement with the follow-up in situ studies, particularly with the FISH (table 1). Interestingly, five cases (cases 1–5) showed no evidence of an abnormality on analysis of G-banded chromosomes, even with extensive analysis (100 cells). FISH performed on a peripheral blood smear was possible in three of these (cases 1–3), and in each a duplication signal in approximately 20% of cells was found. Notably, no abnormality was seen in phytohaemagglutinin (PHA) stimulated lymphocyte cultures from these peripheral blood samples.
Summary of mosaicism cases
The underlying chromosome abnormality could be delineated in detail for four cases. Metaphase chromosome analysis showed these to represent an isodicentric chromosome 18 (case 6), two small marker chromosomes (cases 7 and 8) involving regions 18q11.1q11.2 and 19p13.2, respectively, and a trisomy of chromosome 9 (case 9). Five of the aberrations involved terminal chromosome regions and included potential segmental isodisomies (cases 11 and 12) involving chromosome regions 16p11.2-pter and 22q11.21-qter, respectively, and one molecularly confirmed segmental isodisomy involving chromosome region 11p15.1-pter (case 10). In cases 11 and 12 there was very strong evidence supporting mosaicism for a segmental isodisomy: the magnitude of the observed Bdev in the presence of a normal LogR profile; and failure to detect a dosage abnormality by FISH in both cultured and uncultured preparations.
Analysis of the phenotypes in the 12 mosaic cases showed no particular pattern of clinical features. Two individuals (cases 3 and 10) had significant limb asymmetry, but otherwise none showed typical clinical manifestations of mosaicism, such as pigmentary disturbance, asymmetry or contractures. Mosaicism was not clinically suspected in any case before array testing. None had a clinical diagnosis of hypomelanosis of Ito.
Chimerism
A single case (case 24) was identified showing an abnormal BAF profile for all autosomes and the X chromosome. This result was obtained on a DNA sample isolated from the peripheral blood of a monochorionic dizygotic twin referred for investigation of growth retardation and feeding difficulties. In utero twin-to-twin transfusion syndrome (TTTS) had been suspected. The autosomal BAF profile for this case was suggestive of chimerism for two genetically related (ie, dizygotic) cell lines, as indicated by the presence of interspersed chromosomal segments showing normal and abnormal BAF profiles (supplementary figure 2). Based on BAF distributions obtained on an artificial chimerism series (see below), the level of chimerism in this sample was estimated at 40%. SNP array analysis of the remaining twin showed a complementary pattern for each of the chromosomes; however, the level of chimerism was significantly lower (approximately 20%). Results obtained from SNP array analysis of ‘twin’ saliva DNA and microsatellite analysis of parental and twin samples were consistent with dizygotic chimerism limited to ‘leukogen’ DNA in this case.
Mosaicism/chimerism series
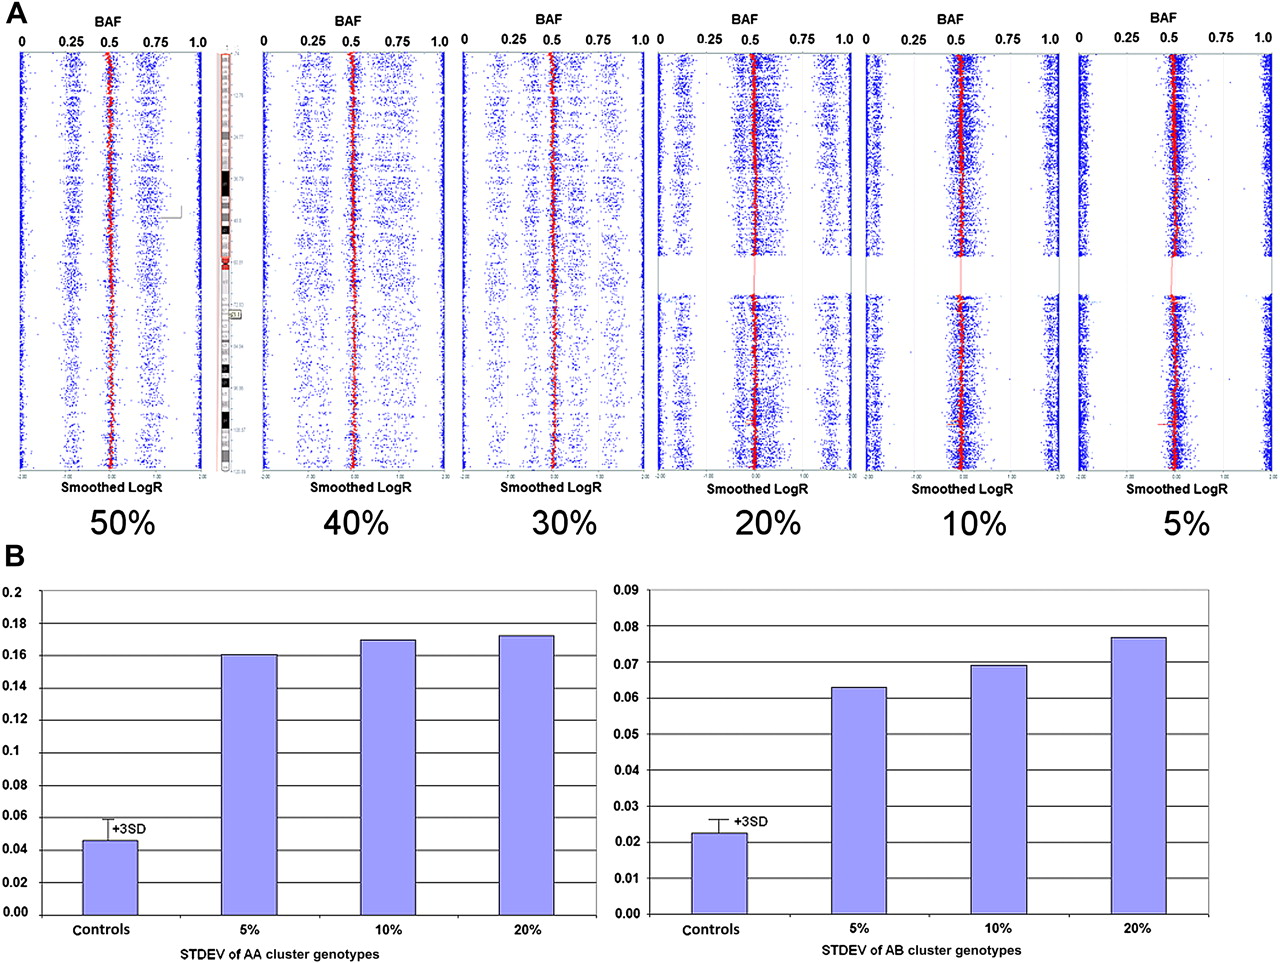
The SNP array profile for each concentration ratio in the respective series is shown in figure 1 (mosaicism) and figure 2 (chimerism). Based on these artificial series, visual (ie, visual inspection of the BAF data) sensitivity for detection of mosaicism and chimerism was 12% and 10%, respectively. Quantitative analysis of the variation (SD) in the BAF data for AA and AB genotypes (figures 1B and 2B) in these samples, and comparison with that obtained on 100 controls, improved the detection sensitivity for chimerism to 5% and that for mosaicism to 7%. For both series, the AA cluster deviation was the more sensitive, with no detectable difference in AB cluster deviation for mosaicism between 12% and 7%.

Artificially generated mosaicism Series. (A) Single nucleotide polymorphism (SNP) array profiles (Illumina KaryoStudio software) for the five artificially generated mosaic trisomy 22 samples. The B-allele frequency (BAF) data (dots) are shown for all five samples. The smoothed LogR data (solid line centred at 0) is shown only for the 20% trisomy 22 sample, which even at this level demonstrates no change. (B) Bar graphs showing the standard deviation (STDEV) for AA (BAF range 0–0.25) genotypes (left box) and AB (BAF range 0.38–0.63) genotypes (right box). For each of the genotype clusters, the distribution of SD measurements obtained for 100 ‘normal’ controls is also shown.

Artificially generated chimerism series. (A) Single nucleotide polymorphism (SNP) array profiles (Illumina KaryoStudio software) for the six artificially generated chimeric samples. The B-allele frequency (BAF) (dots) and smoothed LogR data (solid line centred at 0) is shown for all six samples. (B) Bar graphs showing the standard deviation (STDEV) for AA (BAF range 0–0.25) genotypes (left box) and AB (BAF range 0.38–0.63) genotypes (right box). For each of the genotype clusters, the distribution of SD measurements obtained for 100 ‘normal’ controls is also shown.
Long continuous stretches of homozygosity
Four hundred and ninety-seven samples (10% of cohort) were identified with at least one LCSH >5 Mb in length (figure 3). Of these, 222 (4.4%) cases showed a single LCSH, 55 (1.1%) showed two LCSH, and the remaining 220 (4.4%) showed extensive LCSH involving three or more chromosomal segments.

Incidence and genomic burden of long continuous stretches of homozygosity (LCSH) (>5 Mb in length) detected in 5000 clinical samples. Grey squares indicate LCSH regions representing segments of isodisomy (see table 2). Two individuals showed genomic homozygosity levels >20% (upper right). UPD, uniparental disomy.
Uniparental disomy
Thirty-two cases (0.7%) showed either one extensive (>10 Mb) LCSH or two or more LCSH involving a single chromosome. In these cases the extent of the LCSH and their restriction to a single chromosome raised suspicion of uniparental disomy. Notably, the LCSH regions in seven cases mapped to a chromosome (ie, chromosomes 6, 7, 11p, 14, 15) associated with a known human imprinting disorder (table 2). A further four cases were singled out as the LCSH involved very large chromosomal segments. Parental–offspring microsatellite analysis was possible in five of these 11 cases, and the results were consistent with uniparental inheritance for the respective chromosomes in all five. In the remaining six cases uniparental disomy was strongly indicated by either the presence of extensive LCSH isolated to a single chromosome (cases 13, 14, and 16) or a positive Angelman or Prader–Willi syndrome(s) methylation-specific PCR result (cases 21–23). In four cases (cases 16 and 21–23) the result was concordant with the clinical indication (ie, an imprinting disorder was suspected or part of the differential diagnosis), and in a further three (cases 17, 18, and 20), robust genotype–phenotype correlation could be established.
Uniparental disomy revealed by LCSH
Identity by descent and consanguinity
Extensive LCSH involving two or more segments (range 2–37 Mb) on at least two different chromosomes (range 2–19), which is indicative of identity by descent,1 17 20 was detected in 257 (5.1%) cases. The median number of LCSH detected in these samples was 7, with the segment length increasing proportionally with higher levels of genomic homozygosity. Overall, the median size of LCSH (96 Mb; range 5–214 Mb) in cases with genomic homozygosity levels >1% was significantly different from that of ‘isolated’ LCSH (Z test; p<0.001, α=0.01).
One hundred and sixty cases (3.2% cohort) showed an appreciable level of homozygosity, ranging from 2% to as much as 24% of the genome (figure 3). Consanguinity was indicated by the referring clinician in at least 29 cases; the genomic homozygosity levels (range 3–12%) for these were largely consistent with the degree of parental relationship indicated by the family pedigree. Notably, genomic homozygosity levels >20% were recorded in two individuals.
LCSH mapping in single patients: diagnosis of autosomal recessive disorders
The LCSH data facilitated the identification of a pathogenic, homozygous sequence mutation that confirmed the clinical diagnosis of a specific monogenic disorder in four cases (described in detail in Bruno et al21). The LCSH encompassing the causative sequence mutation(s) ranged in size from 2.2 megabases to 17 megabases. Notably, the genome-wide homozygosity levels for these four cases varied widely (0.2–10%) and in one case only a single LCSH was identified. In the cases showing multiple LCSH there appeared to be no correlation between LCSH length and disease association.
Discussion
By focusing on aberrations that were revealed exclusively by the BAF data in 5000 SNP array tests, we were able to emphasise the clinical utility of SNP genotyping data for investigation of individuals with intellectual disability, developmental delay, abnormal growth, autism or congenital abnormalities. In total, 25 clinically significant aberrations were revealed only by the SNP genotyping data.
Low level mosaicism
While several studies1 6–10 have demonstrated the use of SNP arrays to detect the types of aberrations revealed here, obtaining specific information about their incidence and clinical significance has been challenging. Recently, Conlin et al9 exploited the BAF data to help reveal chromosomal mosaicism, UPD and chimerism with unprecedented sensitivity. They reported an incidence of chromosomal mosaicism and UPD of approximately 1% and 0.4%, respectively, in 2019 patients. Compared with the results described here, which were restricted to LogR-neutral events, the level of mosaicism reported by Conlin et al9 was significantly higher, as would be expected. The spectrum of aberration detected in both studies was similar.
It was of interest that a recent SNP-array study10 reported an appreciable incidence of mosaic segmental uniparental disomy (0.9% cohort; 55% of mosaic aberrations) in 1991 bladder cancer patients and healthy hospital based controls, but we did not find this in our cohort, which was comprised chiefly of young children. Notably, the mean age of individuals tested by Rodriguez-Santiago et al10 was 63.7 years. The apparent prevalence of this type of mosaicism in elderly individuals deserves attention, especially in light of the proposed somatic origin for segmental uniparental disomies.22
The detection rate of low level mosaicism, revealed solely by the BAF data, in this study was 0.2%. It is worth noting that this represents only 13 of 54 mosaic aberrations (24%) detected by SNP array, using both the LogR and BAF data, in this cohort of 5000 clinical samples (data not shown). The figure obtained here for low level mosaicism is not dissimilar to that obtained for all mosaic events detectable by aCGH.15 16 23 Previous aCGH ‘spiking experiments’ have determined with high accuracy the minimal detection of mosaicism to be 10% and 20% for whole chromosome and segmental abnormalities, respectively.14–16 In order to replicate these spiking experiments using SNP arrays to provide meaningful genotype information, we have taken advantage of a rare opportunity to mix chorionic villus and amniotic fluid samples from a single case of complete fetal–placental karyotypic discordance24 for trisomy 22. Detailed characterisation of the fetal and placental samples ensured that sensitivity measurements were accurate and comparable to previously reported aCGH spiking experiments.14 15 Based on analysis of the BAF data in spiked samples, the sensitivity for detection of trisomy was found to be either 7% or 12%, depending on the underlying aetiology. Maximum sensitivity is obtained if the trisomic cell line generates heterozygosity at genomic loci that are homozygous in the normal (euploid) cell line, thus producing a deviation or shift in the homozygous (ie, AA and BB) genotype cluster positions. Otherwise, only a change in the heterozygous (ie, AB) genotype cluster position is observed. The aberrations detected in cases 4 and 8 are examples of the former while that in case 1 exemplifies the latter.
The figure (ie, 7–12%) obtained here represents the lower bound estimate for mosaicism detection sensitivity, as duplications produce the smallest BAF shift. Based on this estimate, the detection sensitivity for deletion and LCSH (uniparental disomy) is inferred to be 8% and 4%, respectively. Furthermore, unlike aCGH,14–16 the sensitivity for detection of low level mosaicism appears to extend to small aberrations, as demonstrated by the detection of a 2.9 Mb tandem duplication (case 2) as well as two small (3.4 Mb and 1 Mb) marker chromosomes (cases 7 and 8).
The characteristic pigmentary disturbance known as hypomelanosis of Ito has been reported in a wide variety of mosaic chromosome abnormalities, including aneuploidy, interstitial and terminal deletions, and even apparently balanced chromosome translocations.25 The mechanism by which a diverse range of mosaic chromosome abnormalities causes the hypomelanosis of Ito phenotype is unknown. All mosaic aberrations detected here were considered clinically significant on the basis of their genomic size, gene content, and mosaicism level. However, only two out of the 12 mosaic individuals showed asymmetry and none showed other typical clinical manifestations of mosaicism, such as pigmentary disturbance or contractures. Moreover, mosaicism was not clinically suspected in any case before testing. Three were mosaic for UPD but had no chromosome imbalance and hence would not have been expected to demonstrate clinical manifestations of mosaicism aside from asymmetric growth. Contractures and pigmentary disturbance in patients with chromosome mosaicism may manifest later in life. The lack of clinical manifestation may be due to the low average age of individuals in this study—six of 13 mosaic patients were <1 year of age.
The detection of mosaicism has previously relied on clinical suspicion to prompt extended karyotype analysis of blood or the need to analyse a different cell type such as fibroblasts. This study demonstrates that chromosome mosaicism is frequently present without typical clinical indicators. Furthermore, these results are consistent with previous findings26 that in populations tested with standard cytogenetics, chromosome mosaicism is likely to be underdiagnosed, particularly when it is present at low levels.
Chimerism
The presence of allelic disturbance affecting the entire chromosomal complement is highly indicative of chimerism. This was evident in a single case (case 24). Here the initial and follow-up investigations suggested that the chimerism originated from twin-to-twin exchange of haematopoietic stem cells during embryonic/fetal development. Virtually all monochorionic twin pregnancies have vascular anastomoses that allow the flow of blood between the fetuses,27 and in about 15% of these cases TTTS develops. This case showed growth restriction and feeding difficulties consistent with the antenatal phenotype associated with TTTS.
The emerging picture from this and similar analyses of chimeric samples7 9 is that the patterns in the BAF data provide a unique signature of both the origin and level of chimerism (shown here to be at least 5%). This information should aid with assessment of clinical significance in individual cases and lead to a better understanding of the spectrum and incidence of spontaneous and non-spontaneous forms of chimerism28 29 in this clinical setting.
LCSH
The prevalence of LCSH in healthy, demonstrably outbred populations has been investigated in several large, high density, genotyping studies. 17–20 It is now widely accepted that regions of extended homozygosity appear to be an under-appreciated characteristic of our genomes, arising predominately by virtue of parental descent from a common ancestor (often referred to as ‘identity by descent’). Empirical data also show that the size distribution and frequency of LCSH differs greatly between different ethnic populations, owing to a wide range of demographic histories and diverse cultural attitudes to consanguinity17.
The clinically significant consequences associated with LCSH are homozygosity for a ‘recessive type’ genetic aberration (sequence change or copy number variant) and dysregulation of genomic imprinting—the latter being of relevance only when the detected LCSH represents a segment of uniparental isodisomy. Determining pathogenicity for any given LCSH depends in part on availability of adequate clinical information to direct laboratory analysis and on subsequent molecular studies to identify the genetic defect.
LCSH longer than 5 Mb are ubiquitous and frequent in individuals referred for investigation of intellectual disability, developmental delay, abnormal growth, autism or congenital abnormalities, as is the case in apparently healthy individuals. 17–20 Three distinct classes can be distinguished on the basis of the length and number of LCSH.17 The first shows multiple large LCSH, resulting from recent inbreeding (4.4% of cohort). The second shows two LCSH involving one or two chromosomes (1.1% of cohort). The majority of these represent ‘identity by descent’ arising from distant shared ancestry and may be more commonly seen in individuals from isolated communities. The third shows a single LCSH (4.4% of cohort). These do not arise from inbreeding in recent generations and are observed at similar frequencies in demonstrably outbred populations.18 19
A significant number of individuals (2.4%) were identified with LCSH involving multiple chromosomes and genomic homozygosity (or autozygosity) levels >4%—a finding most consistent with the individual being conceived by first cousin relatives. The clinical evidence that progeny from consanguineous marriages, and especially first-cousin unions, may have reduced health and fitness because of homozygosity of recessive alleles is well known.30 Hence, it would seem prudent to check for regions which may harbour candidate recessive genes that would be consistent with the clinical picture. In the present series, LCSH mapping led to the identification of a pathogenic, homozygous sequence mutation (described in detail in Bruno et al21) in four cases, representing a diagnostic yield of 0.8% (four out of 497 cases identified with one or more LCSH). Historically, LCSH (or autozygosity) mapping has been used to uncover pathogenic homozygous mutations in large consanguineous families and almost always requires testing of combinations of affected and unaffected individuals.1 31 The four successful diagnoses in this series clearly demonstrate the value of SNP genotyping analysis for diagnosis of recessive disorders in single individuals with single or a few autozygous regions.
Incidental detection of parental relatedness where this may not be known to the parents and clinician needs careful consideration. As indicated here (figure 3) and elsewhere,32 SNP genotyping analysis may also suggest incestuous parental relationships. Importantly, it does not provide definitive proof. In light of the legal, ethical, and medical issues associated with reporting of such results, appropriate consultation between laboratory and clinician is imperative. We have developed an institutional policy whereby results demonstrating high levels of autozygosity are discussed directly with the referring clinician before issue of the formal result, with the aim of ensuring that this information is dealt with sensitively, confidentially, and with a clear understanding of the possible interpretation of the result by non-geneticists. We recommend that patients and parents should be informed of the possibility of uncovering hidden parental relatedness before consent for SNP based molecular karyotyping.
Uniparental disomy involving a chromosome associated with an imprinting disorder was detected in seven samples (cases 16–18 and 20–23); robust genotype–phenotype correlation could be established for all. The significance of the uniparental disomies detected in cases 13, 14, 15, and 19, which involve a ‘non-imprinted’ chromosome, is more difficult to associate with clinical features. Clinically relevant consequences for these UPDs include possible homozygosity for autosomal recessively inherited mutations or undiagnosed mosaicism for an aneuploidy.
It would seem prudent to investigate the possibility of uniparental disomy in cases with single or multiple LCSH isolated to a single chromosome. However, given workflow requirements and limited human and financial resources, this may more suitably be restricted to chromosomes known to be associated with an imprinting disorder. Finally, as some UPDs may go undetected by SNP arrays, due to lack of any isodisomy, analysis of parental samples will remain necessary in cases where an imprinting disorder is clinically suspected.
This represents the first study to assess the clinical utility of SNP genotyping data for the investigation of individuals with intellectual disability, developmental delay, abnormal growth, autism or congenital abnormalities. We have shown that the use of SNP genotyping data, and specifically BAF, adds a further 0.5% to the detection rate of clinically significant aberrations in this patient group. If the four LCSH associated with monogenic autosomal recessive disorders are included, this increases to about 0.56%, a not insignificant improvement in diagnostic yield. The knowledge obtained here regarding the sensitivity of the BAF data for mosaicism and chimerism detection shows that SNP array is superior to aCGH and conventional G-band analysis in the detection of unsuspected mosaicism in children with intellectual disability/developmental delay, and should further encourage use of SNP arrays in the diagnostic setting.
References
Supplementary materials
Supplementary Data
This web only file has been produced by the BMJ Publishing Group from an electronic file supplied by the author(s) and has not been edited for content.
Files in this Data Supplement:
- Download Supplementary Data (PDF) - Manuscript file of format pdf
- Download Supplementary Data (PDF) - Manuscript file of format pdf
Footnotes
Funding This work was supported by the Victorian Government's Operational Infrastructure Support Program.
Competing interests None.
Ethics approval The data reported herein are derived from routine diagnostic tests, which carry implicit patient consent and thus no ethics approval at our institution is required.
Provenance and peer review Not commissioned; externally peer reviewed.