Article Text

Abstract
Developmental dyslexia is a neurofunctional disorder characterised by an unexpected difficulty in learning to read and write despite adequate intelligence, motivation, and education. Previous studies have suggested mostly quantitative susceptibility loci for dyslexia on chromosomes 1, 2, 6, and 15, but no genes have been identified yet. We studied a large pedigree, ascertained from 140 families considered, segregating pronounced dyslexia in an autosomal dominant fashion. Affected status and the subtype of dyslexia were determined by neuropsychological tests. A genome scan with 320 markers showed a novel dominant locus linked to dyslexia in the pericentromeric region of chromosome 3 with a multipoint lod score of 3.84. Nineteen out of 21 affected pedigree members shared this region identical by descent (corrected p<0.001). Previously implicated genomic regions showed no evidence for linkage. Sequencing of two positional candidate genes, 5HT1F andDRD3, did not support their role in dyslexia. The new locus on chromosome 3 is associated with deficits in all three essential components involved in the reading process, namely phonological awareness, rapid naming, and verbal short term memory.
- reading disability
- linkage analysis
- chromosome 3
Statistics from Altmetric.com
Dyslexia is a developmental language disorder that manifests as a specific reading disability, involving a deficit in phonological processing.1 It is a permanent, sometimes disabling condition, although some adults do fully compensate for their childhood reading problems. Several studies have reported compensation rates of approximately 20%, with slightly more females compensating than males.2 Dyslexia is a common problem, affecting a large proportion of the population. The prevalence in most countries is in the range of 5-10%; in Finland it is 6%.3 Neuroimaging and neurofunctional studies have indicated neural differences between dyslexic and non-impaired subjects.4-7 In a recent study with functional magnetic resonance imaging, brain activation patterns differed significantly between the groups of dyslexic and non-dyslexic readers, showing relative underactivation in posterior brain regions (Wernicke's area, the angular gyrus, and striate cortex) and relative overactivation in an anterior region (inferior frontal gyrus, Broca's area).6 Genetic factors have been implicated in the aetiology of dyslexia since the beginning of the last century8-13 and previous studies have suggested at least four genetic susceptibility loci for dyslexia on chromosomes 1, 2, 6, and 15.14-20 Translocations cosegregating with dyslexia have been reported in chromosomes 121 and 15.22 Even though the inheritance pattern in a few of the families is consistent with an autosomal dominant trait, the results from linkage studies are inconsistent. Susceptibility loci identified in some of the studies have not been replicated in later studies. These observations are consistent with a complex genetic background, and to date no genes responsible for dyslexia have been identified. We identified a pedigree, segregating autosomal dominant dyslexia, which was large enough to allow the mapping of the gene predisposing to dyslexia. By conducting a genome wide scan in this pedigree, we identified a novel locus cosegregating with dyslexia.
Methods
ASCERTAINMENT OF FAMILIES
A total of 140 families attending the Department of Paediatric Neurology at the Hospital for Children and Adolescents (former Children's Castle Hospital), University of Helsinki, were evaluated. The study was approved by the ethical committee of the Children's Castle Hospital, University of Helsinki, Finland. The subjects' consent was obtained according to the Declaration of Helsinki. All probands had previously been tested by a child neurologist and child neuropsychologist, and the parents of the probands filled out a questionnaire including questions about their childhood, school history, and attendance at remedial education, as well as about difficulties in learning to read and write among close relatives.
During the characterisation process, a multiplex four generation kindred AB (fig 1) with profound reading difficulties was identified. In this family, dyslexia segregated in a seemingly autosomal dominant pattern with both sexes equally affected. This was the largest pedigree identified. Since the pedigree was large enough to allow mapping of a gene, only this pedigree was selected for further mapping studies. Initially, we ascertained 29 members of this family, of whom 14 were affected and 15 were unaffected (family A). At a later stage, additional family members who were not available at the beginning of the study were ascertained (family B). The total number of subjects identified in pedigree AB was 74 (43 males and 31 females), aged 6-66 years. Three subjects had died. All dyslexic and normal subjects were native Finnish speakers. Participants from the nuclear families were interviewed by a paediatric neurologist (JNH) and they were sent a questionnaire regarding their reading difficulties, school history, and attendance at remedial education. Subjects with sensory or neurological abnormalities or performance intelligence quotient (IQ) less than 86 were excluded from the study. The karyotype of one dyslexic family member (II.12) was studied and found to be normal.

Pedigree of the extended family AB. The genome wide scan was performed with family A (right of the dotted line) and linkage to chromosome 3 was confirmed by adding more family members (family B, left of the dotted line) to form the extended family AB. Black symbols denote dyslexic subjects; the phenotype of III.18 is uncertain (marked ?). Subjects marked with dots were included in the linkage analysis.
PSYCHOLOGICAL TESTING
The diagnosis of dyslexia was verified by psychological tests. Altogether, 34 subjects from the extended pedigree AB were tested. All tests were carried out by the same neuropsychologist (BM) who was blind to the results of the ongoing genotyping work. The psychological test battery took on average three hours per person to complete. The tests included an intelligence test23 24 and a Finnish reading and writing test for adults25 and for children according to their school grade,26 and a neuropsychological test battery.27 28 The adult reading test included oral text reading (218 and 128 words, accuracy and speed), pseudo- and non-word reading (30 pseudo-words and 30 non-words, accuracy), and writing (10 words and 10 pseudo-words, accuracy of writing). Pseudo-words are meaningless letter strings and non-words are experimentally designed letter strings that are still orthographically acceptable. Reading samples were recorded on an audio tape and analysed for speed and accuracy. The diagnostic level of the adult reading and writing test was validated against a normative sample of 100 adults (50 females, 50 males, age range between 20 and 40, mean age 29) representing four different educational levels.25 To exclude subjects with low general achievement level, the intelligence quotient according to WISC-R or WAIS-R intelligence tests should exceed 85.
On the basis of the reading and writing tests, the subjects were divided into four groups: (1) no dyslexia, (2) compensated dyslexia, (3) mild dyslexia, and (4) severe dyslexia. In groups 3 and 4 there was a positive history of reading problems, and the reading time deviated by at least 1.0 SD as compared to the mean of normal readers. In addition, in severe dyslexia, mistakes in either reading or writing from dictation or in pseudo- and non-word reading deviated at least 1.0 SD and in mild dyslexia 0.7-1.0 SD compared to the normal readers. Dyslexia was regarded as compensated when there was a positive history of reading problems and either reading time or mistakes in reading or writing from dictation or in pseudo- and non-word reading deviated 1 SD or more compared to the normal readers. For linkage analysis, group 1 was classified as unaffected and groups 2-4 as affected.
According the psychological tests, 24 pedigree members were affected with dyslexia. The affected sibs IV.2 and IV.4, as well as their father III.4, who had been diagnosed as dyslexic elsewhere, were excluded from the linkage study because of bilineal inheritance. Subject III.22 refused neuropsychological testing, but consented to participate in the linkage study and was classified as dyslexic based on a history of severe dyslexia. III.24 was tested but refused to give a blood sample. III.18 had a discrepancy in the phenotype; in the tests she performed as dyslexic, but she had never subjectively experienced any reading or writing problems. Therefore her affected status was classified as unknown. Thus, 21 subjects affected with dyslexia were genotyped and included in the linkage study. IV.8 was later diagnosed as dyslexic but was not available for genotyping.
To refine the cognitive phenotype of each participant further, a battery of neuropsychological tests was carried out, including phonological processing, phonological retrieval (rapid naming), short term memory, and reading comprehension tasks.27 28 The control group for adult neuropsychological testing consisted of 15 non-dyslexic Finnish subjects, four of them unaffected members of family A, and 11 unrelated subjects matched for age, economic status, and educational background. The phenotype segregating in the pedigree consists of deficits in rapid naming, phonological awareness, and verbal short term memory. To analyse group differences for phonological retrieval skill, phonological awareness, and memory span, one way ANOVAs were performed (only subjects over 12 years of age were included in this part of the study, n=18) (table 1). The groups with mild and compensated dyslexia were combined for statistical analysis. Polynomic contrasts and Tukey's post hoc t tests were applied for follow up analysis. According to the Tukey's post hoct tests and polynomic contrast, there was a highly significant difference (p<0.001) between the non-dyslexic and severely dyslexic groups in all three variances tested. There was a significant difference (p<0.01) between the mildly dyslexic and severely dyslexic groups and a suggestive difference (p<0.05) between the normal readers and mildly dyslexic groups in phonological processing skills. For all affected subjects, the non-verbal skills were within the normal range (mean performance intelligence quotient 99, range 86 to 115), as expected for subjects with normal intellectual capacity. The mean age of the subjects in the control group was 35.8 years, in the mild and compensated dyslexia group 27.3 years, and in the severe dyslexia group 44.8 years. The phenotype will be described elsewhere in more detail (JNH, BM, unpublished data).
Neuropsychological test results in three different groups of subjects over 12 years of age using the analyses of variance (ANOVAs) test
GENOTYPING
Twenty ml of EDTA blood was collected from each person and DNA was extracted from the blood samples by a standard non-enzymatic method. PCR was carried out in 15 μl reactions containing 50 ng of genomic DNA and fluorescently labelled primers. The amplified PCR products were separated using 4.25% polyacrylamide gels run on a ABI 377 sequencer (PE Biosystems, Foster City, CA). Lane tracking and allele calling were carried out using the Genescan and Genotyper software (PE Biosystems). All gels were double scored by two investigators and any discrepancies between the two scorings were re-evaluated and resolved. The genome was screened using a set of 320 highly informative microsatellite markers (derived from Weber set 6, http://www.chlc.org). The average intermarker distance was 11.8 cM. For fine mapping purposes, additional markers on chromosome 3 were genotyped manually using silver staining. All microsatellite markers and the genetic distances used in the study are shown at http://www.genome.helsinki.fi.
LINKAGE ANALYSIS
Genome wide genotyping data was obtained for family A. As the exact mode of inheritance of dyslexia is unknown, we analysed the genome scan data by non-parametric multipoint linkage analysis using Genehunter.29 The software performs reconstruction of haplotypes and complete multipoint analysis of allele sharing identical by descent (IBD) among all affected family members at each location in the genome. Since large pedigrees, owing to limitations of the software, cannot be analysed by Genehunter, only the affected family members were included in the primary genome scan analysis. Also, all genotyping data obtained for family B of the extended pedigree AB was primarily analysed by non-parametric linkage using Genehunter but, owing to software constraints, the extended pedigree AB had to be split into two halves (part A and part B) before analysis.
In addition to non-parametric analysis, we performed parametric linkage analysis in the pericentromeric region of chromosome 3, which based on the non-parametric analysis was linked to dyslexia in the extended pedigree AB. The subjects included in the analysis are indicated with dots in fig 1. Two point linkage analysis was performed using MLINK.30 We used a genetic model with the disease allele frequency of 0.0001, autosomal dominant inheritance, and equal female and male recombination rates. The penetrances for homozygous normal, heterozygous, and homozygous affected were 0.06, 0.80, and 1.00, respectively. Parametric five point linkage analysis was performed with the same disease model, using LINKMAP.30
CANDIDATE GENES
The 5-hydroxytryptamine receptor 1F gene (5HT1F) is located within the linked region.31 The entire coding region of5HT1F was sequenced from two subjects sharing the common haplotype (II.12 and III.12) and two subjects not sharing it (II.2 and III.1) using direct sequencing of PCR products with an ABI377 automated sequencer (PE Biosystems, Foster City, CA, USA).
The physical location of another nearby candidate gene, the dopamine D3 receptor gene (DRD3), was determined by radiation hybrid mapping using the Genebridge 4 panel (Research Genetics, Huntsville, AL, USA). A fragment ofDRD3 was amplified by PCR32 and its location was compared to the markers D3S2406, D3S2459, D3S3045, and D3S2465. Data were analysed as described inhttp://carbon.wi.mit.edu:8000/cgi-bin/contig/rhmapper.pl/.
Results
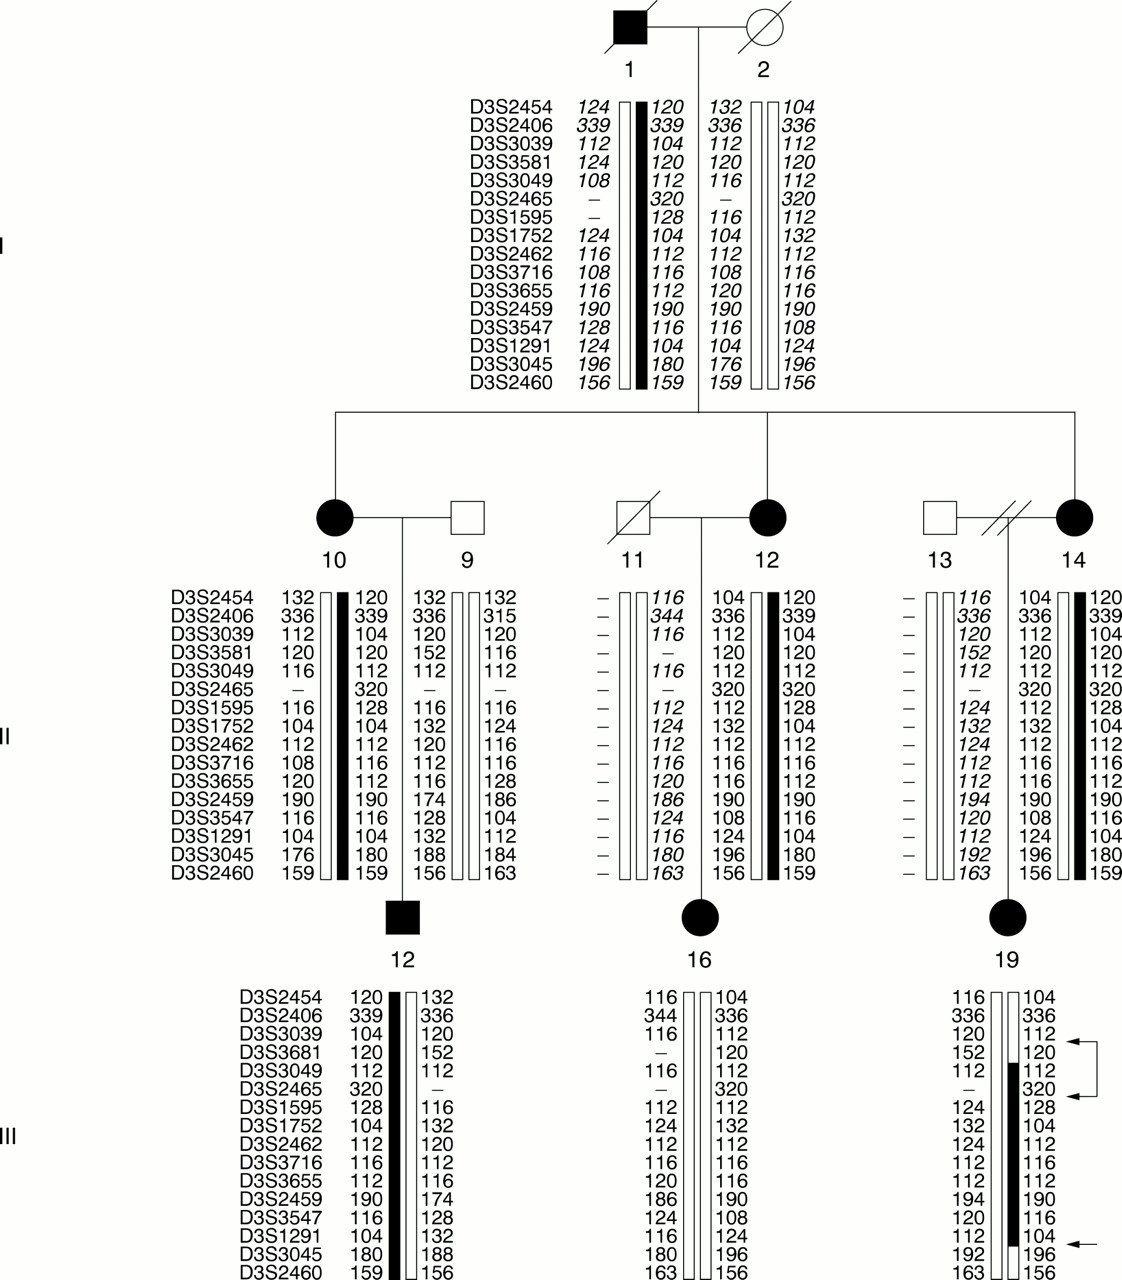
In the first part of the genetic study, family A was genotyped with 320 polymorphic markers spanning the whole genome to assess excess allele sharing among affected pedigree members. Owing to the constraints of the software, only affected pedigree members were included in the analysis. None of the previously implemented candidate loci on chromosomes 1, 6, 15, and 2 showed evidence for linkage. However, the result for chromosome 3 was consistent with a locus near the centromere (3p12-q13) cosegregating with dyslexia (non-parametric Zall 5.8, p=0.0017). This was the only chromosomal region where all affected pedigree members shared a chromosomal region identical by descent (IBD). At this point, members of family B consented to the study. Altogether 35 subjects from the extended pedigree were included in further genotyping. Seven microsatellite markers included in the genome scan (spanning a region of 60 cM of the linked region on chromosome 3) were genotyped in family B. In addition, a set of 11 microsatellite markers on chromosome 3 were genotyped in the extended pedigree AB, resulting in an average intermarker distance of about 2 cM in the centre of the linked haplotype. The haplotype analysis showed that 19 out of 21 dyslexic subjects shared identical copies of chromosome 3. Two subjects with a similar phenotype, II.1 and III.16, did not share any part of the haplotype. Recombinations observed in subject III.19 limited the haplotype to a maximum region of 20 cM (between markers D3S3039 and D3S3045). A representation of the haplotype is shown in fig 2. Non-parametric linkage analysis of families A and B yielded a combined p value of 6 × 10⁻⁵.

A partial pedigree showing the inheritance of a 16 marker long haplotype (41 cM) in the pericentromeric region of chromosome 3. The susceptibility haplotype cosegregating with dyslexia is shown by a black bar, all other haplotypes are shown by open bars. Inferred genotypes are shown in italics. Recombinations are indicated with arrows. Identical copies of the entire 16 marker haplotype or part of the haplotype is present in 19 affected subjects in the extended pedigree AB. Two affected subjects (II.1 (not shown) and III.16) had not inherited any part of the haplotype. A double recombination in III.19 limits the linked chromosomal region to a maximum of about 20 cM. In IV.12 a recombination between markers D3S3045 and D3S2460 was observed (not shown).
To establish the significance of the observed result on chromosome 3, we simulated the occurrence of 19 out of 21 pedigree members randomly sharing a chromosomal segment in the extended pedigree AB. The inheritance of a 60 cM chromosome region in the pedigree was simulated one million times using Haldane's interference free model for recombination. In the one million iterations performed, not even once did 19 or more of 21 affected subjects share a region of 16 cM or more. The empirical p value related to the observed sharing is thus very small and the true value safely <10-5. Using the Bonferroni correction to account for multiple testing across the genome, we get an upper boundary for the corrected p value of 1-(1-ps )55 =0.00055, which allows us to draw the conclusion that the observed degree of sharing, or more extreme sharing, occurs by chance with a frequency of less than 1/1000 in a full genome scan.
In order to analyse the complete extended pedigree AB, we also performed parametric linkage analysis, which allows the analysis of larger pedigrees than Genehunter. The results of two point parametric linkage analysis are shown in table 2. To compensate for limitations in marker information content, five point linkage analysis was performed using the most informative markers D3S2454, D3S3039, D3S1595, and D3S3655. Parametric multipoint linkage analysis resulted in a maximum lod score of 3.84 (fig 3).
Results of two point linkage analysis
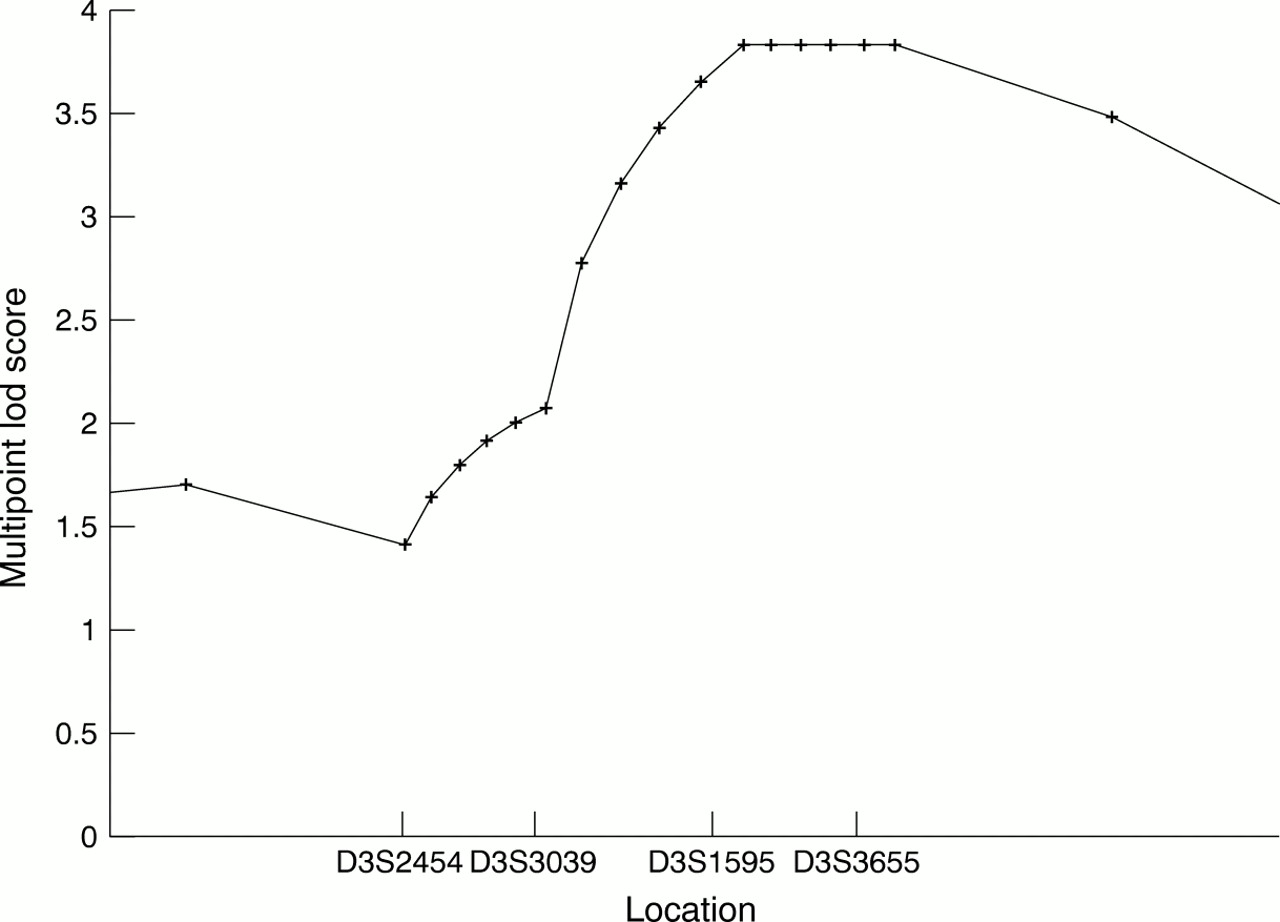
Five point linkage analysis to position the dyslexia susceptibility locus. The most informative markers, D3S2454, D3S3039, D3S1595, and D3S3655, and the dyslexia locus were analysed using the LINKMAP program. The highest lod score, 3.84, was obtained for the interval D3S1595 to D3S3655.
To confirm that the linked region on chromosome 3 was the only region across the whole genome in which all but two affected subjects shared a haplotype IBD, additional genotyping of six chromosomes was performed in family B and the degree of allele sharing in the complete pedigree AB was evaluated with Genehunter. Regions where all but two affected pedigree members shared a haplotype IBD in family A were selected for this analysis. The degree of allele sharing was determined using Genehunter. One region where 16 of 21 pedigree members (12q24.3) shared a haplotype IBD, and two regions where 15 of 21 pedigree members (10p12.3-q11.2 and 15q26.3) shared a haplotype IBD, were identified. In other regions the degree of allele sharing was even less.
We identified two candidate genes, 5HT1F andDRD3, which according to public maps are located within or near the linked region on chromosome 3. Sequencing of the entire coding region of 5HT1F did not show any differences between two subjects sharing the haplotype IBD and two subjects not sharing (data not shown). Radiation hybrid mapping placed DRD3 telomeric of marker D3S3045, thus excluding it from the linked region.
Discussion
The functional features of dyslexia have been subject to intensive research, but data on biochemical events associated with dyslexia are much fewer. Formal genetic linkage studies in carefully selected pedigrees and subsequent positional identification of gene variants provide a route to understanding such functional biochemistry. Genetic studies, however, are hampered by difficulties in phenotyping family members unequivocally for dyslexia, and careful clinical assessment is a prerequisite for genetic studies. We assessed 140 families from a single clinical unit with the aim of identifying families that could provide genetic clues to the causes of dyslexia. One large family, segregating dyslexia in an autosomal dominant fashion, was identified and its members consented to participate in a genetic linkage study. The results implicate a previously unreported chromosomal region linked to dyslexia in chromosome 3. In this pedigree, the gene defect is associated with a specific phenotype with deficits in three essential areas of language abilities, phonological awareness, naming speed, and verbal short term memory. The phenotype seems to be quite similar in all affected subjects, even though the deficit seems to be more profound in older people, perhaps reflecting improvements in the educational system and rehabilitation over the past decades. However, the complexity of the phenotype is underlined by the finding that two pedigree members did not inherit the linked haplotype. In spite of extensive psychological testing, we did not find their phenotype different from the other affected family members. Since dyslexia is a common disorder, the most likely explanation for this finding is that they represent phenocopies.
The genetic mapping results were analysed using different linkage analysis methods, all providing statistically significant evidence for the localisation of a single gene effect. Non-parametric linkage analysis yielded a p value of 6 × 10⁻⁵ in favour of linkage. A randomisation test to study the sharing of a chromosomal segment indicated that not once in a million iterations was such sharing caused by chance as observed in our family. Correction for genome wide significance gave a conservative upper boundary of 0.00055 for the p value. Five point parametric linkage analysis using a dominant model yielded a maximum lod score of 3.84. Finally, we specifically assessed linkage results for the previously linked loci and sharing of haplotypes for the next best regions of the genome. Taken together, these results constitute strong evidence that susceptibility to dyslexia in this family segregates with the chromosome 3 locus.
The centromeric region of chromosome 3 contains an interesting candidate gene, the 5-hydroxytryptamine receptor 1F (5HT1F). It is expressed at low levels in the brain, with greatest expression in the cortex, hippocampus, and striatum.33 Extensive evidence suggests that 5-hydroxytryptamine receptors have a role in learning and memory.34 We sequenced the entire coding part of5HT1F, but found no sequence variation in two dyslexic subjects sharing the susceptibility haplotype. Even though we have no evidence to suggest a direct role for5HT1F in dyslexia, we cannot exclude it only based on lack of sequence variation.
Another promising candidate gene near the linked region was the dopamine D3 receptor gene (DRD3).35 This gene has previously been suggested to have a role in schizophrenia.32 Our mapping results, however, placed this gene outside the linked region, thus formally excluding it as a candidate gene. It is quite likely that the chromosome 3 gene causing susceptibility to dyslexia is as yet functionally uncharacterised and remains to be identified by a combination of positional candidate and functional prediction approaches. At present, chromosome 3 remains one of the still sparsely covered targets in the public genome sequencing efforts (http://www.ncbi.nlm.nih.gov/genome/guide).
In a heterogeneous and complex disorder like dyslexia, the value of carefully assessed phenotypes cannot be overemphasised. In our study, all subjects were thoroughly tested for intelligence, overall reading and writing abilities, and underlying neuropsychological functions. As different subtypes of dyslexia may segregate with different loci, it is clearly advantageous that subjects included in linkage studies have an identical subtype of reading impairment. Single large families are more likely to represent monogenic effects and can thus provide a handle to the identification of one biochemical pathway involved in reading.
Acknowledgments
Electronic Database Information: Marshfield Medical Research Foundation, Center for Medical Genetics,http://www.marshmed.org/genetics (for integrated maps). Online Mendelian Inheritance in Man (OMIM),http://www.ncbi.nlm.nih.gov/Omim(for candidate genes). NCBI database, http://www.ncbi.nlm.nih.gov/. Markers used in this study and intermarker distances,http://www.genome.helsinki.fi.
We thank all the family members included in this study whose continued cooperation has made this research possible. We thank Dr Ralf Krahe for his enthusiastic participation in the early phase of this study, Ms Riitta Lehtinen for skilled laboratory work, Dr Paula Kristo for supervising the Haartman Institute sequencing facility, Ms Sinikka Lindh for help with patient contact, Psych lic Seija Leinonen for help with reading assessment, and Mr Samu Karanko and Mr Pertti Keskivaara for help with computing and statistics. This research was funded by the Arvo and Lea Ylppö Foundation, Helsingin Sanomat Centenary Foundation, Sigrid Juselius Foundation, and Academy of Finland.
