Article Text

Abstract
Several studies have shown that array based comparative genomic hybridisation (CGH) is a powerful tool for the detection of copy number changes in the genome of individuals with a congenital disorder. In this study, 40 patients with non-specific X linked mental retardation were analysed with full coverage, X chromosomal, bacterial artificial chromosome arrays. Copy number changes were validated by multiplex ligation dependent probe amplification as a fast method to detect duplications and deletions in patient and control DNA. This approach has the capacity to detect copy number changes as small as 100 kb. We identified three causative duplications: one family with a 7 Mb duplication in Xp22.2 and two families with a 500 kb duplication in Xq28 encompassing the MECP2 gene. In addition, we detected four regions with copy number changes that were frequently identified in our group of patients and therefore most likely represent genomic polymorphisms. These results confirm the power of array CGH as a diagnostic tool, but also emphasise the necessity to perform proper validation experiments by an independent technique.
- BAC, bacterial artificial chromosome
- CGH, comparative genomic hybridisation
- CNP, copy number polymorphism
- FISH, fluorescent in situ hybridisation
- FSIQ, full scale intelligence quotient
- MLPA, multiplex ligated probe amplification
- MR, mental retardation
- MRX, non-syndromic X linked mental retardation
- MRXS, syndromic X linked mental retardation
- STS, sequence tagged site
- T/R, test over reference
- XLMR, X linked mental retardation
- Array CGH
- XLMR
- duplications
- copy number polymorphisms (CNPs)
- MLPA
Statistics from Altmetric.com
- BAC, bacterial artificial chromosome
- CGH, comparative genomic hybridisation
- CNP, copy number polymorphism
- FISH, fluorescent in situ hybridisation
- FSIQ, full scale intelligence quotient
- MLPA, multiplex ligated probe amplification
- MR, mental retardation
- MRX, non-syndromic X linked mental retardation
- MRXS, syndromic X linked mental retardation
- STS, sequence tagged site
- T/R, test over reference
- XLMR, X linked mental retardation
Mental retardation (MR) has a prevalence of 2–3% in the general population, and is marked by reduced intellectual capacities (IQ <70) and problems with adaptive functioning.1 MR can be caused by a genetic defect or by environmental insults. There is 30% male excess in MR, which is traditionally explained by the high incidence of X chromosomal mutations. Previously, X linked mental retardation (XLMR) was thought to account for about 23% of inherited MR,2,3 but recent estimates based on mutation frequencies in known XLMR genes have reduced this figure to 10–15%.4,5 XLMR is divided into syndromic (MRXS) and non-syndromic (MRX) forms, although boundaries between the two are often vague. MRX is extremely heterogeneous and presently 21 MRX genes have been uncovered.5 Together these explain only a minority of the MRX in all families, suggesting that up to 100 genes on the X chromosome may underlie MRX. Positional cloning has proven to be an effective strategy in the elucidation of novel MRX genes. This strategy includes the analysis of fragile sites and the analysis of cytogenetic aberrations such as inversions, deletions, duplications, and translocations. Of the known 21 genes, approximately one third has been identified by mapping of chromosomal aberrations.5
Array based comparative genomic hybridisation (array CGH) is a new powerful technique to detect submicroscopic chromosomal aberrations too subtle for traditional cytogenetic techniques. Submicroscopic aberrations such as single gene deletions may be causative for non-syndromic XLMR in a number of cases. We have recently published the development and validation of a full coverage X chromosomal bacterial artificial chromosome (BAC) array.6 The availability of such tiling path clone sets allows an approximate resolution of 100 kb. Array CGH has been successfully applied for the identification of causative chromosomal aberrations in a number of human disorders,7 and has been instrumental in resolving the genetic basis of CHARGE syndrome.8 In addition, genome wide array CGH studies have identified a large number of chromosomal copy number changes that are not directly associated with genetic disease and therefore are considered to be polymorphisms.9,10 The current study describes the analysis of a set of 40 selected MRX patients screened with a full coverage array for deletions and duplications on the X chromosome. In one family, a large duplication was shown to be causative for the MR and in two families, MECP2 duplications were identified. In addition, several novel copy number polymorphisms (CNPs) were detected in patients and healthy controls.
METHODS
Subjects
In total, 40 families with non-syndromic mental retardation and linkage to the X chromosome were selected from the European XLMR consortium panel (table 1; http://www.euromrx.com/). Previously, for each family the index patient was karyotyped and mutations in the FMR1 gene were excluded. Genomic DNA from the index patients was isolated from lymphoblastoid cell lines according to standard procedures, and was purified using a commercial kit (QIAamp; Qiagen, Valencia, CA, USA) according to the manufacturer’s instructions. Control samples consisted of 30 healthy white male samples.
XLMR families used for array CGH
Array preparation, labelling, and hybridisation
The genomic X chromosomal BAC array slides were prepared and validated as described before.6 The microarray contained 1460 BAC clones mapped to the X chromosome as well as 350 human chromosome 22 clones for normalisation procedures. This set encompasses a total of 313 Mb of chromosome X sequences, thereby covering the chromosome more than twice (the X chromosome is 154.8 Mb in size). Knowledge of the X chromosomal linkage intervals of the families in this study allowed us to hybridise patient versus patient in such a way that the linked regions did not have any overlap. Labelling and hybridisation were performed essentially as described previously.11 In brief, genomic DNA was labelled by random priming with Cy3-dUTP or Cy5-dUTP (Amersham Biosciences). Two test samples were mixed with 120 µg Cot-1 DNA (Roche), co-precipitated and resuspended in 120 µl of hybridisation solution containing 50% formamide, 10% dextran sulphate, 2×SSC buffer, 4% sodium dodecyl sulphate and 10 µg/µl yeast tRNA (Invitrogen). After denaturation of probe and target DNA, hybridisation and post-hybridisation washing procedures were performed using a GeneTac Hybridisation Station (Genomic Solutions) according to the manufacturer’s recommendations. Hybridisation for 18 hours with active circulation of the probe was performed, followed by five post-hybridisation wash cycles in 50% formamide/2×SSC at 45°C, and five wash cycles in phosphate buffered saline at 20°C. Slides were dried by centrifugation after a brief wash in water.
Image analysis and processing
Slides were scanned and imaged on an Affymetrix 428 scanner using the Affymetrix 428 scanner software package (version 1.0). The acquired microarray images were analysed using Genepix Pro (version 4.0; Axon Instruments) as described previously.11 For each spot, we calculated per dye the median of the pixel intensities minus the median local background. Data normalisation was performed in the software package SAS (version 8.0; SAS Institute) per array subgrid by applying Lowess curve fitting with a smoothing factor of 0.1 to predict the log2 transformed test over reference (T/R) value on basis of the average logarithmic fluorescent intensities.12 Thresholds for copy number gain and loss were determined by previously published work and were set at log2 T/R values of 0.3 and −0.3, respectively. 6 Clones giving rise to signals with a standard deviation >0.3 were excluded from individual experiments, as well as clones with <2 replicates remaining after this analysis.
Validation experiments
In order to verify the deletions detected by array CGH in DNA from family MRX21, PCR analysis of the following sequence tagged site (STS) markers was performed: DXS7121 and DXS7122 for the Xq13 region and DXS8377, DXS7423, DXS1345, DXS903, and DXS1278 for the Xq28 region. All PCRs were performed in a PTC-200 Peltier thermal controller (Biozym), with cycling conditions of 95°C for 30 seconds, 60°C for 30 seconds, and 72°C for 45 seconds, for 35 cycles.
DNA samples from MRX21 were tested to exclude a sample mix up by haplotyping nine informative markers throughout the genome using a commercial kit (AmpFLSTR Profiler Plus PCR Amplification kit; Applied Biosystems) following the manufacturer’s protocol.
For verification of the duplication on Xp22 in N089, fluorescent in situ hybridisation (FISH) experiments were performed on metaphase spreads prepared from patient’s lymphoblastoid cell lines. Two BAC clones located at both ends within the duplicated region were used: RP11-510H03 and RP11-759L05. Probe labelling, slide preparation, and hybridisation were carried out essentially as described before.13
Multiplex ligation dependent probe amplification
Probes were designed within each region showing copy number variation (table 2). Additional probes were selected outside the variable regions for quality control and estimation of the genomic size of the presumed chromosomal abnormality. To ensure specific hybridisation, the presence of repetitive sequences was excluded using the BLAT program from the UCSC website.14 For the CNPs, this was not always possible. The hybridising regions of the probes had a melting temperature of at least 65°C and GC content of 35– 60%, both defined using MELTingeny (version 1.0; Ingeny International). For each probe, the ends corresponded to the multiplex ligated probe amplification (MLPA) primers described by Schouten et al,15 allowing simultaneous probe amplification with one pair of primers. Probes within each set were designed to produce PCR products with a size separation of 4 bp, with the products ranging in size from 80 bp to 132 bp. Oligonucleotides were ordered from Illumina Inc. (San Diego, CA, USA), and the downstream oligonucleotide of each pair was 5′ phosphorylated to allow ligation. All reagents for the MLPA reaction and subsequent PCR amplification were purchased from MRC Holland (Amsterdam, The Netherlands).
Variable regions detected in this study
The MLPA reactions were performed essentially as described previously.15 Briefly, 250 ng of genomic DNA was heated at 98°C for 5 minutes. After cooling to room temperature, 1.5 μl of the probe mix (4 fmol/μl for each probe set) and SALSA hybridisation buffer were added to each sample, denatured at 97°C for 1 minute, followed by hybridisation for at least 16 hours at 60°C. Ligation was performed at 54°C for 15 minutes followed by heat inactivation at 98°C for 3 minutes. PCR amplification was carried out for 33 cycles and from each PCR reaction 1 μl of product was mixed with 9.5 μl formamide and 0.5 μl ROX 500 size standard (Applied Biosystems). Product separation was performed using capillary electrophoresis on an ABI 3730 sequencer (Applied Biosystems). For quantitative analysis, trace data were retrieved using Genemapper software following the manufacturer’s protocol (Applied Biosystems). These data were then exported to an Excel worksheet and further calculated as described previously.16
X inactivation analysis
X inactivation patterns were determined using genomic DNA (3 μg) isolated from blood. DNA was digested with BamHI, either in a single digest or in a double digest with HpaII or HhaI in a total volume of 35 μl. PCR analysis of the androgen receptor gene polymorphic trinucleotide17 was performed using primers (forward: 5′-GCTGTGAAGGTTGCTGTTCCTCAT-3′; reverse : 5′- TCCAGAATCTGTTCCAGAGCGTGC-3′) on 3 μl of digested DNA in a PCR machine (GeneAmp PCR system 2400; Perkin Elmer). Cycling conditions were 30 cycles of 93°C for 30 seconds, 55°C for 30 seconds, and 73°C for 30 seconds. A mixture of 1 μl PCR product and 9 μl formamide was analysed by capillary electrophoresis on an ABI 3100 sequencer (Applied Biosystems) using ROX 500 (Applied Biosystems) as a size standard.
RESULTS
Array CGH analysis of 40 MRX families
One affected male was tested by array CGH for each of the 40 MRX families (table 1). For the first 24 samples a dye swap was carried out, in which each patient was hybridised against two different non-overlapping patients. In the last set of 16 patients, a dye swap was only performed to confirm potential unique copy number changes. Seven copy number changes were detected after data analysis. Four of these regions (region 1, 4, 5, and 7 in table 2) on the X chromosome occurred more than once in our group of linked families. Regions 1 in Xp22.3, 4 in Xq22.3, and 5 in Xq26.3 showed copy number changes in 20–30% of all patients tested, and 90% was located outside the linkage interval. Therefore, they were considered clinically irrelevant genomic polymorphisms. In region 7 (Xq28), duplications were identified in three patients, of whom two families mapped to this region. Unique copy number changes were detected in families MRX21 and N089. In the index patient of MRX21, two deletions were identified: one in Xq13 and one in Xq28 (regions 3 and 6 respectively in table 2), which were both located outside the linkage interval in this family. In family N089, the duplication in Xp22.2 (region 2 in table 2) was found to be located inside the linkage interval.
Duplication at Xp22.2 in family N089
In family N089 (fig 1) a unique duplication on Xp22.2 was located inside the linkage interval (table 1, and region 2 in table 2). The duplicated region encompassed 52 overlapping clones (fig 2A) and had a size of 7 Mb. Based on their intermediate log2 ratios and their flanking position at both ends of the duplicated region, RP11-739F03 and RP11-960N04 were most probably the breakpoint clones (fig 2B). FISH and MLPA analysis (fig 2C) confirmed the presence and location of this duplication. Family members indicated by an asterisk (fig 1) were tested by MLPA analysis with gene specific probes in the region. The duplication was detected in the mother and the affected brother. The sister (II.4) and unaffected brother (II.2) (fig 2C) did not carry the duplication. As the mother is a carrier of the duplication, we tested her X inactivation pattern, which revealed a strongly skewed (>90%) X inactivation of the allele carrying the duplication (data not shown).

Two generation family (N089) with MRX. Six family members were available for DNA study. Haplotypes segregating with the MRX are depicted with a black bar. Five members (*) were tested by MLPA analysis. The location of the 7 Mb duplication is indicated by a horizontal arrow and was present in the mother (I.2) and in both affected sons.
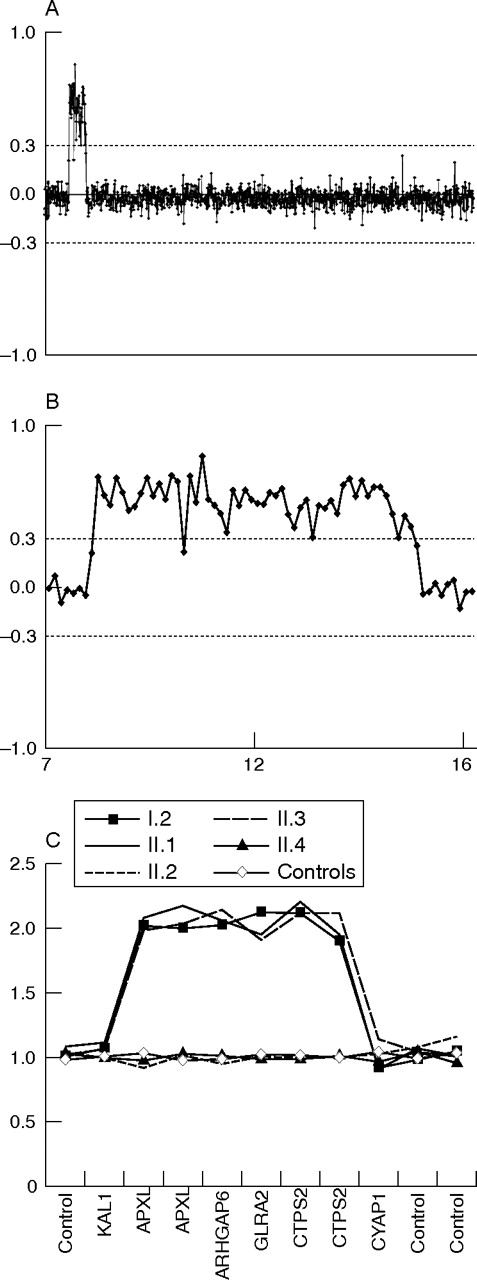
Array CGH profiles and MLPA analysis of family N089. (A) Chromosome X array CGH profile of proband II.1. (B) Enlarged, detailed view of the 7 Mb duplication in Xp22.3. The X axis displays the position of the clones on the X chromosome (Mb), ordered from Xpter to Xqter on the basis of the genomic position (see www.bcgsc.ca/lab/mapping/bacrearray/human/). Each dot represents the mean log2 transformed and Lowess normalised test over reference intensity ratio for each clone (y axis) in a replicate dye swap experiment. Clones are represented by six independent replica spots on the array. Thresholds for copy number gain (log2 ratio = 0.3) or loss (log2 ratio = −0.3) are indicated. (C) MLPA analysis of the duplication in five family members. The genes represented by the synthetic probes in and outside the duplicated region are shown on the x axis. On the y axis, the peak heights relative to control probes and control DNA samples are plotted.
Family N089 was seen for genetic counselling because of two mentally retarded brothers (fig 1; II.1 and II.3). They were born of healthy non-consanguineous parents. They had one unaffected brother and two unaffected sisters. At 44 years of age, II.1 was moderately mentally retarded (full scale intelligence quotient (FSIQ) of 44). A computed tomography scan of the brain at the age of 51 years was normal. Physical examination was performed at 64 years of age. His height was 1.82 m, weight 83 kg, and head circumference 605 mm (90th percentile). He had a long face with large nose and large ears without facial dysmorphism. He used a hearing aid because of the high frequencies hearing loss indicative for presbiacusis. Furthermore, he had pectus excavatum. He had normal genitalia with varicocele of his left testis. His hands showed arachnodactyly. The interdigital muscles of the hand and the calf muscles showed mild atrophy. The other affected brother (II.3) was moderately to severely mentally retarded, but FSIQ testing had not been performed. He had perceptive hearing loss. At time of the physical examination (at the age of 56 years) he was in poor health, probably due to the systemic lupus erythematosus that he had had since the age of 37 years. He had recurrent infections and developed severe arthritis, myocarditis, and dilatating cardiomyopathy. His height was 1.69 m, weight 64 kg, and head circumference 575 mm (75th percentile). Facial dysmorphism included hypotelorism. He had small testes, peripheral muscle atrophy, and erythematous skin.
Duplications in the MECP2 region
Array CGH identified a region on Xq28 including MECP2 (region 7, table 2) that was duplicated in the probands of three XLMR families: T33, T88, and T19. These results were validated by MLPA analysis 15,16 with gene specific probes in this region. The duplication was confirmed to be present in the probands of families T19, T33, and T88 as well as in two of 30 controls (fig 3), and therefore appeared to be a genomic polymorphism. However, the MLPA probes specific for the MECP2 gene confirmed the duplication of MECP2 in patients T33 and T88 but not in the proband of family T19 and the two controls. The duplication of MECP2 was recently found to be causative for the mental retardation and progressive neurological symptoms in family T33 and T88. In these families, the duplication was shown to segregate with the phenotype. Furthermore, elevated MECP2 mRNA levels were measured in the index patients.18 In family T19, we detected a normal single copy MECP2 signal by MLPA, and the MR in this family does not map to Xq28. These data suggest that region 7 consists of two duplications on either side of the MECP2 gene in family T19 and the two controls. Therefore, these results indicate a complex rearrangement mechanism that results either in one large duplication including MECP2, or two separate duplications, both distal and proximal of MECP2, which are not associated with disease and therefore most likely reflect genomic polymorphisms.
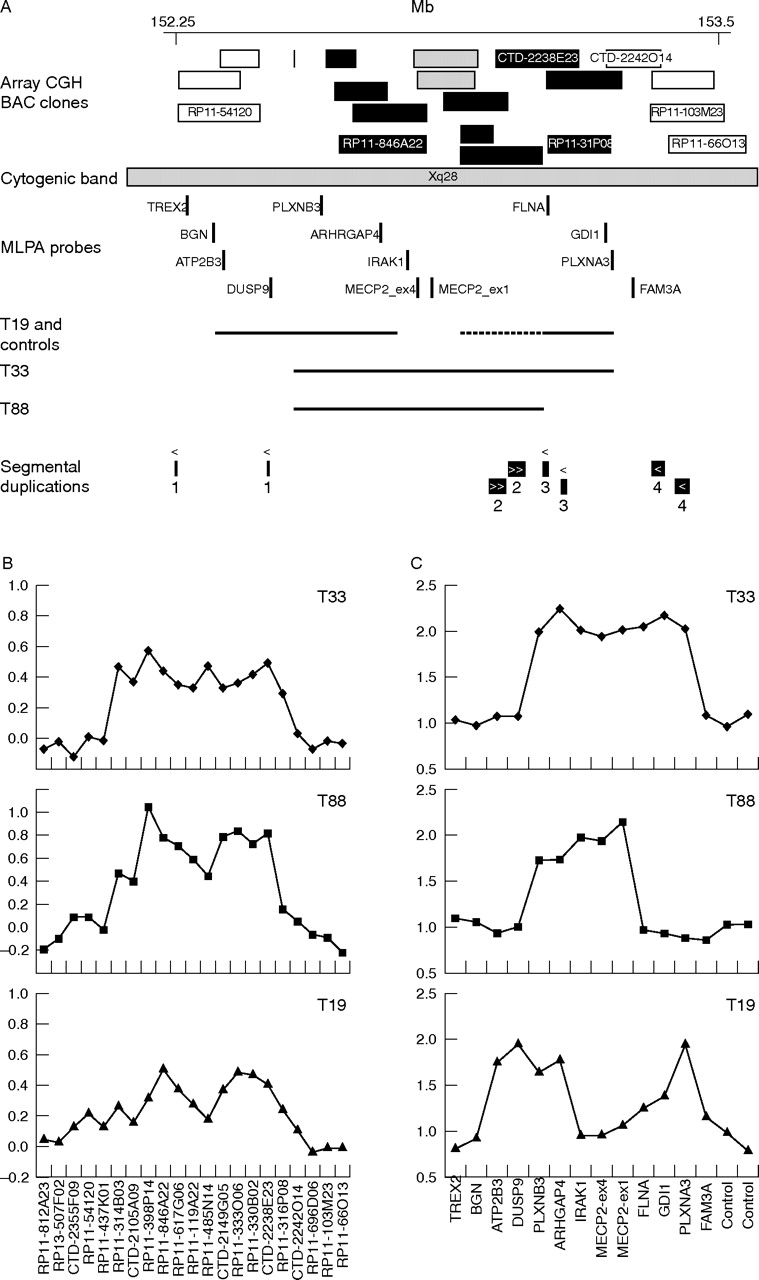
Causative duplications and CNPs on Xq28. (A) Black bars represent BAC clones that showed copy number gain (log2 ratio = 0.3) in at least one of the families T19, T33, and T88. BAC clones with a normal copy number in the array CGH experiments (log2 ratios between −0.3 and 0.3) are indicated by a white bar. Two BAC clones coloured grey overlap with the MECP2 gene and are partially duplicated in T19 (log2 ratio of 0.28 and 0.18). The position of the BAC clones (Mb) is based on the mapping in the May 2004 release of the UCSC Genome Browser (http://genome.cse.ucsc.edu/). MLPA probes used for verification of the duplications are indicated by vertical bars. For each family a horizontal line indicates the duplicated region(s), based on combined array CGH and MLPA data. Owing to ambiguity of the array CGH data and MLPA data for FLNA in family T19, the exact borders of the duplication at the distal side of MECP2 could not be determined, which is indicated by a dotted line. (B) Detailed view of the array CGH data for the Xq28 duplications in family T33, T88, and T19. (C) MLPA analysis of the duplications in families T33, T88, and T19. The genes represented by the synthetic probes in and outside the duplicated region are shown on the x axis. On the y axis, the peak heights relative to control probes and control DNA samples are plotted.
Two unique deletions in family MRX21
Two putative deletions were detected in the index patient from family MRX21. One deletion at Xq13 (table 2 region 3) had a size of about 200 kb, represented by three almost completely overlapping clones that did not harbour any known genes. The second deleted region at Xq28 (table 2 region 6) encompassed five overlapping clones with a total size of about 500 kb. Both these regions were located outside the linkage interval in this family, which is located at Xp22.3 to Xp11.4 with a maximum LOD score of 2.11.19 It thus seems unlikely that the deletions are causative for the disease in this family. To verify the array CGH data, we performed a PCR analysis with STS markers inside and outside the deleted regions in Xq13 and Xq28 (data not shown). To our surprise, PCR products were obtained for both regions in control and patient DNA. As these deletions were detected in DNA isolated from lymphoblastoid cell lines, a second DNA sample from the proband, directly isolated from blood, was analysed by array CGH. In this sample, the same Xq13 deletion was detected, but the five clones in Xq28 had normal copy numbers. Haplotyping nine informative markers throughout the genome excluded a mix up of DNA samples. It thus seems that this rearrangement has occurred during transformation or culturing of an EBV transformed cell line. Xq13 contains several segmental duplications according to the UCSC genome browser (fig 4B). Therefore, MLPA analysis was performed with two probes in this region, which confirmed the deletion of one copy of probe A on Xq13 in the proband of family MRX21. Deletion of this region was not found in the controls or in one of the other patients. Segregation analysis was performed using MLPA for a healthy brother and affected uncle. The MLPA probes were deleted in the proband, but neither the affected uncle nor the healthy sibling carried this deletion. As this deletion is located outside the linkage interval and is not present in the affected sibling, it is most likely a polymorphism.

Copy number polymorphisms. The position of the BAC clones, MLPA probes, and segmental duplications for three CNPs in region 1, 3, and 5 depicted in A–C respectively. Black coloured bars represent BAC clones that showed copy number gain (log2 ratio = 0.3) or loss (log2 ratio = −0.3). BAC clones with a normal copy number in the array CGH experiments (log2 ratios between −0.3 and 0.3) are indicated as a white bar. The Mb position of the BAC clones is based on the mapping in the May 2004 release of the UCSC Genome Browser (http://genome.cse.ucsc.edu/). Vertical black bars represent MLPA probes. Bars with identical characters represent an MLPA probe with multiple positions in the genome.
Copy number polymorphisms
One of the three other copy number changes detected in more than one patient by array CGH is located in intron 4 of the IL1RAPL2 gene (region 4, table 2). This region was previously described as a CNP by Iafrate et al.10 Copy number changes were found in one quarter of our experiments, supporting the notion that this region might be polymorphic. To validate the presence and polymorphic nature of the other two variable regions, all 40 linked families were tested by MLPA analysis.16 Furthermore, the DNA of 30 healthy male controls was tested to determine the incidence of these chromosomal aberrations in the healthy population.
In variable region 1 (table 2), the two overlapping BAC clones RP11-744O08 and RP11-29K08 in Xp22.3 varied in copy numbers in 30% of all hybridisations and RP11-951B16 gave intermediate log2 ratios. This variance was also detected in dye swap experiments. There is one small segmental duplication (fig 4A) in this region described in the UCSC Genome Browser (http://genome.cse.ucsc.edu/).20 The BAC clones that do not overlap with the segmental duplication such as RP11-383I22 and CTD-2008A06 gave normal copy numbers by array CGH (fig 4A). It thus appears that the high copy numbers of this small segmental duplication caused the copy number variance detected by array CGH. MLPA analysis in this region revealed normal copy numbers for all probes on either side of the segmental duplication. The analysis of two probes inside the segmental duplication was hampered due to the high copy numbers, indicating that this region represents a CNP (fig 4A).
Region 5 on Xq26.3 consisted of four overlapping BAC clones that showed genomic copy number variations in 20% of our array CGH experiments (fig 4C). Analysis of MLPA probes in this region was difficult to interpret because of a high copy number of probes C and D in the region. This is in agreement with segmental duplications (UCSC genome browser) in this region. These results indicate that the region harbours several repeat sequences, which can lead to variance in copy numbers between individuals.
DISCUSSION
We have tested a cohort of 40 patients with non-syndromic X linked mental retardation, using X chromosomal BAC arrays. We have found three causative duplications in three families, one unique deletion that most probably represents a genomic polymorphism, and four regions representing copy number polymorphisms (CNPs). One unique duplication of 7 Mb on Xp22.2 was identified in family N089. In family T33 and T88, the MECP2 gene was duplicated. A unique deletion in MRX21 was detected outside the linkage interval and probably represents a genomic polymorphism (region 3). The additional CNPs seem to represent frequently occurring genomic polymorphisms.
In family N089, the mental retardation is probably caused by a dosage effect of one or more genes located within the large duplication on Xp22.2. The duplicated region harbours a total of 35 genes but no known XLMR genes. Only three of these genes (MID1, ARHGAP6, and MSL3L1) are known to undergo X inactivation as described in the UCSC genome browser. It can be expected that increased dosage of these genes is more likely to be causative for the MR in males, because the other genes are normally active in two copies in females. Mutations in the MID1 gene are described to be involved in Opitz syndrome (OMIM 300000).30 The ARHGAP6 and MSL3L1 are not yet associated with any disease. The male specific lethal 3-like 1 (MSL3L1) gene is predicted to be involved in chromatin remodelling and transcriptional regulation.31 The Rho GTPase activating protein 6 (ARHGAP6) is linked to the Rho GTPase pathway.32 Previously, MRX genes had been reported to be involved in similar pathways. As both genes are subject to X inactivation and their predicted functions have similarity with other known XLMR genes, MSL3L1 and ARHGAP6 are interesting candidate genes for XLMR. Further analysis for (micro)duplications in this region in patients with MRX will give more insight in the possible involvement of Xp22.2 genes in non-syndromic mental retardation. Duplications and translocations on the short arm of chromosome X have previously been described in both male and female patients and are often associated with sex reversal (reviewed by Baumstark et al).33 Nevertheless, to our knowledge none of the published duplications overlaps with the duplication described here (http://www.ecaruca.net/).34
The variable region at Xq28 is interesting because of the overlap of causative duplications encompassing MECP2 and duplications also occurring in healthy controls (fig 3). Indeed, two families (T33 and T88) had copy number variations including MECP2, whereas all other controls and patients had normal copy numbers for MECP2 (fig 3). Three XLMR genes are located in this region; only MECP2 has been described to lead to a phenotype, owing to elevated expression levels.18,35,36 A dosage effect of SLC6A8 (located between DUSP9 and PLXNB3, fig 3) and GDI1 has not been reported to be involved in disease. Interestingly, we found the same region duplicated in family T19 and two controls but with normal copy numbers for MECP2 (fig 3 and table 2). These data show that in a region of 500 kb on Xq28, causative duplications are combined with CNPs. This region is a good example of the difficult interpretation of CNPs versus causative copy number changes. It also underlines the importance of verification with an independent technique to detect complex rearrangements as in T19 and controls, and discriminate those from causative duplications in the same region. Interestingly there are segmental duplications located near the duplication breakpoint regions. These repeat sequences might play a role in the generation of these complex rearrangements. Further analysis of this region and additional CNPs should give more insight in the underlying mechanism and variable sizes of these duplications occurring in patients and controls.
Four other regions on the X chromosome showed a high incidence of variation by array CGH. Recently two independent groups published genome wide polymorphic regions detected by array CGH or representational oligonucleotide microarray analysis.9,10 Only one of these groups looked at copy number changes on the sex chromosomes.10 In that study, array CGH was performed for 55 unrelated individuals (39 healthy individuals and 16 patients with previously described chromosomal aberrations) using a BAC array with an average spacing of 1 Mb between clones. This analysis revealed 16 CNPs on the X chromosome (90 changes in 55 people). It was hypothesised that each of these CNPs may involve gains and losses as large as 2 Mb. These results are not supported by our array CGH data, which show only four highly variable regions on the X chromosome in 40 patients with losses and gains not larger than 500 kb. Only one of these was identified previously, in the study of Iafrate et al (region 4, table 2). Although the previous study used different BAC clone sets, hybridisation procedures, methods of data analysis, and patient populations of different ethnic background, this seems inadequate to explain the differences in the number of identified genomic polymorphisms. In fact, we expected to find even more CNPs in our study as we used a full coverage X chromosomal BAC array. Although we cannot explain the discrepancy with the earlier published data, we have high confidence in the present data as we have verified all new polymorphic regions by MLPA analysis.
Several studies have shown the potency of array CGH as a diagnostic tool. Recently, a set of 100 patients with mental retardation and dysmorphic features has been screened with a full coverage whole genome array.37 In at least 10% of these patients with unexplained MR, causative deletions or duplications were identified, which is twice as high as detected by traditional karyotyping (5–10 Mb resolution). In another study, a 1 Mb resolution array was used to detect 12 copy number abnormalities in 50 patients (12%) with MR and dysmorphic features.38 In our set of 40 MRX families, no causative deletions were detected, indicating that deletions of detectable size cause MRX in less than 2.5% of the cases. However, we identified causative duplications in three of 40 families (7.5%). Because the MR is still unexplained in many MRX families, it might well be that duplications are more often involved in MRX. Based on our results and previous studies, array CGH can be used as a diagnostic tool for patients with mental retardation with or without dysmorphic features. The incidence of genomic rearrangements detectable by array CGH seems to be higher in patients with MR in combination with dysmorphic features. Future studies, in which more patients will be investigated by array CGH and MLPA, will provide more insight in the incidence of duplications causing MRX.
Acknowledgments
We thank the families for their cooperation in this research. We are also indebted to C Beumer and T Baijens for culturing the patient cell lines. We would also like to thank J Bokhorst, G Schobers, W van der Vliet, I Janssen, T Feuth, and C on Choy for expert technical assistance. This work was supported by grants from EU, QLG3-CT-2002-01810 (DL and HvB, EURO-MRX), Brain Foundation of the Netherlands, grant H02.10 (H G Yntema).
REFERENCES
Footnotes
-
Published Online First 16 September 2005
-
Competing interests: there are no competing interests.
Linked Articles
- Correction