Article Text

Abstract
Objective: The authors describe a method, termed array painting, which allows the rapid, high resolution analysis of the content and breakpoints of aberrant chromosomes.
Methods: Array painting is similar in concept to reverse chromosome painting and involves the hybridisation of probes generated by PCR of small numbers of flow sorted chromosomes on large insert genomic clone DNA microarrays.
Results and Conclusions: By analysing patients with cytogenetically balanced chromosome rearrangements, the authors show the effectiveness of array painting as a method to map breakpoints prior to cloning and sequencing chromosome rearrangements.
- FISH, fluorescence in situ hybridisation
- CGH, comparative genomic hybridisation
- RCP, reverse chromosome painting
- chromosome rearrangement
- DNA microarrays
- reverse chromosome painting
- chromosome breakpoint
Statistics from Altmetric.com
- FISH, fluorescence in situ hybridisation
- CGH, comparative genomic hybridisation
- RCP, reverse chromosome painting
The approach to the sequencing of the human genome by genome centres in the public domain has generated an invaluable resource of mapped and sequenced large insert clones, which are revolutionising molecular cytogenetics. No longer is it necessary to build a physical map of a chromosome region implicated in human disease but now any region of any chromosome can be viewed on the internet using one of the genome browsers such as Ensembl (http://www.ensembl.org/Homo_sapiens/cytoview), the UCSC Genome Bioinformatics Site (http://genome.cse.ucsc.edu/index.html?org=Human) or MapViewer (http://www.ncbi.nlm.nih.gov/mapview/). Clones can be easily selected and obtained for use in fluorescence in situ hybridisation (FISH) investigations of aberrant chromosomes and breakpoint spanning clones can now be identified in a systematic way. However, such FISH investigations typically require several rounds of hybridisations starting with clones relatively widely spaced followed with clones at increasingly higher densities until the aberration is defined. This process can be labour and time intensive as many clones have to be hybridised to the patient’s chromosomes.
The same clone resource from the sequencing of the human genome is being used in the construction of large insert clone DNA microarrays.1–4 Originally, such arrays were constructed to replace metaphase chromosomes in comparative genomic hybridisation (CGH) experiments to provide increased resolution in regions of copy number change. Similarly, these arrays should be equally useful in other procedures using metaphase chromosomes as the target for hybridisation. One such application is reverse chromosome painting (RCP).5 In RCP, the aberrant chromosome is purified by flow sorting, amplified using DOP-PCR and hybridised onto normal metaphase spreads using FISH. The pattern of hybridisation identifies the composition of the aberrant chromosome and the position of the breakpoints. The precision of this analysis is of course limited by the resolution afforded by metaphase chromosomes such that breakpoints can be localised only to within approximately 5–10 Mb. In this report, we demonstrate that hybridisation of probes generated from flow sorted aberrant chromosomes to DNA microarrays, in a process we have termed “array painting”, allows the high resolution identification of the composition of aberrant chromosomes and localisation of rearrangement breakpoints. The analysis resolution is governed by the size and density of clones on the array. In particular, we show that not only are clones spanning the breakpoint easily identified, but also that the position of the breakpoint within the spanning clone can be estimated. We demonstrate the effectiveness of array painting by the analysis of two clinical cases, both involving cytogenetically balanced translocations.
METHODS
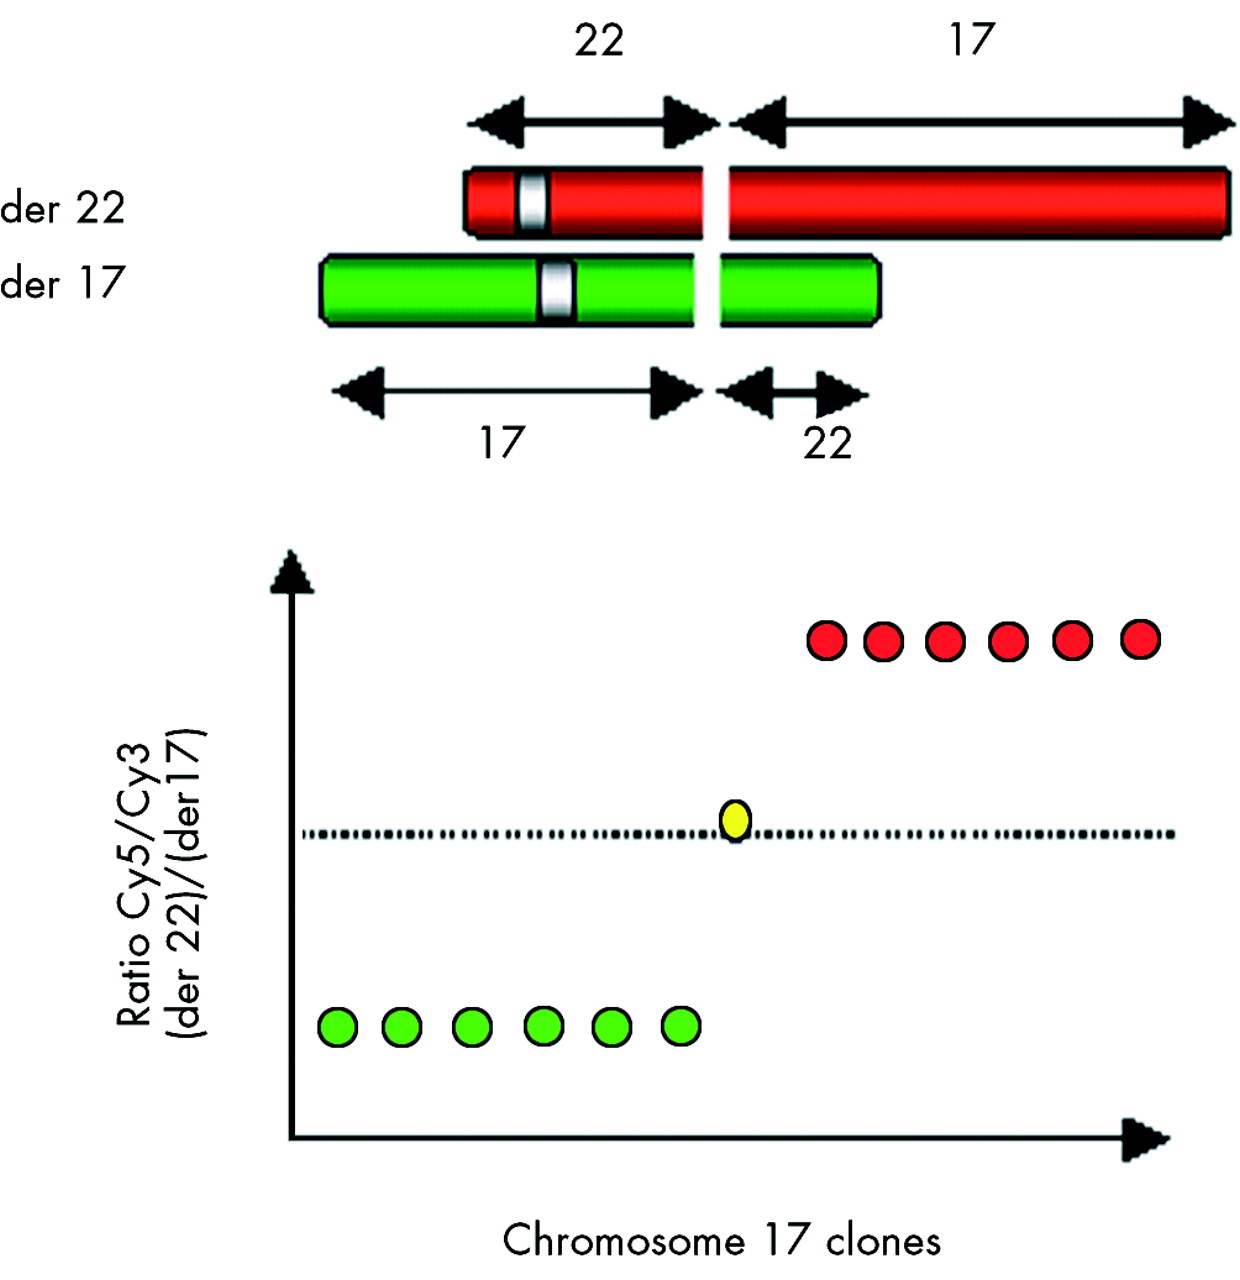
The basic method of array painting involves the separation of the two derivative chromosomes from the balanced translocation, which we achieve by flow sorting. The sorted chromosomes are amplified, differentially labelled, and hybridised onto the DNA array. Only clones corresponding to the sequences present in the sorted chromosomes will show fluorescence above background and the fluorescence ratio will either be high or low depending to which derivative chromosome the sequence of the clone corresponds (see fig 1, using case 1 as an example). If a clone on the array spans the breakpoint, sequences from both the derivatives (der 17 and der 22 in fig 1) will hybridise generating intermediate ratio values.

The basic principles of mapping translocation breakpoints by array painting.
Cell lines
Lymphoblastoid cell lines for the patients were established by the European Cell and Culture Collection, Porton Down, UK (cell line reference numbers: case 1, DD0719; case 2, DD1260).
DNA microarrays
DNA microarrays were constructed as previously described.3 Briefly, sequencing clones from libraries held at the Wellcome Trust Sanger Institute were obtained from the published Golden Path at the time of selection. For the 1 Mb whole genome array, large insert clones were selected to be spaced at approximately 1 Mb intervals across the human genome. For the chromosome 17/22 specific custom array, areas of interest were covered in higher density using tiling path clones. Clone details can be obtained from the Ensembl genome browser www.ensembl.org/Homo_sapiens/cytoview. DNA from the clones was isolated, amplified by DOP-PCR and spotted in either duplicate (1 Mb array) or triplicate (17/22 custom array) onto 3D-link activated slides (Motorola, Schaumburg, IL, USA) using a MicroGrid II arrayer (BioRobotics, Boston, MA, USA).
Chromosome preparation and flow cytometry
Chromosomes were prepared and stained in polyamine buffer from EBV transformed B cell lines from the patients as described previously.6 The preparations were analysed and sorted using either an Epics Elite ESP (Beckman/Coulter Coulter Electronics, Florida, USA) or a MoFlo (Cytomation Bioinstruments GmbH, Freiburg, Germany). For DOP-PCR amplification, aliquots of 500 aberrant chromosomes were flow sorted into PCR tubes containing 33 µl of sterile, UV-treated water and amplified as described previously5 using the primer DOP 2.3 For amplification using GenomiPhi (Amersham Biosciences, Buckinghamshire, UK), template DNA was extracted from 250 000 derivative chromosomes sorted into chromosome sheath buffer (10 mM Tris-HCl (pH 8.0), 1 mM EDTA, 100 mM NaCl, 0.5 mM Na Azide) by incubation with 1/10 volume 0.25 M EDTA/10% sodium lauroyl sarcosine and 1/100 volume proteinase K (20 mg/ml in water; BRL Cat.no. 25530–015) overnight at 42°C, followed by incubation with Phenylmethylsulphonyl fluoride (final concentration 40 µg/ml) for 40 minutes at room temperature. The sample DNA was then precipitated and gently resuspended in TE buffer (1 mM Tris-HCl, 0.1 mM EDTA, pH 7.4) to a final concentration of 1 ng/µl and 1 µl (1 ng) amplified following the manufacturer’s instructions (GenomiPhi DNA amplification kit, Amersham Biosciences).
Preparation of hybridisation probes
Probes were prepared using either 450 ng of GenomiPhi amplified derivative chromosome DNA (case 1) or 450 ng of DOP amplified derivative chromosome DNA (case 2) in a Bioprime Labelling Kit reaction (Invitrogen, Carlsbad, CA) with modification of the nucleotide mix as described previously.3 Derivative chromosomes were differentially labelled with either Cy3-dCTP or Cy5-dCTP (NEN Life Science Products, Boston, MA).
Array paint hybridisation and analysis
Array hybridisation was performed generally as described previously.3 For the 1 Mb array (area of 2×3 cm), both labelled DNAs were combined, precipitated together with 135 µg of human Cot1 DNA (Roche, Mannheim, Germany) and resuspended in 60 µl of hybridisation buffer (50% formamide, 10% dextran sulphate, 0.1% Tween 20, 2 × SSC, 10 mM Tris-HCl pH 7.4) and 6 µl of yeast tRNA (100 µg/µl, Invitrogen, Carlsberg, CA, USA). The hybridisation mix was prehybridised for 1 hour at 37°C as described.3 For prehybridisation of the arrays, 80 µl of herring sperm DNA (10 mg/ml, Sigma–Aldrich Company Ltd, Dorset, UK) and 135 µg of human Cot1 DNA (Roche, Mannheim, Germany) were precipitated, and resuspended in 140 µl of hybridisation buffer. For the 17/22 custom array (area of 2×0.75 cm), a third of the quantities detailed above were used. Hybridisation was performed as described previously.3
Arrays were scanned using an Axon 4000B scanner (Axon Instruments, Burlingame, CA). Images were analysed by GenePix Pro 3.0 software (Axon Instruments, Burlingame, CA). Spots were defined using the automatic grid feature and adjusted manually where necessary. Fluorescent intensities of all spots were calculated after local background subtraction. The ratios of the intensities were then plotted against the distance of the clones along the chromosomes from the p termini.
Array CHG analysis of case 2 was performed as described previously.3
Metaphase fluorescence in situ hybridisation (FISH)
Clone DNA (either prepared by conventional alkaline lysis from glycerol stocks stored at the time of array production) or DOP amplified clone DNA (used in array production3 ) was labelled with biotin-16-dUTP (Roche, Mannheim, Germany) or digoxigenin-11-dUTP (Roche, Mannheim, Germany) by nick translation. In situ hybridisations were conducted following conventional methods using chromosomes prepared from cell lines derived from patient samples. Biotin labelled probes were detected using Avidin TexasRed (Molecular Probes Inc., Eugene, USA) whilst digoxigenin labelled probes were detected with a combination of mouse antidigoxigenin (Vector Laboratories Ltd, Peterborough, UK) and goat anti-mouse FITC (Sigma-Aldrich Company Ltd, Dorset, UK) antibodies.
Fibre fish analysis
Extended chromatin fibres were prepared from the normal lymphoblastoid cell line HRC 575, following an alkaline lysis procedure. Briefly a 10 µl aliquot of a 2.5×10⁶ HRC575 cells/ml was placed on a glass slide and allowed to dry. The glass slide was then mounted in a plastic Cadenza coverslip (Thermo Shandon, Pittsburgh, USA) and 150 µl of alkaline lysis buffer (5 parts 70 mM NaOH, 2 parts absolute ethanol) passed between the slide and coverslip followed by 150 µl of absolute ethanol after approximately 20 seconds incubation. The coverslip was then gently separated from the glass slide and the stretched DNA fibres allowed to air dry. Fibre FISH hybridisation was conducted following the method described above. Clone RP11-87N6 was labelled with SpectrumOrange-dUTP (Vysis Inc, Illinois, USA); clone RP11-749I16 with biotin-16-dUTP and detected with Avidin-Cy5 (Molecular Probes Inc, Eugene, USA); clone RP11-737D6 with digoxigenin-11-dUTP and detected with a combination of mouse anti-digoxigenin and goat anti-mouse FITC antibodies.
RESULTS
Case 1
The patient, a boy, was presented to the paediatricians at the age of two and a half, because he had not developed language. He had a normal full term delivery with no neonatal problems. He was born with a coloboma of the left eye and an intermittent convergent squint; the right eye had good vision. When assessed at the age of 3 he scored well, apart from hearing and speech, and was thought to be a normal child with delayed speech. At 3 years and 8 months he talked in clear sentences, however at 4 years 4 months his behaviour regressed significantly and he became withdrawn and unresponsive. He continued to regress and developed epilepsy at 4 years 8 months. Chromosome analysis showed the patient to have a 46,XY t(17;22)(q21.1;q12.2) de novo chromosome constitution.
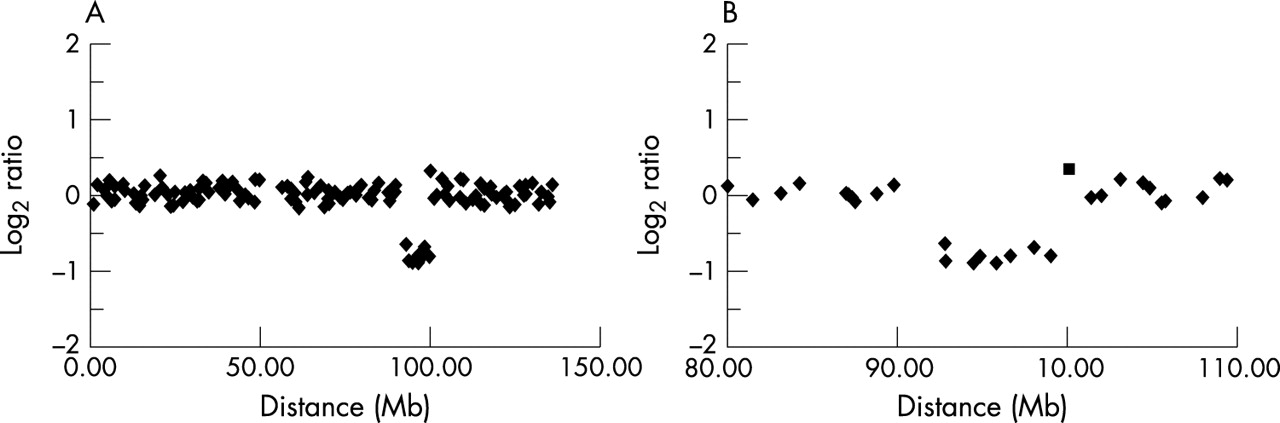
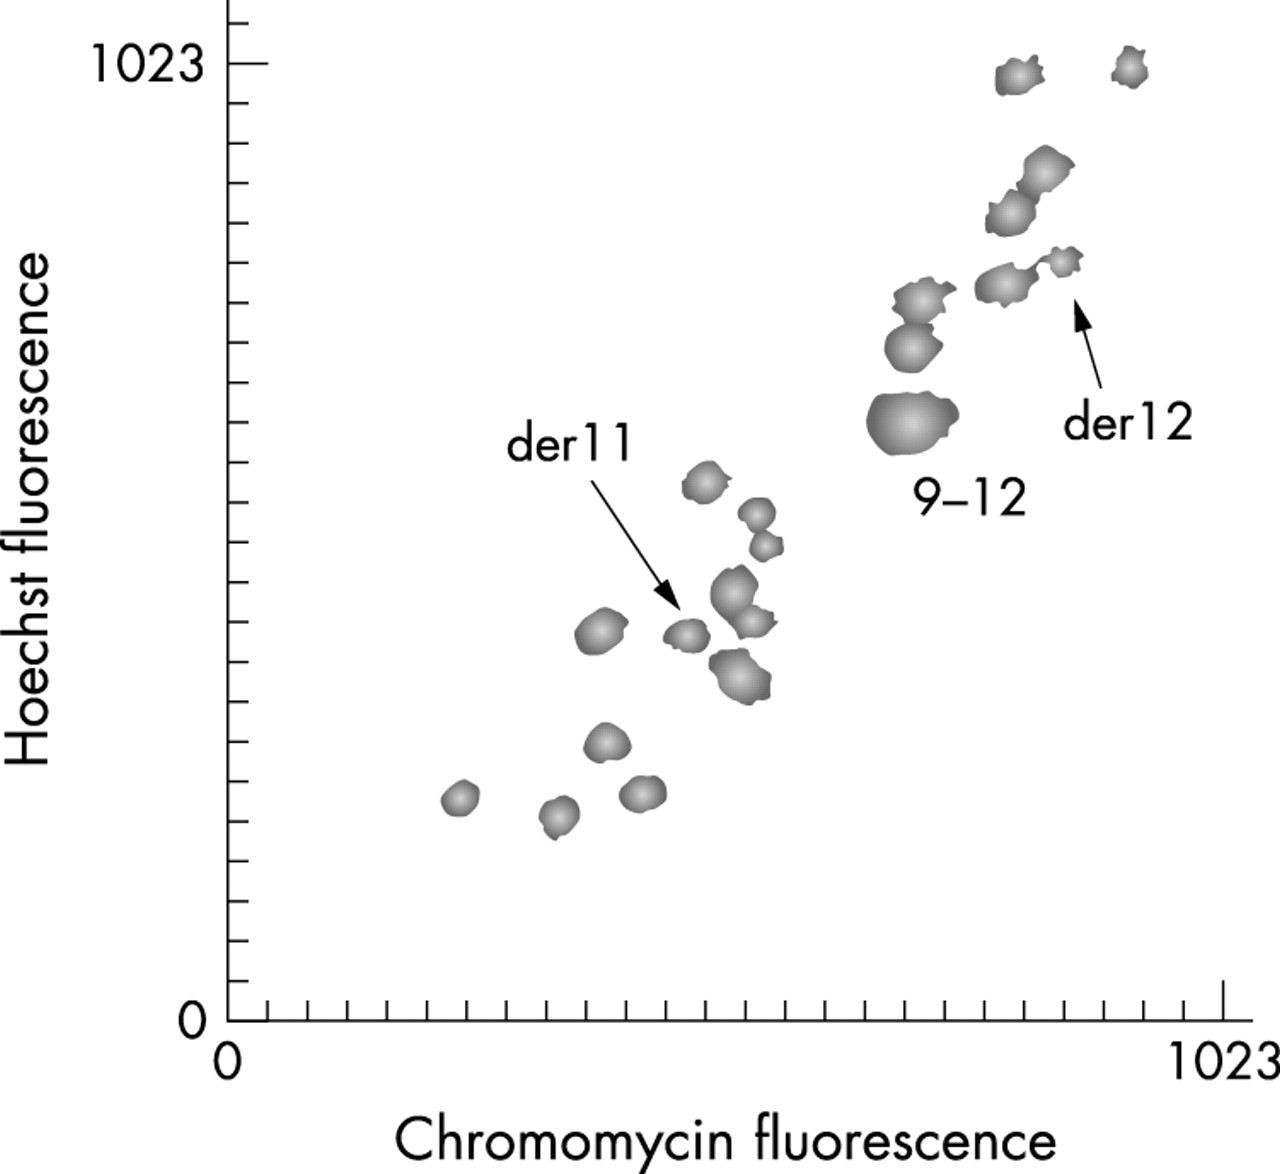
A partial flow karyotype of this patient is shown in fig 2. The two derivative chromosomes were clearly identified and well separated from their normal homologues. The two derivative chromosomes were flow sorted, amplified using GenomiPhi and applied to the 1 Mb resolution array. Consistent high and low ratios were found only for clones representing chromosomes 17 and 22 with the exception of weak signals on chromosome 19. This is explained by the proximity of chromosome 19 to the derivative 17 on the flow karyotype such that chromosome 19 would be a minor contaminant of the derivative 17 sort. The ratio profile for chromosome 17 is shown in fig 3A. A sharp transition in ratio from low values of approximately −4 log2 (linear ratio of 1:16) for clones representing the short arm and the proximal long arm of chromosome 17 to high values of over +4 log2 (linear ratio of 16:1) for the distal long arm define the breakpoint. Thus the chromosome 17 breakpoint lies between clones RP11-94L15 positioned at 39.9 Mb and RP5-1112G21 positioned at 40.7 Mb along the chromosome. A similar ratio transition but from high values to low values was found for chromosome 22 defining the breakpoint between clones CTA-992D9 positioned at 24.2 Mb and RP3-353E16 positioned at 25.0 Mb along the chromosome (see fig 3B). Intermediate ratios which would identify clones spanning the breakpoint were not found.

Partial flow karyotype of case 1.

Array painting profiles for the derivative chromosomes of case 1. (A) 1 Mb array chromosome 17 plot, (B) 1 Mb array chromosome 22 plot, (C) tiling path array chromosome 17 plot (▪ RP11-749I16, ▴ RP11-737D6, ⧫ RP11-87N6), (D) tiling path array chromosome 22 plot (⧫ RP11-46E17).
To allow higher resolution mapping of the rearrangement, clones positioned within the two intervals defined by the clones bordering the breakpoints were identified using the Ensembl CytoView browser and used to construct a small custom array of overlapping clones. The differentially labelled derivative chromosomes were then hybridised to this custom array as before. As can be seen in fig 3D, a clear transition from high to low ratios for chromosome 22 was seen with the exception of one clone RP11-46E17 which showed an intermediate value just below 0 log2 (linear ratio of just below 1:1) indicating that this clone spans the chromosome 22 breakpoint.
This clone was hybridised using FISH to metaphase spreads from the patient which confirmed that it spanned the breakpoint. As can be seen in fig 4, signals (green) derived from RP11-46E17 can be seen not only on the normal chromosome 22 homologue but also on both derivative chromosomes.

Localisation of RP11-46E17 (green signals) onto metaphase from the patient described in case 1.The red signals (clone CTA-722E9) map to 22q13.33 and identify the normal chromosome 22 and the derivative 17.
For the chromosome 17 breakpoint, the custom array identified three clones with intermediate values RP11-749I16, RP11-737D6 and RP11-87N6 (data points ▪, ▴, and ⧫ respectively in fig 3). All three clones were confirmed as spanning the breakpoint by using FISH (data not shown). Each clone produced a consistent but different intermediate ratio from the others with RP11-737D6 being closest to a 1:1 ratio. We considered that these different intermediate ratios could be due to the position of the breakpoint within each clone. To identify the precise physical relationship and degree of overlap between these clones we constructed a Fibre FISH map (see fig 5). This confirmed the overlap and orientation of the three clones relative to each other as well as identifying the region of shared overlap within which the breakpoint must reside. Comparing this map to the intermediate ratios reported by these clones (see fig 3C), we found that the proportion of each clone estimated to be present in each derivative correlated well with the ratios measured on the custom array—that is, RP11-749I6 having a lower ratio than RP11-737D6 (both with slightly negative ratios) and RP11-87N6 showing a small positive ratio.

Fibre FISH analysis of clones RP11-737D6, RP11-749I16, and RP11-87N6 on DNA from a normal control. (A, B, C) individual clone images, (D) composite image. (A) RP11-737D6, (B) RP11-749I6, (C) RP11-87N6.
Case 2
The patient, a 7 year old girl, was referred for cytogenetic investigation due to “triangular facies and failure to thrive”. Chromosome analysis revealed the patient to have a 46,XX,t(11;12)(q21;p13.33) de novo chromosome constitution. At the age of 20 she was described as having borderline intelligence and temporal lobe epilepsy.
A partial flow karyotype for this patient is shown in fig 6. The two derivative chromosomes were flow sorted, amplified by DOP-PCR and applied to the 1 Mb resolution array. For chromosome 11 a complex pattern of ratios was observed on the array (see fig 7A and C). A transition from a low to a high ratio between clones RP11-90K9 (87.1 Mb, ⧫ in fig 7C) and RP11-320L11 (87.5 Mb, ▪) was immediately followed by a transition from a high to a low ratio between clones RP11-137O10 (88.9 Mb, ▴) and RP11-156E23 (89.1 Mb, □). The next set of clones encompassing RP11-325I16 (92.9 Mb) to RP11-379J13 (99.1 Mb) showed only background signals indicating that this DNA was not contained within either derivative chromosome and potentially was deleted. High ratios were then observed from the next clone RP11-49M9 (101.5 Mb, •) to the qter. The pattern for chromosome 12 was much simpler (see figs 7B and D), the first clone from the pter RP11-359B12 (1 Mb, ▪ in fig 7D) showing an intermediate ratio while the remaining clones reported high ratios. The intermediate ratio for RP11-359B12 suggested that this clone spanned the chromosome 12 breakpoint which was subsequently confirmed by FISH analysis (data not shown).

Partial flow karyotype of Case 2.

Array painting profiles for the derivative chromosomes of case 2. (A) and (C) full and expanded chromosome 11 plots, (B) and (D) full and expanded chromosome 12 plots. (C) ⧫ RP11-90K9, ▪ RP11-320L11, ▴ RP11-137O10, □ RP11-156E23, • RP11-49M9. (D) ▪RP11-359B12.
To confirm the potential deletion on chromosome 11, array CGH was performed using DNA from the patient (see fig 8). This analysis identified the same deletion with the exception of clone RP11-99C10. This clone reported a modal ratio in the array CGH analysis but appeared to report a deletion in the array painting experiment. As these results were discrepant, we analysed all of the clones from RP11-90K9 to RP11-49M9 by FISH onto metaphases from the patient (data not shown). This confirmed that sequences represented by clones RP11-320L11 and RP11-137O10 were present on the derivative 11, all clones from RP11-325I16 to RP11-379J13 were deleted and RP11-156E23 was present on the derivative 12. The discrepancy for RP11-99C10 was also explained as while it was deleted from the derivative chromosome, this clone generated multiple other signals including nine major signals on chromosomes 3 (2 signals), 10, 11, and X. In array CGH, this clone will report the copy number relative to all hybridising regions such that the loss of one locus within nine or more regions would be too small a copy number change to be detected on the array. However, in the array painting experiments, as DNA for only the derivative chromosomes is hybridised to the array, other homologous regions are not represented and deletion of the sequence in the derivative will be correctly reflected.
Array CGH chromosome 11 profiles for case 2. (A) full plot, (B) expanded plot (▪ RP11-99C10).
DISCUSSION
In this study we have shown that array painting of probes generated from flow sorted aberrant chromosomes provides for much higher resolution analysis than is afforded by reverse chromosome painting onto metaphase chromosomes. This method allows the rapid identification of chromosome rearrangements and the composition of aberrant chromosomes with the localisation of breakpoints restricted only by the resolution of the array.
In the first case, we were able to map the breakpoints to within the 1 Mb intervals between clones RP11-94L15 (39.9 Mb from pter) and RP5-1112G21 (40.7 Mb) on chromosome 17 and between clones CTA-992D9 (24.2 Mb) and RP3-353E16 (25.0 Mb) on chromosome 22. This analysis enabled us to construct a focused, small custom array within these 1 Mb intervals using clones from the tiling path identified with the Ensembl Cytoview genome browser. As these clones are overlapping, it is inevitable that at least one clone per interval will span the breakpoint. Hybridisation of the derivative chromosomes to this custom array clearly identified one spanning clone for the chromosome 22 breakpoint (RP11-46E17) but three breakpoint spanning clones for the chromosome 17 breakpoint (RP11-737D6, RP11-749I16, and RP11-87N6). We confirmed that these clones spanned the breakpoints by FISH onto chromosomes from the patient. We were also able to show that the absolute value of the intermediate ratio from the chromosome 17 breakpoint spanning clones correlated well with the position of these clones relative to the breakpoint. For example, from the Fibre FISH map that we constructed from these three chromosome 17 breakpoint spanning clones, the breakpoint within RP11-87N6 would be positioned towards the centromeric end of the sequence. Thus more of the sequence represented by this clone would be present on the derivative 17 chromosome than the derivative 22 generating a slightly positive ratio on the array. Conversely, the breakpoint was positioned more telomeric within RP11-749I16 so that this clone reported a slightly negative ratio. Detailed analysis of the ratio reported by breakpoint spanning clones can thus estimate the position of the breakpoint within the sequence of the clone.
In the second case we were surprised to find a more complex rearrangement which had not been observed by chromosome banding analysis. Firstly, the absence of any fluorescence from a series of chromosome 11 clones on the array identified a deleted region. This deletion was confirmed by array-CGH and FISH analysis. Secondly, we found additional transitions from a low to a high ratio between clones RP11-90K9 (87.1 Mb) and RP11-320L11 (87.5 Mb) immediately followed by a transition from a high to a low ratio between clones RP11-137O10 (88.9 Mb) and RP11-156E23 (89.1 Mb). Therefore, the derivative 12 retains the sequence represented by clones RP11-320L11 and RP11-137O10 while the derivative 11 retains the sequence represented by RP11-90K9 and RP11-156E23. As this pattern does not follow the normal order of clones, we concluded that an inversion has taken place. Again we were able to confirm the position of the retained clones on the derivative chromosomes using FISH analysis. The most likely explanation for this rearrangement is that initially one chromosome 11 experienced an inversion/deletion event with an inversion between RP11-320L11 and RP11-49M9 and a deletion of just over 6 Mb between RP11-325I16 and RP11-49M9. This was then later followed by a translocation with chromosome 12, the breakpoint being between RP11-137O10 and RP11-156E23 (see fig 9). Of course it is not possible to tell whether the deletion followed the inversion or vice versa, or indeed if both occurred as a result of the same event.

Proposed scheme of the chromosome 11 rearrangements leading to the generation of the derivative chromosomes of case 2.
The derivative 12 breakpoint in the second case was straightforward as the breakpoint spanning clone was identified directly on the 1 Mb array (RP11-359B12). As the sequence coverage of the 1 Mb resolution array is approximately 150 kb per Mb (one clone per megabase) we would expect to directly identify breakpoint spanning clones in 15% of cases.
While the array painting approach we have described here will allow the identification of not only breakpoints but also associated deletions and insertions within the derivative chromosomes (at the resolution of the array), intrachromosomal duplications would not be detected unless the duplicated region is present on both derivatives. Because intrachromosomal duplications within a single derivative chromosome will be labelled by the same fluorochrome and ratioed essentially against background fluorescence, the array is unable to quantify accurately altered copy number. By changing the assay so that each derivative is hybridised onto separate arrays against normal genomic control DNA, such duplications would be identified as the ability of the array to measure copy number changes would be restored. However, we believe a better approach to identify such duplications is to perform a complete array CGH experiment with the patient’s DNA. The array CGH analysis will not only identify an intrachromosomal duplication, but will also screen the rest of the genome for unexpected gains and losses which might be associated with the phenotype, particularly in cases where the translocation is cryptic. However, even the combined array painting and array CGH analysis will be unable to identify other structural rearrangements not involving DNA copy number changes (such as inversions) unless, as we have shown in case 2, the inversion alters the normal order of sequences across the breakpoint.
The main aim of mapping rearrangement breakpoints in the patient to within spanning clones is that identification of the gene or genes responsible for the phenotype will be enabled. Array painting facilitates this process by not only being less time consuming than FISH for the breakpoint identification, but also by screening simultaneously the entire derivatives for other abnormalities. Supplemented with array CGH analysis, a comprehensive molecular cytogenetic profile of the patient is achieved rapidly and with as few as two hybridisations to the arrays. An additional benefit is that the same flow sorted DNA used for array painting provides ideal template for even higher resolution mapping of the breakpoints (and therefore the genes involved) using PCR analysis with primers designed from the sequence of the spanning clones.7
In conclusion, array painting with flow sorted derivative chromosomes enables rapid and efficient mapping of chromosome rearrangement breakpoints at a resolution only governed by the density of clones on the array. We are in the process of constructing whole chromosome tiling path arrays (arrays for chromosomes 1, 6, and 22 are completed) and ultimately a tiling path array for the whole human genome. Application of array painting to these arrays will guarantee the identification of breakpoint spanning clones. Finally, array painting is less time consuming than equivalent mapping performed by individual hybridisations of large insert clones using FISH, particularly where rearrangements are numerous and complex. As large insert genomic microarrays become more widely available and array painting will undoubtedly be equally applicable to microdissected chromosomes, it is likely that array painting will become the initial method of choice for breakpoint mapping prior to cloning and sequencing chromosome rearrangements.
Acknowledgments
We would like to thank J Tyrrell and C Sprat for clinical information.
Footnotes
-
↵* These authors contributed equally to this work.