Article Text

Abstract
A method based on quantitative fluorescent multiplex PCR has been developed to detect major rearrangements of the low density lipoprotein receptor gene (LDLR) which account for ∼5% of mutations. The method involves two PCR reactions; the first (P1) amplifies the selected exons using unique primer sequences tagged with newly designed universal primers, while the second (P2) amplifies the P1 amplicons using the universal primers. One of the P2 universal primers is labelled with a fluorescent dye which is incorporated into the PCR products which are then electrophoresed on an ABI DNA sequencer. The relative amounts of the amplified peak areas are determined and compared to ratios obtained for DNA from four normal controls and known major rearrangements. The multiplex set developed is based on LDLR exons 3, 5, 8, 14, and 17 and 86% of reported major rearrangements would be detectable by this assay as well as any deletions and insertions of greater than 1 bp. The method was evaluated using DNA from 15 reported deletions and duplications which were all correctly identified. Two groups of UK patients with a clinical diagnosis of familial hypercholesterolaemia (FH) and where no mutation had been identified inLDLR or APOB (14 children and 42 adults) were screened for the presence of majorLDLR rearrangements by this assay. Three major rearrangements were detected and a 4 bp duplication was identified in a fourth patient. Since it avoids the problems associated with Southern blotting, this method will be useful for detecting gene rearrangements.
- familial hypercholesterolaemia
- LDLR
- major rearrangements
- universal primer quantitative fluorescent multiplex PCR (UPQFM-PCR)
Statistics from Altmetric.com
- familial hypercholesterolaemia
- LDLR
- major rearrangements
- universal primer quantitative fluorescent multiplex PCR (UPQFM-PCR)
Familial hypercholesterolaemia (FH) is an autosomal dominantly inherited disorder of lipoprotein metabolism. It is characterised by hypercholesterolaemia owing to raised plasma low density lipoprotein cholesterol (LDL-c), tendon xanthomas (TX), premature coronary heart disease (CHD), and a family history of one or more of these. In the majority of FH patients a mutation in the low density lipoprotein receptor gene (LDLR) is responsible for the defect in LDL clearance. More than 700 LDLRmutations have been reported1 (FH website:http://www.ucl.ac.uk/fh) and ∼80 of these are major rearrangements, ranging from 25 bp to over 20 kb. Deletions and duplications account for ∼5% of mutations found in FH patients from genetically heterogeneous populations.2-5 Many of the major rearrangements have breakpoints that are located at Alu sequences, which occur more often in LDLR than in other genes.2 Repetitive sequences of the Alu family occur at a higher frequency in introns 1 to 8 and intron 12 to the 3′ untranslated region.6 Deletions and duplications are thought to arise from one of two mechanisms involving Alu sequences. If the two Alu sequences are orientated in opposite directions then a double stem loop structure (intrachromosomal recombination) can be postulated,7 but if they are orientated in the same direction then a deletion or duplication may arise owing to unequal crossing over after the mispairing of two Alu sequences on different chromosomes (interchromosomal recombination).2
Many methods have been described to display the deletions and duplications of autosomal disorders or carriers of X linked disorders. Aberrant sized junction fragments can be detected by standard Southern analysis with cDNA probes,8 pulse field gel electrophoresis,9 fluorescence in situ hybridisation,10 and reverse transcriptase PCR from whole blood.11 All these techniques have disadvantages; they are either technically demanding, require fresh samples, or are subject to error. The ability to perform deletion analysis by a PCR based technique should provide considerable advantages over traditional Southern blot based techniques, on account of rapidity and only requiring small quantities of starting material. There are two PCR based methods, long PCR and quantitative multiplex PCR. Long PCR can detect novel major rearrangements and this technique has been used to detect particular LDLR mutations which are prevalent in certain countries.12 13 The entireLDLR gene (∼45 kb), except for intron 1, can be amplified in two fragments of 16.1 and 20 kb,12although deletions of single exons or smaller may be missed when comparing such large fragment sizes and inter-Alu deletions can occur artefactually during PCR.14 The second method, quantitative multiplex PCR, can determine which exons are deleted or duplicated without further analysis, and there is an additional advantage that minor rearrangements, as small as 1 bp, can be detected.
Quantitative multiplex PCR has greatly improved with the recent developments in fluorescence technology and is now used to screen female Duchenne muscular dystrophy (DMD) carriers for deletions and duplications in the dystrophin gene.15 The DMD assay was originally based on two non-fluorescent multiplex PCR sets,16 17 but the 25 exons are now amplified (18 cycles) with a fluorescent tag attached to the reverse primer of each exon. PCR products are sized and quantified automatically on an ABI DNA sequencer. The area under each exon peak is compared with the peak areas of the other exons in the assay and then dosage ratio quotients are determined between the test sample and normal subjects.15
In 1995, a PCR method was described which simplifies the conditions for qualitative multiplex PCR18 whereby gene specific primers were tagged at the 5′ end with an unrelated 20 nucleotide universal primer sequence. Highly specific and efficient amplification of multiple target sequences was achieved easily and reproducibly by simple adjustment of the individual primer concentrations, with no additional modification of either the reaction components or annealing temperatures. An important factor in quantitative multiplex PCR is that comparable yields of the individual coamplified products are obtained and this was achieved with the universal primer qualitative PCR.18
A quantitative fluorescent multiplex PCR (QFM-PCR) to detect majorLDLR rearrangements was designed on this principle. In this article we describe the development of this method, designated universal primer quantitative fluorescent multiplex PCR (UPQFM-PCR), to detect LDLR deletions and duplications involving exons 3, 5, 8, 14, and 17. Two groups of patients with a clinical diagnosis of FH were screened by this assay.
Materials and methods
PATIENT GROUP
Two groups of FH patients were screened for majorLDLR rearrangements. The first group consisted of 76 adult probands, 42 of whom had no detected mutation inLDLR or APOB, who each had a diagnosis of “definite” FH, that is, untreated LDL-c >4.9 mmol/l and a family history of TX.19 They were attending two lipid clinics in London and formed part of the previously published genotype:simvastatin response study.20 The second group was made up of 40 probands under the age of 16, 14 of whom had no mutation identified in LDLR orAPOB, attending lipid clinics held at Great Ormond Street Hospital for Children and Middlesex Hospital, London. The diagnosis was made on an initial total cholesterol level above 6.0 mmol/l and a family history of hypercholesterolaemia and premature CHD.
ISOLATION OF DNA
Genomic DNA was isolated from frozen whole blood, using salt and ethanol precipitation.21 Aliquots of genomic DNA were incubated at 55°C for 30 minutes to ensure that it was completely dissolved and with an equal concentration throughout the tube. The concentrations of genomic DNA were measured by UV spectrophotometry. Half the aliquot was used to determine the concentration and the remainder was diluted to a working concentration of 25 ng/ml, to use as the PCR template.15
UNIVERSAL PRIMER QUANTITATIVE FLUORESCENT MULTIPLEX PCR (UPQFM-PCR)
Normal and relevant deletion and duplication controls were included in all PCR sets. The 20 ml P1 PCR reaction contained 1 × AmpliTaq GOLD PCR buffer (50 mmol/l KCl, 10 mmol/l Tris-HCl, pH 8.3) (Applied Biosystems-Perkin Elmer (ABI PE), USA), 1.5 mmol/l MgCl2 (ABI-PE), and 0.2 U of AmpliTaq GOLD polymerase (ABI-PE), in addition to 100 ng genomic DNA. The sense and antisense specific universal oligonucleotides of the various exons (table 1) were added at different amounts to compensate for differential amplification owing to size and efficiency of primer binding: exon 5 (3 pmol), exons 3 and 17 (4 pmol), and exons 8 and 14 (8 pmol). A six nucleotide tag is located between the universal and unique sequences of the P1 primers which is used for DNA sequencing. Unlabelled universal sense and antisense primers (universal and tag) are efficient primers (CG at the 3′ end) for sequencing P2 products that are specifically amplified. This strategy allows ABI sequence reads of all the exons, splice sites, and the unique primer sequence of the PCR product. The two P2 universal primers can also be used in fluorescent SSCP analysis if they are labelled with different fluorescent tags, thus the P1/P2 system reduces the number of primers requiring a fluorescent tag and increases the use of these primers. Amplifications were performed on an Omnigene thermal cycler (Hybaid Ltd, UK) with a tube control sensor. Cycle conditions for the P1 PCR were as follows: 94°C for 12 minutes, 46°C for one minute, 72°C for one minute for one cycle, and 94°C for one minute, 46°C for one minute, 72°C for one minute for nine cycles with a final extension of 72°C for five minutes. Two ml of the P1 product was immediately removed and added to the appropriate P2 reaction. P2 reagents were as for P1 except 4 pmol of the sense and the 6-Fam labelled antisense universal primers were added instead of the specific universal primers. P2 cycle conditions were as follows: 94°C for 12 minutes, 57°C for one minute, 72°C for one minute for one cycle, 94°C for one minute, 57°C for one minute, 72°C for one minute for 19 cycles with a final extension of 72°C for five minutes. Two ml of each P2 product was mixed with 2 ml of dextran sulphate formamide loading dye and 0.5 ml of Rox 500 standard (ABI-PE). Samples were denatured at 96°C for two minutes, and 1.5 ml of each sample was loaded onto a 12 cm well to read 4.2% non-denaturing acrylamide gel on an ABI DNA 377 sequencer. Samples were electrophoresed for 70 minutes.
Oligonucleotides for the UPQFM-PCR
QUANTITATIVE FLUORESCENT MULTIPLEX PCR (QFM-PCR)
Preparation of the DNA was as above but the PCR reagents were different (Gibco BRL, UK). The 20 ml PCR reaction contained 50 mmol/l KCl, 10 mmol/l Tris-HCl, pH 8.3, 0.067% W-1, 1.5 mmol/l MgCl2, 0.2 mmol/l dATP, dCTP, dGTP, dTTP, and 0.2 U ofTaq polymerase, in addition to 100 ng genomic DNA. A combination of published LDLRoligonucleotides22-24 (combination available on request from KEH) were used with a fluorescent tag (6-Fam or Hex) attached at the 5′ end of the antisense primer. An external control (that is, non-LDLR amplicon) was incorporated into some multiplex sets; 2 pmol of each primer were added except for exons 12, 14, and 18 where 4 pmol were added because of weaker amplification. Amplifications were performed on an Omnigene thermal cycler (Hybaid Ltd, UK). Cycle conditions were as follows: 95°C for five minutes, 57°C for one minute, 72°C for one minute for one cycle, 95°C for one minute, 57°C for one minute, 72°C for one minute for 19 cycles with a final extension of 72°C for five minutes. Electrophoresis and analysis were as above.
DNA SEQUENCING
Minor rearrangements were characterised by sequencing in both directions using the dRhodamine dye terminator sequencing kit according to the manufacturer's instructions (ABI-PE, USA).
DATA AND STATISTICAL ANALYSIS
The area under the peaks was generated by ABI Genescan and Genotyper software and then entered into an Excel spreadsheet (table2). Ratios were determined between each exon and the other four exons in the multiplex set. The mean ratio ±1 SD and ±2 SD of four normal controls were calculated. If the SD of the four normal controls was greater than 0.1 (that is, >10%) as a result of the ratios from one control then that control was omitted and the mean and SDs were recalculated, but if it was the result of more than one control then the analysis of the assay was aborted. Ratios of the test samples were compared against the control mean ratios. Any ratio outside 2 SD was highlighted and ratios outside 1 SD were bracketed. A deletion or a duplication was inferred if the ratio was within the confidence limits determined from the reported deletion or duplication controls. Samples where ratios were found to be outside both normal and major rearrangement confidence limits and samples where a deletion or duplication was identified were retested.
Excel macro sheet of UPQFM-PCR of exons 3, 5, 8, 14, and 17 of LDLR
Results
The UPQFM-PCR consisted of two PCR reactions and the principle is outlined in fig 1. The number of cycles was varied in the P1 reaction. Five to nine cycles of P1 were tried but too little fluorescence was incorporated in the P2 reaction; the minimum was found to be 10. The exponential phase of the P2 reaction was shown to occur up to 25 cycles of amplification (data not shown). The number of cycles in the P2 reaction was chosen as 20 as the products were easily detectable and did not require dilution before loading. Beyond 22 cycles, peak heights approached the upper limit of the linear scale of the ABI detector and peaks began to broaden, preventing the resolution of deletions and duplications as small as 2 bp.
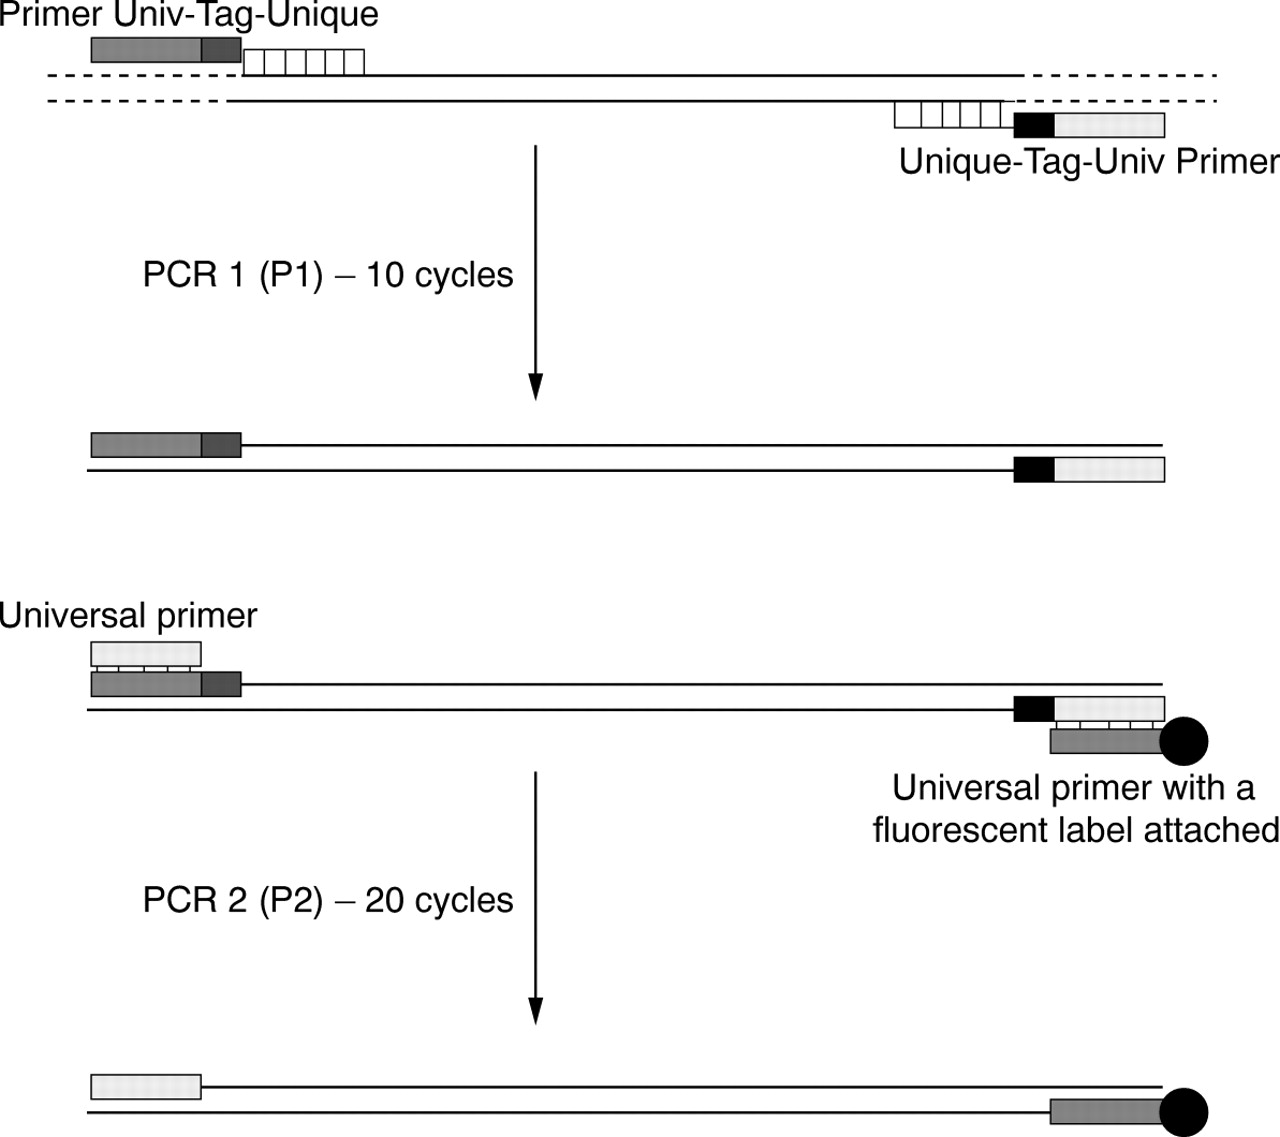
Principle of universal primer quantitative fluorescent multiplex PCR. The first PCR reaction (P1) amplifies the various exons from unique primer sequences tagged to newly designed universal primers with a six base tag in between (relevance described in text) while the second reaction (P2) amplifies the P1 products using the universal primers. One of the universal primers (antisense in this case) was labelled with a fluorescent dye which is incorporated into the PCR products. PCR products are electrophoresed on an ABI DNA 377 sequencer. Ratios of the exon peak areas against each other are determined and these are then compared to ratios obtained for normal and major rearrangement controls.
The UPQFM-PCR assay was tested on 15 known major rearrangements and the results are shown in table 3. Examples of the Genotyper traces of three deletions compared to a normal control are shown in fig 2, where differences in peak heights between normal and deleted exons are clearly visible. Peak areas were used to determine dosage ratios and from these the reduction ratio of the deleted exons or the increased ratio of the duplicated exons was determined (fig 2). The mean reduction in peak area for deleted exons was 46 ± 7% (n=20), while duplicated exons showed a mean increase of 146 ± 5% (n=3). Inter-assay variation was determined by calculating the SD of the ratios of a normal sample against the mean normal ratios for each assay over a number of assays; “healthy” white controls X and Y represent the two extremes. Control X was included in 12 assays. Ratios were determined for the peak areas of exons 3, 5, 8, and 17 compared to exon 14, a total of 48 exon ratios. Four ratios were outside 1 SD by 1-3%. For control Y, 36 exon ratios were determined and a third of their ratios fell outside 1 SD but again only by 1-3%. Thus the majority of ratios lay within 1 SD and all were within 2 SD. Intra-assay variation was tested by analysing one sample repeatedly in one assay. The SD of the peak area ratio of the exons was small, ranging from 0.01 to 0.06 (n=13).
Reported major rearrangements analysed by the UPQFM-PCR assay set

Genotyper traces (A) and Excel macros (B) of the UPQFM-PCR of a normal control and three deletions. (A) Trivial mutation names and the descriptions of the reported major rearrangements are stated. Exon boundaries are shown for each reported deletion and the particular exons deleted are shown in brackets. Peaks are labelled with the exon name and the peak area. Deviations from the normal are marked with an asterisk. (B) Dosage data on four normal controls and three reported deletions. Details of the macro sheet are in the Materials and methods section.
As well as detecting major rearrangements by quantification, the UPQFM-PCR can detect minor rearrangements by accurate sizing. Deletions or insertions of 1 bp were detectable as mobility shifts of individual amplicons (peak splitting since heterozygotes) if 36 cm well to read plates were used (210 minutes). The smallest deletion or insertion detected was 2 bp on the 12 cm well to read plates which were routinely used for speed (70 minutes) and because all samples had been tested for minor deletions or insertions by SSCP analysis. A 4 bp insertion was identified in exon 8 (fig 3), which had been undetected by SSCP using one gel condition. It was characterised to be the result of a duplication, GGGT at nucleotide 1120, which is predicted to cause a frameshift from glycine 353.

Genotyper traces of a normal control (A) and a minor rearrangement of exon 8 (B) detected by UPQFM-PCR. Peaks are labelled with the exon name, the peak size, and the peak area. A 4 bp insertion was identified in exon 8 (marked with an asterisk) which was the result of a duplication, GTGG at 1120.
Two groups of FH patients were screened for majorLDLR rearrangements, 76 adult and 42 paediatric patients from the UK. Three major rearrangements were detected. Patients A and C showed more than one test exon to be deleted or duplicated while patient B showed a duplication of a single test exon (table 4). QFM-PCR, based on the principle used to detect deletions and duplications in the dystrophin gene in patients with DMD,15 was used to define the boundaries of the major rearrangements. Multiplex sets of two or three exons were amplified on the DNA from the patient, four normal controls, and relevant deletion and duplication controls.
LDLR major rearrangements detected in the two UK FH groups
PATIENT A
In patient A, either a duplication of exons 8, 14, and 17 or a deletion of exons 3 and 5 had occurred but because of a lack of DNA no detailed characterisation could be carried out.
PATIENT B
In patient B, UPQFM-PCR showed exon 8 to be duplicated. Characterisation and confirmation of the mutation, by QFM-PCR, showed that exons 8 to 10 were duplicated.
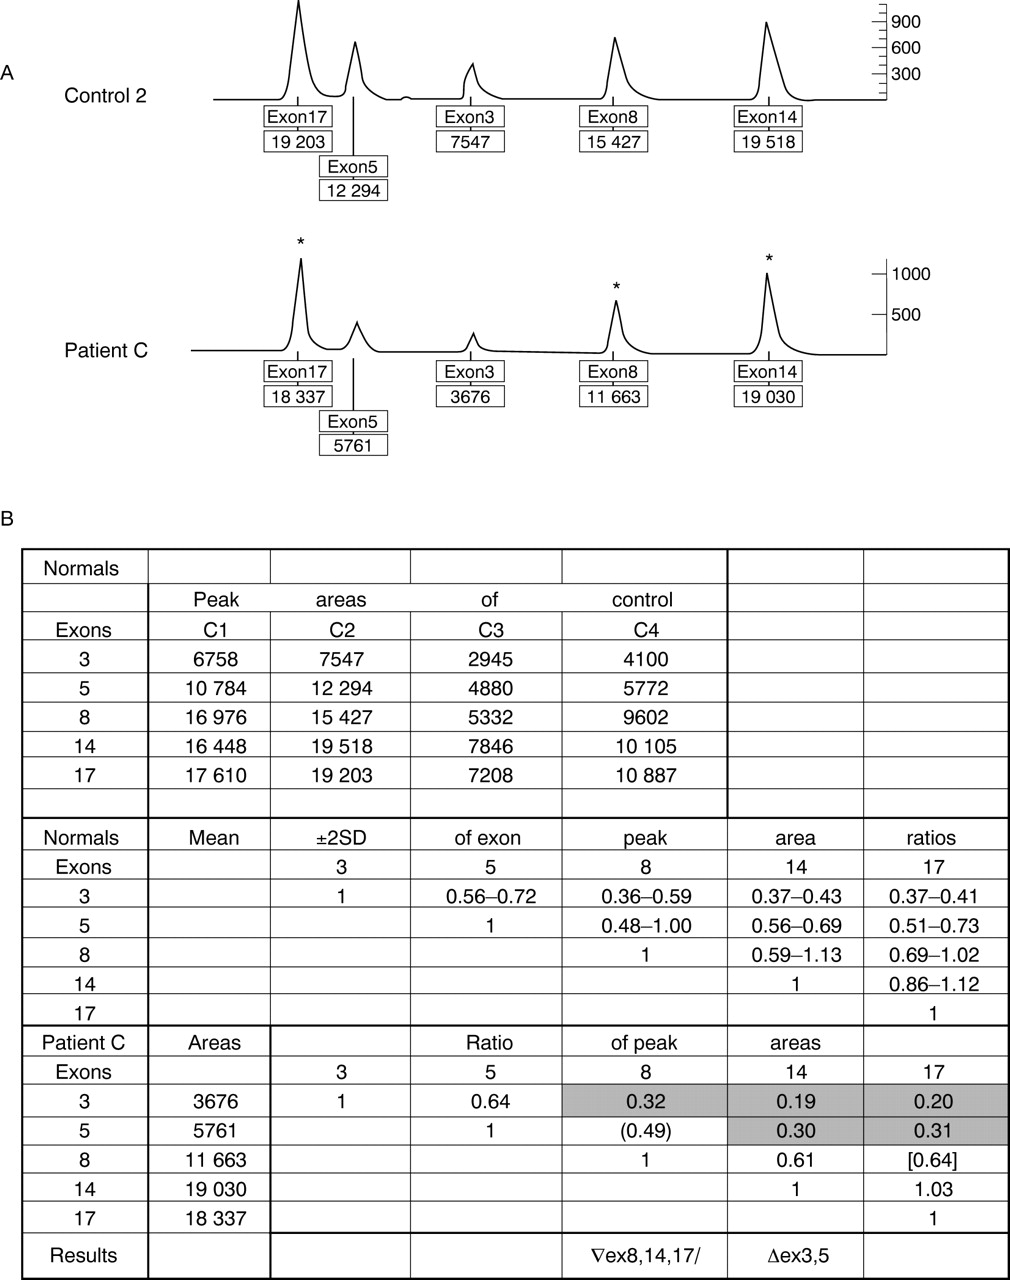
PATIENT C
Patient C had a similar pattern of peak areas to patient A, where either the peak areas for exons 8, 14, and 17 were increased or the peak areas for exons 3 and 5 were reduced (fig 4). Thus, patient C either carried a duplication of at least exons 8-17 or a deletion of at least exons 3-5. Characterisation of this major rearrangement using various QFM-PCR reactions (data not shown) showed that patient C had a duplication encompassing exons 7-18. The duplication is estimated to be over 20 kb, starting in intron 7 and ending in either the 3′ untranslated region of LDLR or downstream from LDLR.

Genotyper traces and Excel macros of a normal control and patient C, detected by UPQFM-PCR. (A) Genotyper traces of LDLR UPQFM-PCR. Peaks are labelled with the exon name and the area. Deviations from the normal are marked with an asterisk. (B) Section of the Excel macro sheet showing four normal controls and patient C. Ratios outside the normal range are shaded and indicate a duplication of exons 8, 14, and 17 or a deletion of exons 3 and 5. Brackets indicate ratios which lie just outside +2 SD but have been shown, by repeated assays, to be in the expected range. ( ) indicate duplicated exon ratios while [ ] indicate normal exon ratios.
Discussion
The UPQFM-PCR is a rapid way of detecting major and minor rearrangements in any gene of interest. The method only requires small quantities of starting material which is then amplified, resolved by electrophoresis, and quantified using fluorescence.
The P1 PCR is expected to have enhanced specificity and efficiency, conferred by the tagged primers owing to the normalisation of the hybridisation kinetics. Even if this is not completely the case and the efficiency ratios for all amplicons in the reaction are not in unity and are still dependent on size and primer annealing efficiency, the number of cycles is greatly reduced to limit this problem. One set of primers amplify all the multiplex exons in the P2 reaction, so all exons should theoretically amplify consistently.
There are two major problems of quantitative multiplex PCR, inter- and intra-assay variation. Inter-assay variation has only been found to occur because of the incorrect concentration, poor purity, and the level of degradation of the DNA sample, which was also encountered by Chamberlain et al 16 and Yauet al.15 DNA must be diluted to a constant concentration of 25 mg/ml. Lower concentrations either gave an accurate result or completely failed to amplify, but concentrations above this level produced abnormal peak patterns which virtually always resulted in the calling of an apparent non-contiguous deletion or duplication. Before tests were repeated, the concentration was remeasured and a fresh dilution was made and this generally corrected the problem. A few samples continually failed to give an informative result and these were generally a result of the poor purity of the DNA. Reprecipitation was found to eliminate most of the problems. The inter-assay variation was also minimised by ensuring the PCR reagents were accurately made and dispensed. Variation was still observed, in particular when a new batch of buffer was used or when a new primer aliquot was added, despite being diluted as a large batch. Confidence limits (±2 SD) for normal and deleted or duplicated exons still showed some overlap, but criteria for detecting the major rearrangements were set, and normal, deletion, and duplication controls were always used to validate each assay. Over 250 samples from a heterogeneous population have been analysed with this multiplex set and no rare variants were found in the nucleotides of the primer sequences, which could lead to a false positive result. To overcome this potential problem, on samples where a single exon appears deleted, verification should be carried out using another method as practised with the DMD assay. In this case, QFM-PCR could be used as the primers are at different sites. If these criteria are adhered to then this method should provide a means of detecting major rearrangements in any gene.
Additionally, to detect major rearrangements, deletions and insertions of greater than 1 bp were detected using UPQFM-PCR. A 4 bp insertion was identified in exon 8 of a patient which was characterised as a duplication, GGGT, at nucleotide 1120.2 It is predicted to result in a frameshift from codon 353 and has been observed in many FH patients (FH website), and is thus predicted to be the pathogenic cause of FH in this patient. Although mutation detection methods such as SSCP and DGGE, followed by sequencing, can detect this class of mutation, this method can be used to confirm the number of nucleotides involved.
From data available on the FH website the proportion of reportedLDLR gene rearrangements that would be detectable by this one multiplex assay was estimated to be 86% with only two regions not being covered. Deletions of the 5′ flanking region to intron 1 or 2 have been observed to be deleted in several patients and one particular mutation occurs at a high frequency, 60%, owing to a founder gene effect in the French-Canadian population of Quebec (FH French Canadian-1).25 The otherLDLR region where rearrangements would be missed is exon 15 which is deleted in the Japanese (FH Tonami)26 and the Finnish (FH Espoo)27populations. For these populations a specific UPQFM-PCR assay could be designed to encompass the regions deleted.
Using this method to screen LDLR, three major rearrangements were found in the two FH groups studied and they are predicted to be the pathogenic cause of the FH phenotype.
PATIENT A
LDLR mutation in patient A was identified by UPQFM-PCR to be either a deletion of at least exons 3 and 5 or a duplication of at least exons 8 to 17 but owing to a lack of DNA it was not fully characterised. Many reported deletions have started in the 5′ flanking region and have ranged in size from 6 kb to over 25 kb, ending in introns 1 to 6 (FH website). If the rearrangement in patient A is a >25 kb deletion it may be similar to the deletions described in two patients, one from England5 and the other from Bologna, Italy (FH Bologna-1).28 These two deletions encompass the 5′ flanking region to intron 6 but have different 5′ breakpoints. Further work would be required to deduce the effect of the mutation at the protein level. LDLRrearrangements have been shown often to be in frame, thus the two exons around the breakpoints are spliced together during RNA processing and translation of this mRNA would occur and produce a smaller or larger receptor protein.29-31 If it were a deletion, this may be the case. If it were a duplication, it may or may not include exon 18 and a portion of or the complete 3′UTR so a larger receptor may be produced, although the mRNA may be very unstable.
PATIENT B
The mutation in patient B was a duplication which spans from intron 7 to 10 and is therefore 2.6-5.6 kb depending on the exact intronic breakpoints. This duplication may have occurred because of misalignment of two Alu repeats in intron 7 and intron 10 of the twoLDLR. No such duplication has been described to date and the rearrangements described previously have generally involved breakpoints in different introns. The duplication is predicted to be pathogenic as it results in a shift in the reading frame. The G at nucleotide 1586 (exon 10) is spliced to A at 1061 (exon 8) causing codon 333 to change from GAT (Asp) to GGA (Gly). A termination codon is found three amino acids downstream, thus resulting in the truncation of the protein.
PATIENT C
The rearrangement in patient C showed similar ratios to that of patient A, indicating either a deletion of exons 3-5 or a duplication of exons 8-17. The mutation was found to be a duplication of exons 7-18. This previously undescribed duplication spans at least 20 kb from intron 6 to the 3′UTR and may be larger. A proposed mechanism would be the misalignment of Alu sequences resulting in unequal crossing over. The mutation is predicted to be pathogenic for the same reason as described for the duplication possiblity in patient A.
In the adult group (n=76) one major rearrangement had been previously detected5 and one new rearrangement was detected by this multiplex set and they accounted for a total of 2.6% of mutations (4 bp duplication excluded). In the paediatric group (n=42) the frequency of major rearrangements was 4.3% and no minor rearrangements were identified. Therefore the frequency of major rearrangements was similar to that previously reported.3 4
With regard to the future of this technique, the UPQFM-PCR is an effective method of detecting major and minor rearrangements and could be applied to any gene where deletions or duplications account for a significant proportion of mutations, for example, the steroid sulphatase (STS) gene in subjects with ichthyosis,32 the proteolipid protein (PLP) gene in subjects with Pelizaeus-Merzbacher disease,33 the growth hormone 1 (GH1) gene in subjects with familial growth hormone deficiency,34 and the ornithine transcarbamylase (OTC) gene in subjects with OTC deficiency.35 Plans for future development include an external control to this set which would distinguish deletions from duplications, especially when the rearrangement extends either from the promoter or to the last exon or if the entire gene was deleted or duplicated. It would also be useful to design a second assay to include areas not covered at present. The aim would be to develop a GC rich panel of amplicons so that the promoter, exon 1, and 2 can be amplified with an exon at the opposite end of the gene, possibly exon 15, plus an unlinked locus.
Owing to the wide confidence intervals of peak area ratios, the assay described here cannot be used as the only test forLDLR rearrangements, but can be used as a scanning technique which should point to the small percentage (<5%) of FH patients with major deletions or duplications. Deletions and duplications found can then be confirmed by another technique such as breakpoint PCR, long PCR, or small QFM-PCR sets. UPQFM-PCR is less laborious and time consuming than Southern blotting analysis and allows analysis to be carried out on samples where there is little DNA. The UPQFM-PCR approach should have a generality for set up and primary scanning for major rearrangements in any gene.
Acknowledgments
We thank Dr Mary Seed, Dr Philip Lee, and Professor James Leonard for the patient samples, Professor Stefano Bertolini, Dr Henrik Jensen, and Dr Anne Soutar for supplying DNA controls, and Dr Stephen Scharf for his advice on multiplex PCR. Karen Heath is a PhD student sponsored by the John Pinto Foundation, Professors Ian Day and Steve Humphries are recipients of British Heart Foundation grants (RG95007 and RG93008).
References
Footnotes
-
↵* Present address: Wessex Human Genetics Institute, Duthie Building (808), Southampton University Hospitals NHS Trust, Tremona Road, Southampton SO16 6YD, UK