Article Text

Abstract
Background Granulomatosis with polyangiitis (Wegener's) (GPA) and microscopic polyangiitis (MPA) are subgroups of anti-neutrophil cytoplasmic antibody (ANCA)-associated vasculitis (AAV) defined historically by clinical and histological features. GPA and MPA are heterogeneous entities with overlapping phenotypes. To identify novel subgroupings, cluster analysis was used to explore the phenotypic spectrum of AAV.
Methods This study used a dataset of patients newly diagnosed as having GPA and MPA enrolled in five clinical trials. One cluster model included nine clinical baseline variables as input variables, and a second cluster model additionally included ANCA specificities. The clustering process involved multiple correspondence analyses followed by hierarchical ascendant cluster analysis. The clinical relevance of the generated clusters was analysed by their summary characteristics and outcomes.
Results The analyses involved data for 673 subjects: 396 (59%) with GPA and 277 (41%) with MPA. Both cluster models resulted in five partially redundant clusters of subjects, and the model including ANCA resulted in more pertinent separations. These clusters were named ‘renal AAV with proteinase 3 (PR3)-ANCA’ (40% of subjects), ‘renal AAV without PR3-ANCA’ (32%) and ‘non-renal AAV’ (12%), ‘cardiovascular AAV’ (9%) and ‘gastrointestinal AAV’ (7%). The five clusters had distinct death and relapse rates. On the basis of 4 variables, 651 subjects (97%) could be accurately allocated to 1 of the 5 classes.
Conclusions This analysis suggests that AAV encompasses five classes associated with different outcomes. As compared with the traditional GPA–MPA separation, this classification system may better reflect the phenotypic spectrum of AAV.
Statistics from Altmetric.com
Introduction
Granulomatosis with polyangiitis (Wegener's) (GPA)1 and microscopic polyangiitis (MPA) are systemic small-vessel vasculitides associated with anti-neutrophil cytoplasmic antibodies (ANCA), pauci-immune crescentic glomerulonephritis, alveolar haemorrhage, purpura, peripheral neuropathy and eye inflammation.2 In addition, GPA has pathological features of extravascular granulomatosis manifested by ear, nose and throat (ENT) disease and pulmonary nodules. Although GPA is associated with ANCA specific for anti-proteinase 3 antibodies (PR3-ANCA) and MPA with ANCA specific for anti-myeloperoxidase antibodies (MPO-ANCA), these are not exclusive associations and there is substantial overlap in the expression of these two diseases.
Because of their overlapping features, GPA and MPA have been increasingly combined under the term ‘ANCA-associated vasculitis’ (AAV),2 which implies that they may be variants of a single disease process. Thus, it is not clear if the dual GPA–MPA classification accurately represents all phenotypic profiles encompassed by AAV. GPA itself is a heterogeneous entity, as highlighted by cases localised to the ENT tract or lung, which have a more favourable outcome than the generalised presentations with renal involvement.3 ,4 In clinical trials, this situation has led to dividing GPA into further subtypes,5 but no uniform approach to subcategorise GPA exists, and how this approach should be reconciled with the broader concept of AAV remains unclear.
Cluster analysis refers to statistical methods of data partitioning whereby objects or individuals are grouped into homogeneous groups on the basis of similarity.6 ,7 In medical research, cluster analysis has been used to identify phenotypic groups within various diseases.8 Because cluster analysis might increase our understanding of the relationships between GPA and MPA, we undertook a cluster analysis to revisit AAV subgroupings using a data-driven and unpreconceived approach.
Patients and methods
Patients
This study used data from five prospective, randomised clinical trials conducted by the European Vasculitis Study Group (EUVAS)9–12 and the French Vasculitis Study Group (FVSG).13 The trials enrolled patients newly diagnosed as having GPA and MPA between 1995 and 2003. The EUVAS trials recruited patients from 15 European countries (plus Mexico), and the FVSG trial included patients from France and Belgium.9–13
GPA and MPA diagnoses employed widely accepted definitions or classification criteria.2 ,14 The trials addressed patients with ‘early systemic’,10 ‘generalised’,11 ‘generalised renal’,9 ‘severe renal’12 and ‘systemic’ AAV13 (supplementary table S1). All patients received glucocorticoids and cytotoxic agents (cyclophosphamide, azathioprine, or methotrexate). Trial durations were 1212 to 18 months9 ,10 ,15 or until a common close-out date defined by the last randomised patient stopping the study medication.13 For the EUVAS trials, extended follow-up data were collected from 87% of enrolled subjects between 2004–2007 for the main outcomes (eg, death, relapse, dialysis, comorbidities) and further treatment received; the extended follow-up data have been used for a variety of analyses, including for outcome studies.16–18 The FVSG trial reported on patients who had achieved remission after induction treatment with cyclophosphamide but we also included data on patients excluded from the trial because they did not achieve remission.13
Clinical variables
Data from the five trials were merged in a single dataset. We used data for patients with complete data for all relevant variables for this study. A total of 11 characteristics at trial entry were used as input variables: renal, lung, ENT, eye, skin, neurological, cardiovascular (CV) and gastrointestinal (GI) disease, sex, and ANCA status and type (PR3-ANCA or MPO-ANCA). These variables refer to the principal organ systems affected by GPA or MPA, and sex and ANCA serology were selected because of their putative phenotypic effect in AAV. All cluster analyses were based on two models. Model 1 included the nine clinical input variables, and model 2 additionally included the biological variables PR3-ANCA and MPO-ANCA. Input variables were coded as present or absent. Data for the rare subjects with double PR3-ANCA and MPO-ANCA positivity were analysed by positivity for both specificities.
Age, Birmingham Vasculitis Activity Score (BVAS),19 and serum creatinine at trial entry, as well as the occurrence of relapse and/or death, were used to describe the study population and the identified clusters.
Cluster analysis methodology
We performed multiple correspondence analysis (MCA) and considered the coordinates of the observations on the retained factorial axes as new variables used for the cluster analysis. The first k axes, which explained at least 90% of the total variability, were considered, and the remaining axes were discarded.20
To build homogeneous clusters of patients, we performed agglomerative hierarchical clustering based on the Ward method followed by consolidation (K-means algorithm). The agglomerative clustering technique starts with every case considered a cluster itself and successive two-by-two merging of clusters until the final merge with all subjects falling into a single category. The metric used to assess the proximity between two classes was the Euclidian distance, the most commonly used measure of (dis)similarity.21 The clustering process can be plotted as a dendrogram, with horizontal branches representing the combination of two clusters and vertical branches the degree of dissimilarity between combined clusters; long distances of the vertical segments indicate large differences between the formed clusters.
Two distinct approaches were used for estimating the optimal number of clusters within the studied population. First, we used a visual distance criterion by cutting the dendrogram horizontally at the level of highest dissimilarity (ie, where the vertical branches were the longest). In addition, we checked the gain in within-cluster inertia achieved at each clustering step. A gain at Q clusters that was greater than at Q-1 clusters suggests a division in Q clusters.22
Clinical validation
The clusters resulting from the grouping process were described and named by their most prominent summary characteristics. In addition to the 11 primary variables of the clusters, other phenotypic characteristics (age, BVAS, serum creatinine, clinical trial, relapse and death rates) are presented in summary form.
Survival and relapse analyses were performed to test whether the classes had prognostic value and to describe the overall population and GPA and MPA diagnoses. Overall and relapse-free survival times were calculated from the date of trial inclusion to the date of death and first relapse, respectively, or to the date of last contact. For the analyses of relapse incidence, competing risk analyses were performed to account for death occurring before relapse. Relapse and survival rates were compared as described by Fine and Gray23 and by Cox proportional hazards models,24 respectively. Assumptions of proportional hazards were assessed by testing for statistical significance of an interaction between treatment and the log of time as included in the two survival regression models.
Classification tree analyses
To test how accurately class membership could be predicted, we manually constructed classification trees based on the most discriminant characteristics of the obtained classes. Classification trees were created for the classes obtained with both cluster analysis models and the clinical diagnoses of GPA and MPA were based on the 11 input variables used for the clustering analyses. Predictive accuracy and model parsimony were both taken into account in selecting the best classification trees. The predictive accuracies of the algorithms were expressed as the observed number (%) of individuals allocated to the predicted classes. The selection of the most discriminant predictor variables was crosschecked against those used in statistically computed classification trees.25 For the manually created trees, each predictor variable was allowed to contribute only once to the algorithm.
Reproducibility of the classification
Two sensitivity analyses were performed to evaluate the stability of the findings. First, the cluster algorithm was repeated five times by excluding data from one trial at a time. Second, to demonstrate repeatability, we performed 1000 iterations of the clustering process in randomly selected subsets set to 50% of the entire dataset.26 In both sensitivity analyses, MCA and then hierarchical cluster analysis were performed with the same parameter settings as in the primary analyses, except that the optimal number of clusters was specified as five. The results of both sensitivity analyses were expressed as the number (%) and mean number (%), respectively, of individuals not classified in the same classes as those defined in the primary analyses.
Statistical computations
All statistical analyses involved use of SAS V.8.2 (SAS Institute, Cary, North Carolina, USA) or R 2.13.2 (R Foundation for Statistical Computing, Vienna, Austria). A two-tailed p≤0.05 was considered statistically significant.
Results
Patient population and GPA–MPA characteristics
The dataset included 715 patients; for 42 (5.9%), data were missing for at least 1 variable. Data for 673 (94.1%) patients, including 396 (58.8%) with GPA and 277 (41.2%) with MPA, were used for the analyses.
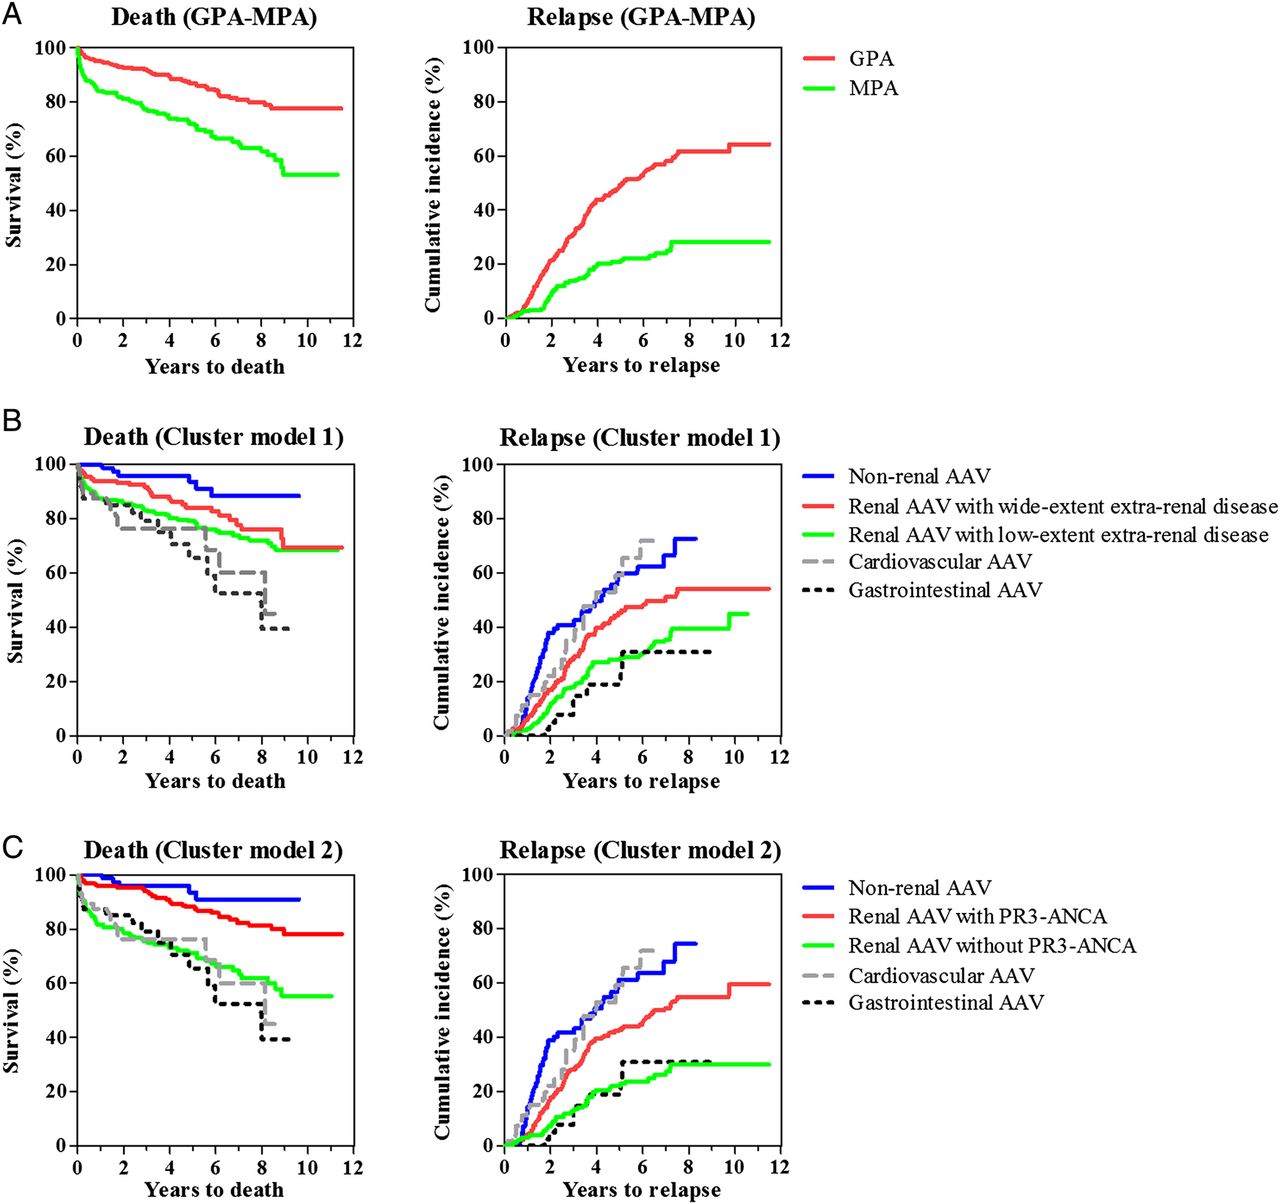
Table 1 shows the main characteristics for the overall study population and patients with GPA and MPA separately. Mean (SD) follow-up was 4.45 (3.03) years and overall 5-year and 10-year survival rates were 80.9% (95% CI 77.6 to 84.3) and 67.8% (62.4 to 73.7), respectively. Patients with MPA exhibited higher mortality (hazard ratio (HR) 2.44, 95% CI 1.73 to 3.43) and lower relapse incidence (subdistribution HR 0.35, 0.26 to 0.48) than those with GPA (both p < 0.0001) (table 2, figure 1A).
Baseline phenotypic characteristics and follow-up data of 673 patients with anti-neutrophil cytoplasmic antibody (ANCA) associated vasculitis (AAV), within subgroups with GPA and MPA and within each cluster generated by cluster model 2 including nine clinical variables plus PR3-ANCA and MPO-ANCA positivity as input variables
HR of death and subdistribution HR (SHR) of relapse in patients with AAV stratified by clinical diagnosis and across subgroups identified by cluster analyses

Dendrograms for two cluster models for anti-neutrophil cytoplasmic antibody (ANCA)-associated vasculitis. The full dendrogram displays the progressive clustering of subjects. The bold horizontal line marks the level of truncation, thus resulting in five groups. The two models represent a clustering process with nine clinical baseline variables (cluster model 1) and additional information on presence and specificity of anti-neutrophil cytoplasmic antibody (cluster model 2). This figure is only reproduced in colour in the online version.
The classification tree with the best differentiation between GPA and MPA diagnoses was constructed with four variables: ENT, lung and eye disease, and PR3-ANCA positivity. This algorithm resulted in 572 (85.0%) patients being assigned to the predicted category (supplementary figure S1).
MCA and selection of classification models
For models 1 and 2, MCA retained the first eight and nine axes, respectively, which explained 93% and 92% of the total variability. Hierarchical clustering analysis suggested a five-class solution for both models (figure 2): two classes accounting for almost two-thirds of patients and three classes with fewer patients.

Plots of mortality and cumulative incidence of relapse for granulomatosis with polyangiitis (Wegener's) and microscopic polyangiitis (A), cluster model 1 (B) and cluster model 2 (C).
Comparisons of the class memberships indicated that the three classes with the fewest patients were almost identical for both models. These three classes were characterised by GI disease (100% of subjects), CV disease (100% of subjects among those without GI disease) and lack of renal disease (0% of subjects among those without gastrointestinal or CV disease) (table 1 and supplementary table S2). The three classes were thus named ‘GI’, ‘CV’ and ‘non-renal AAV’.
The two cluster models showed different classifications for the two classes with the most patients, with virtually constant renal disease. In model 1, both classes differed in that one class had lower frequencies of ENT, skin and eye disease and neuropathy. These two classes were named ‘renal AAV with low-extent extra-renal disease’ and ‘renal AAV with wide-extent extra-renal disease’ (supplementary table S2). In model 2, the two classes were best characterised by PR3-ANCA positivity (94.4% of patients) and virtually no PR3-ANCA positivity (2.4% of subjects) (table 1). For this latter model, the two classes were named ‘renal AAV with PR3-ANCA’ and ‘renal AAV without PR3-ANCA’. In this categorisation, the patients with dual positivity for PR3-ANCA and MPO-ANCA were assigned to the PR3-ANCA group because this increased the discernibility of the two groups.
For model 1, a classification algorithm that divided all subjects on the basis of 6 variables (renal, GI, CV and skin disease; neuropathy; and ENT disease) correctly assigned 652 patients (96.9%) to the 5 categories (supplementary figure S2). For model 2, a classification tree with 4 variables (GI, CV and renal disease and PR3-ANCA serology) correctly assigned 651 patients (96.7%) (figure 3).

Algorithm of assignment of 673 patients with anti-neutrophil cytoplasmic antibody (ANCA)-associated vasculitis to predicted classes derived by cluster analysis including the ANCA pattern for the cluster formation (cluster model 2). The algorithm was based on four variables derived from decision tree analysis and implemented in a hierarchical order (Does the patient have gastrointestinal disease? If not, does the patient have cardiovascular disease? If not, does the patient have renal disease? If yes, does the patient have proteinase 3 (PR3)-ANCA?). The numbers in parentheses refer to patients assigned to the incorrect classes. Overall correct classification rate was 651/673 patients (96.7%). CV, cardiovascular; GI, gastrointestinal.
CV and GI manifestations
Because these symptoms are uncommon, we investigated CV and GI disease in more detail. Details regarding CV manifestations were available for 40/64 (62.5%) patients: pericarditis (n=17), congestive cardiac failure (n=13), bruits (n=6), myocardial infarction or angina (n=4), pericardial pain or rub (n=4), ischaemic cardiac pain (n=3), cardiomyopathy (n=1) and/or new loss of pulses with threatened loss of limb (n=1). Details regarding GI manifestations were available for 23/49 patients (46.9%): bloody diarrhoea (n=10), severe abdominal pain (n=8), surgical abdomen (n=5), acute pancreatitis (n=4) and/or gut perforation/infarction (n=2). All of these symptoms were deemed to be caused by AAV.
Outcome analyses
Both clustering models determined groups with distinct death and relapse rates (table 2, figure 1B,C). For both models, the non-renal AAV class had the lowest death and highest relapse rates and was chosen as the reference group. The main difference between the two cluster models concerned the two largest classes characterised by renal disease. Cluster model two achieved a more marked separation between these two groups, which were characterised by lower death and higher relapse risk for renal AAV with PR3-ANCA as compared with renal AAV without PR3-ANCA. Similar risk profiles were obtained for models 1 and 2 after adjustment for age at diagnosis (results not shown).
Validation analyses
The five leave-one-trial-out analyses reproduced the same classifications with no case misclassified (in three analyses) or with only one or five cases (each in one analysis) assigned to a different group than in the primary analyses. The cluster structures described for each population were also replicable when repeating the algorithm within randomly selected 50% subsets of the entire dataset. The 1000 iterations resulted in an average rate of 0.53% misclassified subjects as compared with the primary analyses.
Discussion
The results of this study, re-evaluating the subcategorisation of AAV through cluster analysis, suggest it is appropriate to consider splitting AAV into more than the usual two subgroups. The two cluster models, which differed by inclusion or exclusion of ANCA specificity for the cluster formation, resulted in five classes, with three classes (non-renal, GI and CV AAV) being identical in both models. The two remaining classes, of patients with renal involvement, differed between the two models, with separations into PR3-ANCA-positive and PR3-ANCA-negative disease or, for the model that did not use ANCA specificity as an input characteristic, into more or less extensive extra-renal symptoms. Classification in one of the five subgroups could be achieved with high accuracy and a simpler classification algorithm with the model including ANCA specificity. These findings challenge the view of GPA and MPA as AAV core diagnostic discriminators and suggest an innovative and potentially more accurate classification system.
We chose hierarchical clustering among the wide range of cluster analyses because it is appropriate for relatively small datasets and does not require assumptions about the number of clusters included in the dataset.7 Use of MCA before cluster analysis needs to be understood as a step of data reduction that summarises the relationships among categorical variables. By retaining only the part of the information that explains most of the variability, this approach reduces the risk of cluster analyses unduly attributing much weight to outlying variables.20 While cluster analysis is a powerful exploratory technique, its results must be considered within the context of the selected input variables and the requirement of an adequate ratio between the sample size and the number of variables to be modelled.
The three largest classes generated by model 2 (non-renal AAV and renal AAV with and without PR3-ANCA) agree with previous suggestions of AAV partitioning, which allowed us to choose this model as the clinically most relevant one. The division of AAV according to renal involvement is compelling in light of the phenotypic and prognostic influence of renal involvement in GPA27–30 and MPA.29 Separation based on ANCA pattern is meaningful because PR3-ANCA and MPO-ANCA commonly overlie clinical diagnoses of GPA and MPA. Because the non-renal AAV group predominantly consisted of patients diagnosed as having GPA, the findings of this cluster analysis might be viewed as merely a slight modification of the traditional GPA–MPA separation by further stratifying GPA by renal involvement. However, the new categorisation introduces additional alterations, such as, allowing for incorporating the MPA phenotype of AAV in the non-renal class and a more stringent classification based on ANCA pattern rather than on clinical variables. The negatively defined group with renal AAV without PR3-ANCA must be understood as renal AAV with mainly MPO-ANCA or negative ANCA.
The subgroups characterised by GI and CV disease were unexpected findings. Although the frequencies with which these manifestations occur in AAV are not well documented,31 ,32 GI and CV disease are rare, and the possibility that these uncommon symptoms highly affect the cluster formation cannot be excluded. In contrast, studies of MPA,33 GPA,34 and MPA and GPA combined with other forms of vasculitis35 ,36 revealed GI33 ,35 ,36 and CV manifestations33–35 as predictors of increased mortality. These findings agree with the high death rates associated with both groups and indicate that these clusters may truly denote distinct phenotypic entities within AAV. The prevalence of GI and CV manifestations was three to four times higher in one clinical trial population than in the patients enrolled in the four remaining clinical trials composing this dataset (supplementary table S1). This observation could mirror that this particular trial, which mainly involved internal medicine centres, recruited different patterns of patients with AAV than the remaining trials essentially involving rheumatologists and nephrologists.
Our results reinforce the concept of AAV as a phenotypic continuum. The classes formed by either model consisted of various mixes of patients diagnosed as having GPA or MPA and were virtually indistinguishable by most clinical criteria. In line with previous observations of GPA,27 ,30 ,34 ,37 the clusters replicate the intimate relationships between age at diagnosis, ENT disease and impaired renal function, with the mean ages and creatinine levels of patient classes varying in opposite direction to the proportion of subjects with ENT disease. With the exception of CV AAV, which had high relapse and death rates, the outcome profiles ranged from low death–high relapse risk to high death–low relapse risk. In GPA, granulomatous and vasculitic processes may account for partly distinct clinical manifestations27 ,30 ,38 and the observed range of AAV phenotypes might reflect various granulomatous and vasculitic burdens.
The retained categorisation system substantially streamlines the classification of AAV. A hierarchical ordered assessment of four clinical variables allowed for unambiguous class assignments to the predicted clusters (figure 3). Thus, the substantial misassignment rate in the classification tree constructed to differentiate GPA from MPA may have been flawed by the lack of use of radiological and histological criteria in this analysis. However, features such as lung nodules or granulomatosis are unlikely to improve classification as compared with unequivocal stratification based on ANCA specificity as highlighted by the challenge of classifying cases with subtle lung nodules and the inconsistency of histologically documented granulomatosis in clinical practice.
This study involved a large dataset of 673 patients newly diagnosed as having AAV with prospective and prolonged follow-up that were treated with contemporary and, at least initially, protocol therapy. The nature of the patient population, which encompassed AAV of varying severities, was suitable for seeking subtypes. We recognise that localised forms of AAV may have been missed in this series although it seems clinically reasonable to extrapolate that this rare variant could be grouped together with other forms of non-renal AAV. A further strength of this study is that its findings were robust to sensitivity analyses, which notably indicated that the results were not primarily driven by any one of the trials.
Study limitations include the lack of more detailed clinical information, which precluded analysing the impact of features such as alveolar haemorrhage on the formation of clusters, and providing a thorough clinical characterisation of GI and CV disease for all patients who presented such manifestations. Outcome analyses must be interpreted by keeping in mind that they might have been confounded by non-uniform between-trial and within-trial treatments. These data also leave unanswered how Churg–Strauss syndrome might be incorporated in this spectrum. Despite shared features of pauci-immune glomerulonephritis and positive MPO-ANCA, Churg–Strauss syndrome has distinct features related to atopy and eosinophilia that suggest that it is a clinically and pathogenetically distinct condition.
In conclusion, this study reinforces the concept of AAV while suggesting a categorisation based on renal disease and ANCA specificity, and perhaps also GI and CV disease. These results may lead to more accurate stratification of patients into homogeneous disease groups for therapeutic, epidemiological and basic research. The prognostic and the aetiological relevance of this AAV partitioning require further validation.
References
Supplementary materials
Supplementary Data
This web only file has been produced by the BMJ Publishing Group from an electronic file supplied by the author(s) and has not been edited for content.
Files in this Data Supplement:
- Data supplement 1 - Online supplement
Footnotes
-
Contributors AM and SK designed the study and wrote the analysis plan. AM, LG, ECH, PH, CP, NR, KW and DRWJ collected the data. SK and HV analysed the data. AM, SK, HV, PAM, KW and DRWJ interpreted the results and were involved in the writing of the manuscript.
-
Funding source None.
-
Competing interests None.
-
Patient consent Obtained.
-
Ethics approval Local Ethics Committees/IRBs at individual study sites.
-
Provenance and peer review Not commissioned; externally peer reviewed.