Article Text

Abstract
Background Fabry disease is characterised by the progressive accumulation of globotriaosylceramide (Gb3) and related glycosphingolipids in vascular endothelial cells. Enzyme replacement therapy (ERT) clears this accumulation. We analysed plasma proteome profiles before and after ERT to characterise its molecular pathology.
Methods Two-dimensional electrophoresis and matrix-assisted laser desorption/ionisation-time of flight tandem mass spectrometry (MALDI-TOF MS) and tandem mass spectrometry (MS/MS) were done using plasma samples before and after ERT in eight patients with classical Fabry disease
Results After short-term ERT (4–12 months), the levels of 15 plasma proteins involved in inflammation, oxidative and ischaemic injury, or complement activation were reduced significantly. Among them, β-actin (ACTB), inactivated complement C3b (iC3b), and C4B were elevated significantly in pre-ERT Fabry disease plasma compared with control plasma. After longer-term ERT (46–96 months), iC3b levels gradually decreased, whereas the levels of other proteins varied. The gradual reduction of iC3b was comparable to that of Gb3 levels. In addition, iC3b increased significantly in pre-ERT Fabry disease mouse plasma, and C3 deposits were notable in renal tissues of pre-enzyme replacement therapy patients.
Conclusion These results indicated that C3-mediated complement activation might be altered in Fabry disease and ERT might promote its stabilisation.
- Beta-actin
- Biomarker
- Complement
- C3
- Fabry disease
This is an Open Access article distributed in accordance with the Creative Commons Attribution Non Commercial (CC BY-NC 4.0) license, which permits others to distribute, remix, adapt, build upon this work non-commercially, and license their derivative works on different terms, provided the original work is properly cited and the use is non-commercial. See: http://creativecommons.org/licenses/by-nc/4.0/
Statistics from Altmetric.com
Introduction
Fabry disease (FD, OMIM #301500) is a rare X-linked lysosomal storage disease caused by a deficiency in α-galactosidase A (α-Gal, EC 3.2.1.22).1 α-GAL liberates galactose from globotriaosylceramide (Gb3) and related glycosphingolipids. α-GAL deficiency leads to the progressive accumulation of these substrates, which is associated with inflammation and other related but elusive injuries in vascular endothelial and inflammatory cells, resulting in the vasculopathy that characterises FD.2–4 Consequently, life-threatening complications, including hypertrophic cardiomyopathy, chronic renal failure and cerebral vascular events, develop in male FD patients in their second to fifth decades of life.1
The introduction of enzyme replacement therapy (ERT) in 2001 was based on clinical trials that indicated the safety and efficacy of ERT to clear the accumulated substrates and improve the clinical manifestations of the disease.5–9 To assess the effectiveness of ERT, efforts were made to develop a biomarker that could indicate disease progression and ERT efficacy. To date, Gb3 and its deacylated derivative, lyso-Gb3, have been used as the most useful diagnostic biomarkers. These metabolites are elevated in affected males and heterozygotes before ERT.10 11 However, wide variations in plasma levels of these metabolites have been noted among FD patients, and the metabolite levels correlate poorly with disease severity.12 13 Additionally, although Gb3 or lyso-Gb3 show concordant reductions during ERT over the short term, they are less faithful biomarkers of disease activity over the long term.12 13
Previous studies were performed to find new biomarkers in the plasma of FD patients,14 15 which provided insights into the pathobiology underlying FD, which was observed to involve blood transport and composition, oxidative inflammation, fibrinolysis, and angiogenesis. However, more studies are required to understand the detailed pathogenesis of FD.
Herein, we report the plasma proteome profiles of FD patients over a short period of ERT. We identified plasma proteins that showed differential levels during 4–12 months of ERT. The functional roles of these proteins were then assessed to understand the molecular pathobiology underlying FD. We then assessed the changing levels of these metabolites over a longer period (46–96 months) of ERT, which identified a new biomarker that reflects the long-term effects of ERT on FD.
Methods
Subjects
The clinical findings of eight male FD patients at the time of diagnosis and their clinical courses were reviewed. FD diagnoses were based on the α-GAL activity in peripheral leucocytes and GLA mutational analysis. Plasma was isolated from blood before ERT and then at 3- to 12-month intervals after ERT for plasma Gb3 levels, as described previously.16 To compare the protein levels with those of a gender and age-matched control cohort, plasma samples were drawn from eight unaffected healthy males who were 7, 11, 17, 31, 35, 42, 48, and 48 years old. The institutional review board of the Asan Medical Centre, Seoul, Korea, approved this study and each patient provided written informed consent. Anti-αGAL IgG antibody titres were assessed in plasma samples by enzyme-linked immunoabsorbent assay (ELISA)-bridging format17 and neutralising antibody was measured by analysing the degree of inhibition of substrate metabolism in vitro.
Animals
Four male Fabry, Gla-knockout, C57BL6 mice at 10 weeks of age were studied, which were kindly provided by Dr Roscoe O Brady of the National Institutes of Health (Bethesda, Maryland, USA). All mice were genotyped using PCR. A minimum of three age- and gender-matched mice were included as a control group. The present study was approved by the Institutional Animal Care and Use Committee of the Ewha Womans University School of Medicine (ESM#13–0245). All mice were treated in accordance with the Animal Care Guidelines of the Ewha Womans University School of Medicine, and the National Research Council (US) Guide for the Care and Use of Laboratory Animals.
Two-dimensional electrophoresis (2-DE) and image analysis
To enhance the overall yield of protein spots, six of the most abundant proteins in plasma were removed using a 4.6×50 mm multiple affinity removal column (MARC; Agilent, Wilmington, Delaware, USA). Aliquots in sample buffer (7 M urea, 2 M thiourea, 4.5% CHAPS (3-[(3-cholamidopropyl) dimethylammonio]−1-propanesulfonate), 100 mM dithioerythritol (DTE), 40 mM Tris, pH 8.8) were applied to immobilised non-linear gradient strips at pH 3–10 (Amersham Biosciences, Uppsala, Sweden). The second dimension was analysed on 9–16% linear gradient polyacrylamide gels. The gels were stained with Coomassie Brilliant Blue G-250 and scanned using a GS710 densitometer (Bio-Rad, Hercules, California, USA), converted into electronic files, and analysed using the Image Master Platinum 5.0 image analysis programme (Amersham Biosciences).
Protein identification was achieved using matrix-assisted laser desorption/ionisation-time of flight tandem mass spectrometry (MALDI-TOF MS) and tandem mass spectrometry (MS/MS). Protein spots were excised from gels using a sterile scalpel, and digested using trypsin (Promega, Madison, Wisconsin, USA), as previously described.18 Tryptic peptides were concentrated with a POROS R2, Oligo R3 column (Applied Biosystems, Foster City, California, USA) and eluted with cyano-4-hydroxycinnamic acid (CHCA; Sigma, St Louis, Missouri, USA).19 Mass spectra were acquired on a 4800 Proteomics Analyzer (Applied Biosystems) that was operated in MS and MS/MS modes. Peptides were fragmented in MS/MS mode by collision-induced dissociation (CID) using atmospheric air as a collision gas. The instrument was operated in reflectron mode and calibrated using the 4700 calibration mixture (Applied Biosystems). Additionally, each sample spectrum was also calibrated using trypsin autolysis peaks. For the MS analysis, an 800–4000 m/z mass range was used with 1000 shots per spectrum. A maximum of 15 precursors with a minimum signal-to-noise ratio (S/N) of 50 were selected for MS/MS analysis. A collision energy of 1 kV was used for CID, and 2000 acquisitions were accumulated for each MS/MS spectrum. Peptide mass fingerprinting was carried out using the Mascot search engine, which is included in the GPS Explorer software, and the mass spectra used for manual de novo sequencing were annotated with Data Explorer software (Applied Biosystems).
Mascot database search
The mascot algorithm (Matrixscience) was used to identify peptide sequences. Database search criteria were as follows: taxonomy; Homo sapiens (NCBInr database downloaded on 26 March 2010), fixed modification; carbamidomethylated (+57) at cysteine residues; variable modification; and oxidised (+16) at methionine residues, maximum allowed missed cleavage, 1. Mass tolerances of 100 ppm and 0.2 Da were used for precursor and fragment ions, respectively. Only those peptides that resulted from trypsin digests were considered.
Western blotting
The primary antibodies used included those recognising complement C4B (C4B; ab66791), C3b (ab181147, ab200999), C1q subcomponent subunit C (C1QC; ab75756) (Abcam, Cambridge, UK), β-actin (ACTB; BS6007M, Bioworld Technology), and profilin-1 (PFN1; NBP2-02577, Novus Biologicals, Littleton, Colorado, USA). Horseradish peroxidase-conjugated anti-mouse (ab6728, Abcam) or anti-rabbit (A120-1019, Bethyl Laboratories, Montgomery, Texas, USA) antibodies were used as secondary antibodies at an appropriate dilution. Blots were visualised using the Super Signal West Pico Chemiluminescent Substrate detection system (Pierce, UK), according to the manufacturer’s instructions. An antibody against glyceraldehyde phosphate dehydrogenase (GAPDH) (ADI-CSA-335, Enzo Life Sciences, Inc, Farmingdale, New York, USA) was used as an internal control. All experiments were performed at least three times. Band intensities were quantified using Image J software (National Institutes of Health, Bethesda, Maryland, USA).
Renal histology of FD patients
Thirty-six FD patients were identified in the Asan Medical Center, Seoul, Korea, from March 1999 to December 2016. Among them, renal biopsies were performed in 13 patients, and detailed information about the renal biopsy findings before ERT was available in 11 patients, in whom light microscopic, immunofluorescent imaging (including IgG, IgM, IgA, C3, C4, C1q, and fibrinogen) and electron microscopic findings were reviewed.
Results
Clinical and genetic characteristics of FD patients
Eight unrelated male patients with classical FD, subject number (SN) 1–8, were enrolled in this study. SN 1–7 have been reported previously.16 20 The mean patient age at diagnosis was 28.9±15.2 (8–46) years (table 1). Enzymatic activity was markedly reduced in all the patients’ peripheral leucocytes, at 0.2±0.47% (0–1.1%) of the mean normal α-GAL activity. Eight GLA mutations were identified, as previously reported.16 20 Serum Gb3 levels were 18.8±9.4 (9.0–36.0) µg/mL (normal range 3.9–9.9 µg/mL).
Clinical and genetic findings for male patients with classical phenotype Fabry disease
All patients had the classical FD phenotype. Angiokeratoma, anhidrosis, acroparesthesia, cardiac hypertrophy, and sensorineural hearing loss were noted in four (50%), seven (88%), five (63%), four (50%), and five (63%) patients, respectively. The estimated glomerular filtration rate (eGFR) was reduced in SN 6 and SN 8. Agalsidase beta (Fabrazyme, Genzyme—a Sanofi company, Cambridge, Massachusetts, USA) was administered at a dose of 1 mg/kg every other week, except for 23 months (from December 2009 to October 2011) when Fabrazyme was in short supply because of viral contamination during manufacturing and was administered at a dose of 0.25–0.5 mg/kg every other week. The cumulative dose was 94±30 (68–163) mg/kg. No patient experienced severe infusion-associated reaction. At 64.5±15.2 (46–96) months after ERT, the clinical course of SN 1–3 and 5–8 were stable, whereas significant renal and cardiac progressions were noted in SN 4 (table 1). No patient experienced a stroke-like episode.
Plasma proteomic analyses before and after ERT
Plasma proteomic profiles were compared in samples from SN 1–8 that were collected before initiating ERT and after 7.5±2.7 (4–12) months of ERT. Several of the most abundant plasma proteins (albumin, immunoglobulin A and G, transferrin, haptoglobin, and antitrypsin) were removed using MARC, and protein spots with more than two-fold differences in level between plasma samples before and after ERT in at least six of SN 1–8 were selected using 2-DE (see online Supplementary figure S1). MALDI-TOF MS and MS/MS analyses were performed to identify those proteins with significantly different levels. MS analysis identified seven protein spots with more than two-fold significantly increased levels after ERT (p<0.05), while 46 spots were identified with more than two-fold reduced levels after ERT. MS/MS analysis identified four spots with increased levels after ERT and 34 spots with reduced levels after ERT (see online supplementary table S1). However, each spot represented several tens of different candidate proteins. Therefore, we reviewed all the candidate proteins represented by each spot in either analysis. We selected only those proteins that were identified by both MS and MS/MS analyses as differentially expressed proteins, which included 15 proteins that showed reduced levels after ERT but none with elevated levels after ERT (table 2).
Identification of 15 differentially expressed proteins in the plasma of patients with Fabry disease during enzyme replacement therapy
Functional characterisation of differentially expressed proteins after ERT
The functions of 15 differentially abundant proteins were reviewed. These included inter-α-trypsin inhibitor heavy chain family, member 4 (ITIH4) and serum amyloid A-1 (SAA1) protein, which are associated with inflammation.21 α-enolase (ENO1) is involved in tissue remodelling processes, such as angiogenesis and atherosclerosis.22 ACTB is involved in various cellular processes, such as motility, structure, and integrity. The binding partners of ACTB are PFN1 and vinculin (VCL).23 24 Fibrinogen-α chain (FGA) is the α component of fibrinogen. C1QC, C3, and C4 (both C4A and C4B) are involved in the complement pathway.25 26 Carboxypeptidase N catalytic chain precursor (CPN1) is a plasma metalloprotease that inactivates C3-derived anaphylatoxin (C3a).27 The keratin, type II cytoskeletal 1 (KRT1) protein mediates the lectin pathway of complement activation during oxidative stress.28
Additionally, the protein artemis (DCLRE1C) is a DNA repair protein and peroxiredoxin-6 (PRDX6) has a role in protecting cells from oxidative injury. The 90 kDa heat shock protein (HSP90) is a molecular chaperone that is required for the proper folding of proteins.29
Validation of the proteins’ differential levels after ERT
As multiple proteins were identified in actin dynamics and complement activation, the following five proteins were selected to validate their differential levels after ERT: ACTB; the ACTB binding protein, PFN1; and the complement pathway components, C1QC, C3, and C4. Primary antibodies to human ACTB, PFN1, C1QC, inactivated C3b (iC3b), and C4B were used to validate the change in their levels. GAPDH was used as an internal control. When the levels of each protein were compared before and after ERT in all eight patients, the levels of iC3b, ACTB, and PFN1 were reduced significantly after ERT (Wilcoxon rank sum test; figure 1). However, when the levels of each protein before ERT were compared with those in plasma drawn from eight age- and sex-matched control individuals, the levels of ACTB, iC3b, and C4B were higher than those in the age- and sex-matched controls, whereas those of C1QC were lower than those in the controls (Wilcoxon rank sum test, p<0.05). Next, the levels of ACTB, PFN1, C1QC, iC3b, and C4B were assessed over a longer period, for 64.5±15.2 (46–96) months after ERT. The overall trend of declining level of each protein was observed over the course of ERT (see online Supplementary figure S2). However, high variability in the levels of ACTB and PFN1 were observed both between patients and within each patient over time (see online Supplementary figure S2). By contrast, a gradual reduction in the level of iC3b was observed in all patients except for SN 7, whereas no such changes were observed for the levels of C1QC or C4B (see online Supplementary figure S2). Next, iC3b levels were compared between FD male mice at 10 weeks of age (n=4) and their age- and sex-matched control mice (n=3). Significantly increased plasma iC3b levels were observed in the plasma of FD mice (p=0.006, Student t-test) (see online Supplementary figure S3).

Levels of five proteins—ACTB, PFN1, C1QC, iC3b, and C4B—in plasma from Fabry disease (FD) males (n=8) and age- and sex-matched control individuals (n=8). Levels were normalised to those of glyceraldehyde phosphate dehydrogenase (GAPDH). The graph shows the mean and SD of the level of each protein from normal controls or from FD males before enzyme replacement therapy (ERT) (FD-Pre), after 7.5±2.7 (4–12) months of ERT (Post, 2-DE sample), and after 64.5±15.2 (46–96) months of ERT (Post, last sample); *p<0.05, **p<0.005, and ***p<0.0005 in comparisons between each sample compared with the FD-Pre levels (Wilcoxon signed-rank test).
To assess the clinical applicability of iC3b as an indicator of the efficacy of ERT, its serial level pattern throughout the course of ERT was compared with that of plasma Gb3 (figure 2). Notably, the changes in iC3b throughout the course of ERT were comparable to those of plasma Gb3, which were measured at the same time in each patient. In addition, the levels of iC3b were transiently increased during the global shortage of Fabrazyme (December 2009 to October 2011) in six patients (SN 2, 4–8), whereas the plasma Gb3 levels were elevated in four patients (SN 3, 5–7) (dotted lines in figure 2). Next, anti-α-GAL IgG Ab were measured in the same plasma samples, which were positive in five patients (SN 1, 3–5, 8) and neutralising antibody was detected in four patients (SN 1, 4, 5, 8) (figure 2).

Plasma Gb3 and iC3b levels and anti-α-GAL IgG titre from Fabry disease (FD) males throughout the course of enzyme replacement therapy (ERT). The levels of iC3b were normalised to those of glyceraldehyde phosphate dehydrogenase (GAPDH) in each sample (iC3b/GAPDH). Each error bar represents the SD of three independent measurements of each sample. Shaded areas represent the normal range of plasma Gb3 levels (3.9–9.9 µg/mL) and the iC3b/GAPDH ratio (range of normal age- and sex- matched controls (n=8), 0.2–1.0). Dotted lines represent the global shortage of Fabrazyme (December 2009 to October 2011). Dilution fold for 22% of cut-point of neutralising ability: +, 2; ++, 20; +++, 200; ++++, 20 000.
In vivo characterisation of complement activation in FD
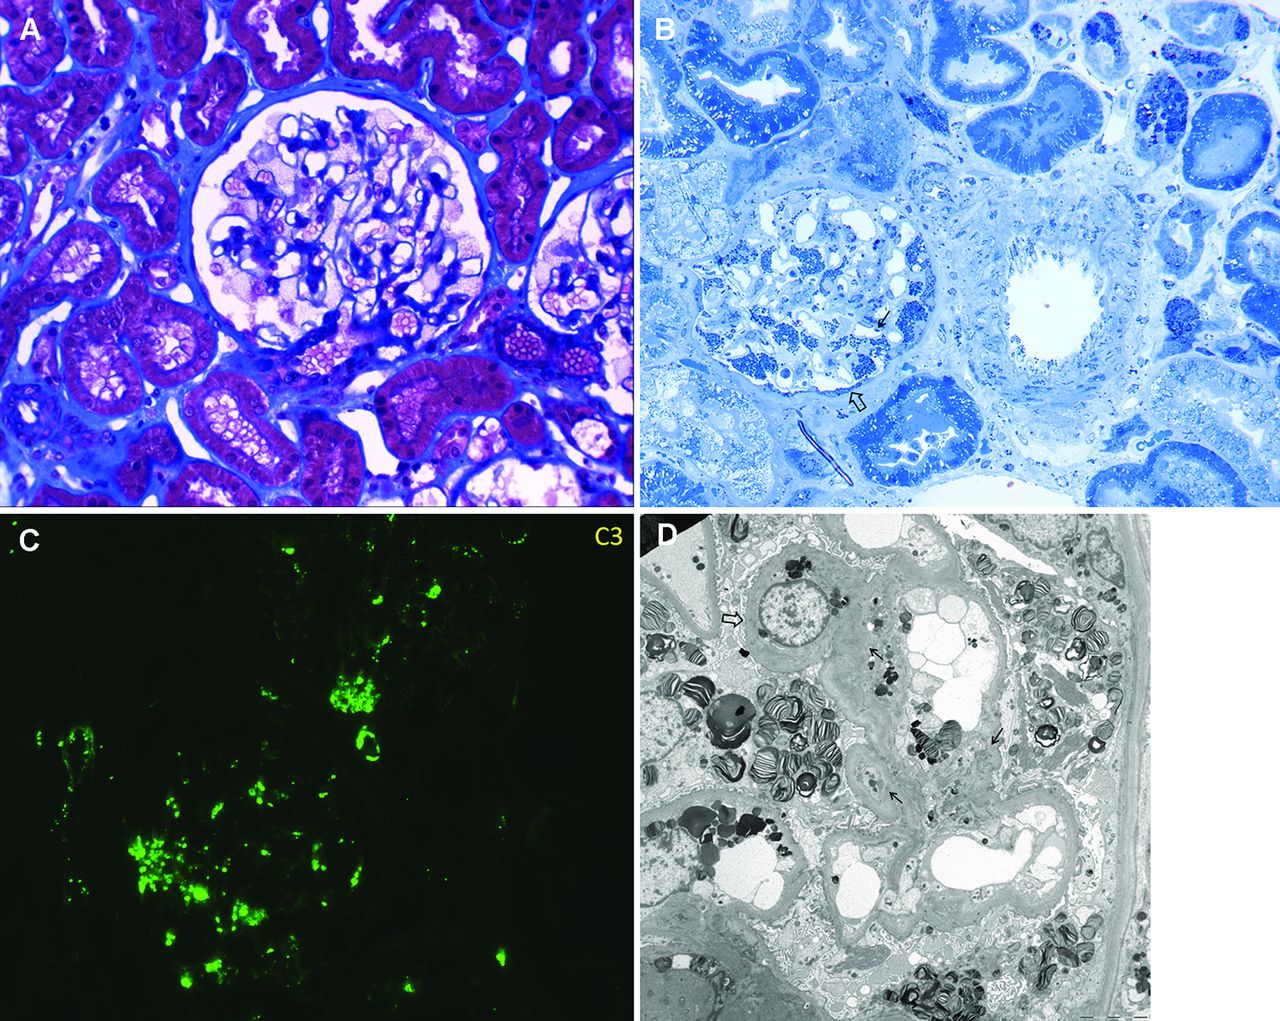
To assess the in vivo complement status in FD, renal histological findings before ERT were reviewed in SN 1 and 3 and in another nine FD patients (table 3). On light microscopic examination, global and segmental glomerular sclerosis were found in five (45.5%) and one (9.1%) patients, respectively. Tubular atrophy and interstitial inflammation were also detected in five (45.5%) patients each. On electron microscopic examination, Gb3-containing deposits were found in all FD patients, most densely in the glomerular and tubular epithelial cells (figure 3A, B).
Cytochemistry of Fabry disease (FD). A. Trichrome stain of a biopsy from an FD patient shows characteristic lacy cytoplasm in the podocytes. B. In this patient, toluidine blue staining of a 1 µm section shows a prominent accumulation of densely stained lipid (Gb3) in podocytes, parietal epithelial cells (⇨), and endothelial cells (→) of the glomerulus. Gb3 accumulation was also detected in the arterial endothelial cells, smooth muscle arterial wall, and tubular epithelial cells. C. C3 is deposited in coarse, brightly staining granules in the mesangium, glomerular basement membrane, and hilar arteriole in FD. D. In this patient, the electron micrograph shows a podocyte with lipid inclusions that have a striped or zebra pattern. Electron dense deposits can be observed in the mesangial area (→) and glomerular basement membrane (⇨); some of them are dissolved.
Renal biopsy findings of 11 patients with Fabry disease
Notably, on immunofluorescent examination, IgM and C3 deposits were positive in seven (63.6%) and eight (72.7%) patients, respectively. IgA, C4, and C1q were also positive in some patients (table 3). These immune-mediated deposits were granular, with variable intensity (trace to moderate), and were found in the glomerular mesangial area (figure 3C, D).
Discussion
In the present study, we analysed the plasma proteomic profiles from FD patients before and after ERT, which revealed that several molecules were differentially abundant (15 decreased out of 66 proteins monitored) in the plasma of the treated patients. Assessment of their functional roles together with assessment of their changes in level throughout a longer course of ERT increased the confidence that these proteins are potential biomarkers that might be related biologically to the effects of ERT on the underlying pathology of FD.
Importantly, our findings highlighted interactions between ACTB and PFN1-endothelial nitric oxide synthase type 3 (NOS-3, or eNOS), as well as the complement pathway, as potential biomarkers of the molecular pathology of FD. ACTB is one of the most highly conserved proteins. It is found ubiquitously in all eukaryotic cells and is involved in various cellular processes, such as motility, structure, and integrity. Additionally, ACTB was shown recently to play an important role in eNOS regulation.30 PFN1 is an actin-binding protein,23 that can regulate actin polymerisation in response to extracellular signals. VCL is another actin-binding protein that mediates cell-to-extracellular matrix and cell-to-cell adhesions.24 As evidence increases that eNOS dysfunction is a cause of FD vasculopathy,31 32 the differential level of ACTB and its binding partners, PFN1 and VCL, could also be considered as associated phenomena. Accordingly, reduced levels of ACTB and PFN1 were observed in plasma after ERT. However, when the levels of ACTB and PFN1 were assessed throughout the course of ERT, wide variability in their levels were noted, both between patients and within individual patients. Indeed, the level of ACTB is affected by various biochemical and environmental stimuli, including fasting, diet, exercise, or hypoxia.33 Therefore, despite its functional connection to eNOS, our findings indicated the limited efficacy of ACTB and its binding partners as biomarkers for monitoring FD during ERT.
The complement pathway is a central effector of innate immunity that can be activated via the classical, alternative, or lectin pathways. Additionally, increasing evidence supports an association between the complement pathway and cardiovascular pathology.34–36 However, to the best of our knowledge, no study has been conducted to assess complement pathway activation in FD, although non-specific focal C3 deposits may be observed in renal mesangial cells in some FD patients.37 38 In our study, C1q, C3, and C4, together with the regulators of these complement molecules, CPN1, KRT, and FGA, were differentially abundant after ERT in human FD plasma. C1 is involved in triggering the activation of the classical pathway, while C4 mediates the activation of the classical or lectin pathways. The activation of any of these three pathways results in the cleavage of C3 to yield C3a and C3b. C3a is an anaphylatoxin that promotes inflammation, whereas C3b participates in the formation of the membrane attack complex, which is known as C5-9.39 C3b is converted rapidly into its inactive form, iC3b, by factor I in the presence of factor H.40
The activity of C3 was evaluated using an antibody to the C3 α chain, which is cleaved into C3a and C3b, and is then further processed into iC3b. The activity of C4 was evaluated by western blotting using a specific antibody against C4B. The overall levels of C3 and C4 were increased in the plasma of untreated FD patients, and both of these levels decreased gradually throughout the course of ERT, whereas those of C1QC did not change during ERT. However, when the levels in each patient were reviewed throughout the course of ERT, iC3b was the only protein that showed progressive reduction in its level throughout the longer course of ERT, which contrasted with the variable levels of C4B.
Altered C3 activity was further indicated by the increased level of iC3b in the pre-ERT plasma of an FD mouse model and by increased C3 deposits in the pre-ERT human renal tissues. Notably, mesangial, or sometimes peripheral, C3 deposits were documented in the majority of FD patients evaluated in our study. C3 deposits have also been reported in other glomerulonephropathies, with or without immune complexes, indicating that classical or alternative complement activation underlies the nephropathy.41 C3 deposition in FD is considered secondary to renal injury with Gb3 accumulation, and likewise, its deposition is suggested to contribute further to renal injury. Therefore, our observations indicated that complement pathway activation mediated by C3 might be involved in the molecular pathology of FD, and ERT might act to mitigate its activation.
Therefore, measurements of iC3b levels throughout a course of ERT might aid the evaluation of the therapeutic efficacy of ERT in FD patients. Notably, its progressive changes throughout the longer course of ERT were comparable to those of the widely used biomarker plasma Gb3. Moreover, its changes correlated better with the cumulative dose of ERT than did those of plasma Gb3. For example, during the period when the recombinant enzyme was not readily available, iC3b levels became transiently elevated in more patients when compared with their plasma Gb3 levels. Our findings suggested that plasma iC3b levels might represent a biomarker to monitor the disease activity throughout a course of ERT, although sequential measurements in a larger cohort of FD patients are required.
Additionally, the progressive changes in iC3b levels need to be correlated with the clinical outcome of FD patients after a long-term ERT course. In our present study, the patterns of plasma iC3b levels did not differ among the seven patients with a stable clinical outcome and the one patient (SN 4) with a poor outcome; however, because of the small number of patients, it was not possible to identify any correlations. Otherwise, sequential measurements of C3a levels in the blood of patients before and during ERT will also be necessary, because evidence for an association of its levels with cardiovascular disease linked to atherosclerosis has been reported previously.35 Plasma C3a can be measured using an ELISA. Unfortunately, such measurements were not feasible in our present study because the amount of stored plasma from each patient was insufficient to permit additional ELISA assessments. Additionally, freshly drawn plasma samples would be needed for accurate measurements because of the small molecular weight of C3a, which causes it to be degraded rapidly.
Despite its applicability as a biomarker that can indicate the therapeutic efficacy of ERT and monitor the clinical course of FD patients over a longer period, it should be noted that plasma iC3b levels have limitations for use as a diagnostic FD marker. Its pretreatment levels in human FD plasmas varied, and were within the range of normal control individuals for four out of our eight patients. In addition, although C3 deposits were noted in renal tissues of FD patients before ERT, their positivity was not strong and some FD patients did not have renal C3 deposits. FD knock-out mice do not have obvious manifestations of FD despite the progressive accumulation of Gb3 and its related metabolites, limiting its clinical relevance to the observation in human. Furthermore, it could be argued that the changes in iC3b might reflect the immune response to ERT and its decrease does not truly reflect the stabilisation of the complement pathway during ERT. Immune reactions to ERT are usually IgG-mediated in >50% of male FD patients. Anti-α-GAL IgG antibodies might influence the efficacy of ERT in some patients.42 However, neutralising antibody was observed only in four patients in our study. In addition, the sequential changes of the two complement components that are involved in antibody-mediated complement activation, C4B and C1QC, were highly variable during ERT compared with the gradual decrease of iC3b. These results indicated that complement activation might contribute in part to the pathogenesis of FD, and ERT helps to minimise further activation. The results from the FD mouse model and renal in vivo evidence also supported this hypothesis. More robust evidence obtained from a larger cohort of FD patients will be required to further document complement activation in FD.
In addition to ACTB–PFN1–eNOS3 interactions and complement activation, evidence of inflammation, together with oxidative and ischaemic injuries, was observed in the present study, which might contribute to the pathogenesis of FD. The differential levels of an anti-inflammatory protein (ITIH4),21 an acute phase reactant (SAA1), and a tissue remodelling protein (ENO1)22 suggested that ischaemic vascular pathology occurs in FD. Intracellular oxidative stress was suggested by the differential levels of DCLRE1C and PRDX6. The differential level of a stress-induced chaperone, HSP90(α), indicated that an increased unfolded protein response and apoptosis occur in peripheral blood mononuclear cells of male FD patients.29 Previous proteome studies in FD also reported that immune response, inflammation and apoptosis are associated with the pathogenesis of FD, as in our study.4 14 15 43 On the other hand, the candidate biomarkers suggested in each study were different, which might be attributed to the materials analysed and the methods applied in each study.
In conclusion, plasma proteomic profiles obtained before and during ERT revealed several important molecular features related to the pathogenesis of FD. These include inflammation with oxidative stress and ischaemic injuries, ACTB–PFN1–eNOS3 interactions, and complement activation. Among these alterations, activation of C3 and its derivative iC3b appear to represent candidate markers for monitoring disease activity and ERT efficacy in FD patients, despite the individual differences in complement pathway activation that were observed. Further studies, including comprehensive analyses of the activities of components in the complement pathway supported by histological findings in various cell types, such as FD vascular endothelial cells, could help to determine whether complement activation contributes to the pathogenesis of FD and its stabilisation during ERT.
Acknowledgments
The authors would like to thank all patients and families for their cooperation in this study.
References
Footnotes
Contributors SHH, HWY, RJD, and BHL designed the research project and SCJ, JHC, and RJD supervised the experiments. EK, YMK, and IHC reviewed the clinical findings. SHH, JMK, JMK, GHK, and LBH analysed the proteomics data. SHH, MK, KYK, and JYJ performed the in vitro studies. HG reviewed the pathological findings. SHH, GHK, HG, and BHL wrote the manuscript, which was then reviewed critically by JHC, HWY, SCJ, and RJD. All co-authors read and approved the final manuscript.
Funding This research was supported by the Bio & Medical Technology Development Program of the National Research Foundation (NRF) and funded by the Korean government (MSIP&MOHW) (NRF-2016M3A9B4915706).
Competing interests None declared.
Patient consent Obtained.
Ethics approval The institutional review board of the Asan Medical Center, Seoul, Korea.
Provenance and peer review Not commissioned; externally peer reviewed.