Article Text

Abstract
Introduction Aneuploidy (the presence of extra or missing chromosomes) arises primarily through chromosome segregation errors in the oocyte at meiosis I but the details of mechanism by which such errors occur in humans are the subject of some debate. It is generally believed that aneuploidy arises primarily as a result of segregation of a whole chromosome to the same pole as its homologue (non-disjunction). Nonetheless, classical cytogenetic studies suggest that this model does not fully account for the patterns observed in human oocytes. An alternative model (precocious separation of sister chromatids) has thus been proposed, but recurring criticism of this model purports that technical issues may have led to interpretation errors.
Materials and methods Array comparative genomic hybridisation (aCGH) was used on 164 human first polar bodies to distinguish between whole chromosome (non-disjunction) and chromatid (precocious separation) errors.
Results Single chromatid errors were over 11 times more common than whole chromosome errors, consistent with prior classical cytogenetic and fluorescence in situ hybridisation (FISH) studies.
Discussion The received wisdom that non-disjunction is the primary mechanism leading to human aneuploidy should be reconsidered.
- Polar body
- aneuploidy
- chromatid
- meiosis
- aCGH
- diagnostics
- genetics
- genetic screening
- counselling
- screening
- cell biology
Statistics from Altmetric.com
- Polar body
- aneuploidy
- chromatid
- meiosis
- aCGH
- diagnostics
- genetics
- genetic screening
- counselling
- screening
- cell biology
Introduction
Aneuploidy—the presence of extra or missing chromosomes in a gamete, embryo, fetus or live born individual—is the major cause of human pregnancy loss, mental retardation and, most likely, in vitro fertilisation (IVF) failure.1–4 Although errors can occur in male gametes and post-meiotically, aneuploidy arises primarily through chromosome segregation errors in the first division of female meiosis (maternal MI).1–5 It is well established that advanced maternal age and perturbed genetic recombination at MI can affect the levels of aneuploidy; differences in segregation error rates for individual chromosomes are also reported.6 7 Despite decades of study, the precise mechanism by which chromosome segregation errors occur (and lead to aneuploidy) is the subject of some debate.
It is generally believed that the origin of human aneuploidy (at MI) involves the segregation of a whole chromosome to the same pole as its homologue—that is, non-disjunction (figure 1); this is because studies on model organisms such as yeast, Drosophila, and mouse largely point to this as the primary mechanism.2–4 In contrast, several investigations involving the generation of chromosome preparations from human oocytes suggest that the non-disjunction model does not fully account for the pattern of aneuploidies seen.1 8–13 As a result, Angell et al offered an alternative explanation, variously described as ‘pre-division’, ‘premature separation of sister chromatids’ and/or ‘precocious separation’,8 9 11 12 14 to explain the majority of aneuploidy seen in humans. This model proposes that meiosis I errors result in extra or missing chromatids, not whole chromosomes in the daughter cells (figure 1). Recurring criticism of such a model suggests that poor oocyte quality, use of ‘failed IVF’ oocytes, prolonged time in culture, metaphase preparation technique, and lack of rigour in the analysis may have led to interpretation errors.15–18 In other words, critics of the Angell model suggest that these confounding factors cause the chromatids to separate prematurely for technical, rather than biological, reasons.

A metaphase I oocyte about to undergo division (top). The larger chromosome is represented as undergoing normal disjunction (bottom); the smaller chromosome is shown undergoing classical non-disjunction (bottom left) and precocious separation (bottom right). Both mechanisms can lead to aneuploidy.
With the above in mind, experiments that derive results independent of these confounding factors are key to understanding how this fundamental phenomenon in medical genetics arises. In particular, it is important that we reconcile the relative contributions to human aneuploidy of the two models illustrated in figure 1. The aim of this study was therefore to distinguish whole chromosome from single chromatid errors in freshly harvested human first polar bodies using a methodology less prone to the aforementioned problems—that is, array comparative genomic hybridisation (aCGH).19
Materials and methods
Human oocytes from 25 patients aged 29–50 years were harvested 43–45 h after administration of human chorionic gonadotrophin and 169 first polar bodies were biopsied from them by micromanipulation. They were subjected to whole genome amplification (WGA) using Sureplex then aCGH using a commercial service (both BlueGnome, Cambridge, UK). Briefly, WGA products from biopsied polar bodies and control (male) DNA were labelled with Cy3 and Cy5 fluorophores by random priming. Labelling mixes were combined and co-precipitated with human Cot-1 DNA, resuspended in hybridisation buffer and hybridised onto ‘24 sure’ microarray slides (BlueGnome) followed by stringency washes to remove unbound DNA. Scanned images of hybridised fluorophores were then exported to the ‘BlueFuseMulti’ software (BlueGnome) for ratio analysis19 in which per-chromosome Cy3/Cy5 ratios were examined.
Representative amplification of genomic DNA from single cells is a technically challenging procedure susceptible to variation in the quality of the biological material as well as upstream methods, including polar body biopsy, culture and storage conditions. Hybridisation plots of WGA products are therefore typically ‘noisy’ compared to those of high quality genomic DNA samples, and this is manifested as variation in the log2 ratio of the Cy3 versus Cy5 signals. We compensated for this by technically matching samples to a co-hybridised reference and by the recent introduction of smoothing algorithms during data analysis. Specifically, the latest version of the ‘BlueFuseMulti’ software incorporates the generation of ‘green lines’ drawn automatically based on the result of the aneuploidy calling algorithm that the software employs (figure 2). The algorithm classifies each whole chromosome as either ‘copy number neutral’ or showing evidence of gain or loss by estimating the probability of each outcome. The software then automatically selects the most likely status for each chromosome through the generation of a horizontal green line. When a chromosome has been determined to be copy number neutral, the green line is drawn across the chromosome at zero on the log2 ratio scale. Where a chromosome is determined to have an abnormal copy number the green line is drawn across the chromosome at the level of the median log2 ratio of the set of probes that map to the chromosome. In our experience, this approach generates an excellent ‘first visualisation’ of the data, detecting over 95% of errors accurately. In addition, three independent observers examined each graph carefully to identify any chromosomes which the software may not have called aneuploidy within the criteria set out below. When all three observers agreed that that the green line should be redrawn (as, in our opinion, the software had not called copy number accurately) then this was done manually. Although this approach inevitably leads to a degree of subjectivity in the interpretations, analysis of several thousand single cells in this way has led us to be confident about the assignments in each case.

Array comparative genomic hybridisation (aCGH) hybridisation ratio plot showing gains and losses from first polar bodies and comparisons with sex chromosomes. (A) Euploid polar body compared to male reference. (B) Aneuploid polar body demonstrating chromatid losses on chromosomes 9, 15, and 17, and a gain of whole chromosome 14. (C) Aneuploid polar body demonstrating chromatid gains on chromosomes 1 and 10, and a loss of whole chromosome 15.
Single chromatid errors (precocious separation) were distinguished from whole chromosome (non-disjunction) errors through examination of the mean per-chromosome hybridisation ratios. For most chromosomes (ie, not the sex chromosomes nor the aneuploid chromosomes) a consistent 1:1 ratio was observed along the chromosome length. As all samples were co-hybridised with male genomic DNA, we first examined the graphs to establish a hybridisation pattern representing a 2:1 ratio (typically log2=0.4–0.6; figure 2A) for the X chromosome, and a ‘0:2’ ratio for the Y chromosome (typically log2=−0.6–−1, however the Y chromosome displayed more variation than the X; figure 2A).Whole chromosome gains were consistent with a 2:1 ratio. In practice we generally scored a whole chromosome gain (non-disjunction error) if the mean hybridisation ratio had a log2 value greater than 0.6 and greater or equal to that of the X chromosome. Single chromatid gains (precocious separation) were consistent with a 3:2 (or 1.5:1) ratio, which was manifested as log2 ratios of between 0.25 and 0.45 (and lower than that of the X chromosome). Whole chromosome losses (non-disjunction errors) were generally scored when the mean hybridisation ratio was lower than −0.8, whereas chromatid losses (precocious separation) were consistent with a 1:2 hybridisation ratio—that is, typically between −0.4 and −0.7 (figure 2B,C). Visual comparisons (for losses) were also noted for the Y chromosome but, because of the aforementioned variation compared to the Y, was used only as a guide. In any event, the ratios for the X and Y chromosomes were somewhat closer to zero than the whole chromosome gains and losses. We believe this is due of the presence of X/Y homologous genes.
Only rare ‘intermediate’ assignments (eg, between 0.45 and 0.6 for gains; −0.7 to −0.8 for losses) were the cause for some discussion and consensus. The vast majority were given the same diagnosis by all three observers and, where consensus could not be reached (eg, where there were multiple errors or the sex chromosomes were not easily read) the data was disregarded. For both gains and losses therefore there were two clear groups (with rare intermediates) that we could interpret as either ‘whole chromosome’ or ‘single chromatid’ gain/loss, and thereby infer the mechanism of chromosome segregation error.
Results
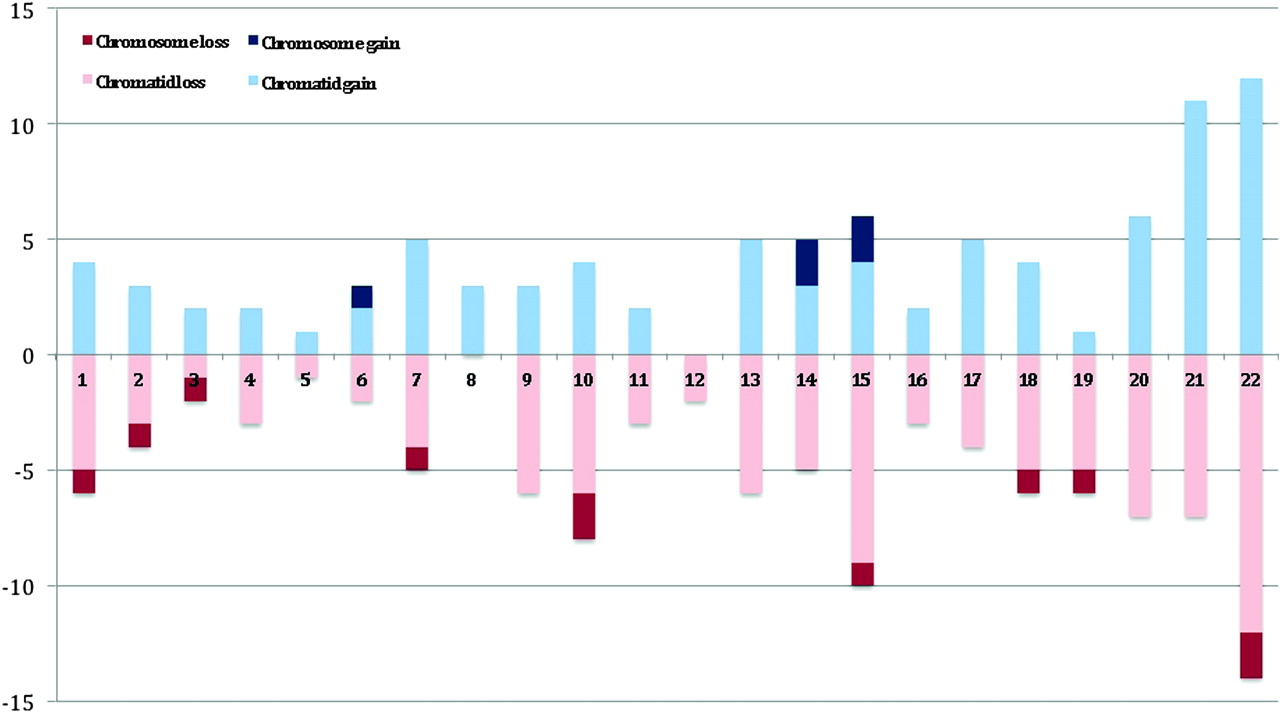
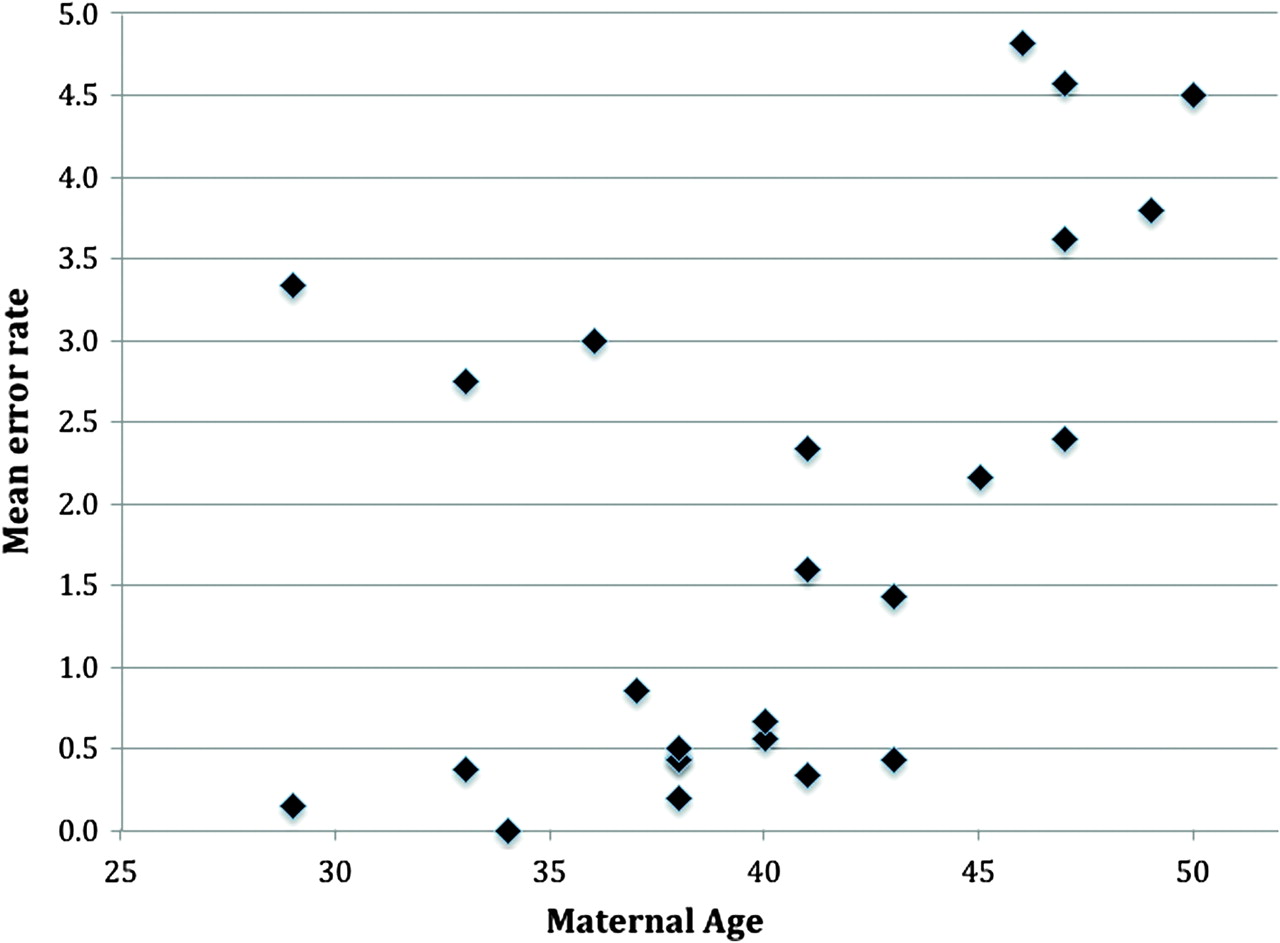
Of the 169 oocytes biopsied, a total of 164 (97.0%) first polar bodies were successfully amplified and analysed; the remaining five (3.0%) were discarded for technical reasons (eg, failed to amplify). Of those analysed, 78 (47.6%) had no detectable chromosome segregation error (eg, figure 2A), and 86 (52.4%) had at least one gain or loss of a chromosome/chromatid (eg, figure 2B,C and additional online materials). The total number of errors was 256, giving a per-polar body error rate of 1.56. The per-patient error rate was then compared to maternal age (see below). Of those aneuploid polar bodies, a further seven were not used for the chromatid/chromosome differentiation as the three independent observers were not confident of making a diagnosis. The main reason for this was that the polar bodies had multiple (up to 20) errors or, on occasion, the X/Y ratios were not clear. With these removed, the per-polar body error rate became 1.21. There was no statistical difference overall between the frequency of losses (110=55.3%) compared to gains (89=44.7%), but whole chromosome losses were twice as common as gains (figure 3). Most notably, single chromatid errors were 11.5 times more common than whole chromosome errors (92.0% vs 8.0%; figure 3). Figure 3 also shows that errors involving chromosomes 15, 21, and 22 were the most frequent and those involving chromosomes 3, 4, 5, 8 11, 12, and 16 the least frequent. Finally, a Pearson correlation coefficient of 0.4 (p=0.02 by one tailed t test) indicated a positive association between the frequency of segregation errors (all types) and maternal age, albeit with apparent inter-individual differences (figure 4, table 1).

Summary of aCGH experiments from human first polar bodies plotted against number of observed chromosomal abnormalities. Losses for chromatids and chromosomes are shown in light and dark red, respectively. Gains for chromatids and chromosomes are shown in light and dark blue, respectively.

Maternal age plotted against per-polar body chromosome segregation rate.
Ages, number of oocytes, number of errors, and per oocyte errors rates of patients in this study
Discussion
Our observations are consistent with previous studies on metaphase preparations of human oocytes1 8 14 20 and mouse model systems,21 supporting the hypothesis that precocious separation of sister chromatids is the predominant mechanism leading to aneuploidy in humans. The more often cited non-disjunction model, on the other hand, appears a relatively minor player. It has been suggested that reduction of function of cohesin proteins holding the chromatids together is involved in the aetiology of aneuploidy,20 21 and further studies combining the approaches outlined here with three dimensional imaging of the oocytes themselves will help to confirm this hypothesis.
The notion of chromosome specific error rates is also supported, but those observed in this study as being most prone to error were not necessarily those represented most frequently among spontaneous abortions.2 4 11 22–24 For example, chromosome 16—the most frequent trisomy observed in human abortus material—was apparently one of the least likely to undergo a segregation error in this dataset. It is possible that the absence of aneuploidy for chromosome 16 in this dataset is a mathematical anomaly; this will be confirmed or refuted when larger studies are analysed.
Unsurprisingly, our data support the well established association of advanced maternal age with aneuploidy.25 26 Nonetheless, even in this small dataset, we found preliminary evidence that some older women may segregate chromosomes normally in their oocytes. Thus, identification of such key individuals may be a route by which we might understand what specific factors associated with maternal age can lead to aneuploidy and, ultimately, what clinical interventions can be implemented to alleviate it.
Finally, our findings raise some immediate practical concerns regarding the use of polar bodies for pre-implantation genetic screening. The presence of extra or missing chromatids in the first polar body can lead to both euploid and aneuploid outcomes in the oocyte, reinforcing the need to screen both polar bodies when a definitive specific diagnosis is required (eg, for positive selection of euploid oocytes).19 20 The observation that meiosis II errors are not infrequent in female meiosis also supports the notion that both polar bodies should be in a clinical setting.
References
Footnotes
Funding This work was funded, in part by a Career Development Fellowship (BB/E024211/1) awarded to DKG. Other funders: BBSRC.
Competing interests A Thornhill and A Handyside have, or have had, directorial roles in the London Bridge Centre. A Gordon is a director of BlueGnome. Both companies could, potentially, benefit indirectly from the publication of this article.
Ethics approval This study was conducted with the approval of the research licence held at the London Bridge Fertility, Gynaecology and Genetics Centre.
Provenance and peer review Not commissioned; externally peer reviewed.