Article Text

Abstract
Background Leucocyte telomere length (TL) is a potential biomarker of ageing and risk for age-related disease. Leucocyte TL is heritable and shows substantial differences by race/ethnicity. Recent genome-wide association studies (GWAS) report ~10 loci harbouring SNPs associated with leucocyte TL, but these studies focus primarily on populations of European ancestry.
Objective This study aims to enhance our understanding of genetic determinants of TL across populations.
Methods We performed a GWAS of TL using data on 5075 Bangladeshi adults. We measured TL using one of two technologies (qPCR or a Luminex-based method) and used standardised variables as TL phenotypes.
Results Our results replicate previously reported associations in the TERC and TERT regions (P=2.2×10⁻⁸ and P=6.4×10⁻⁶, respectively). We observed a novel association signal in the RTEL1 gene (intronic SNP rs2297439; P=2.82×10⁻⁷) that is independent of previously reported TL-associated SNPs in this region. The minor allele for rs2297439 is common in South Asian populations (≥0.25) but at lower frequencies in other populations (eg, 0.07 in Northern Europeans). Among the eight other previously reported association signals, all were directionally consistent with our study, but only rs8105767 (ZNF208) was nominally significant (P=0.003). SNP-based heritability estimates were as high as 44% when analysing close relatives but much lower when analysing distant relatives only.
Conclusions In this first GWAS of TL in a South Asian population, we replicate some, but not all, of the loci reported in prior GWAS of individuals of European ancestry, and we identify a novel second association signal at the RTEL1 locus.
- aging
- telomere length
- heritability
- ancestry
- genetic variant
This is an Open Access article distributed in accordance with the Creative Commons Attribution Non Commercial (CC BY-NC 4.0) license, which permits others to distribute, remix, adapt, build upon this work non-commercially, and license their derivative works on different terms, provided the original work is properly cited and the use is non-commercial. See: http://creativecommons.org/licenses/by-nc/4.0/
Statistics from Altmetric.com
Introduction
Telomeres are DNA–protein complexes that protect chromosome ends.1 In differentiated cells, the progressive attrition of the DNA component of telomeres, a tandem repeat sequence (TTAGGG n ), with each round of mitotic division ultimately leads to loss of telomere protection, triggering cell senescence or apoptosis.1 2 In germ cells, stem cells and most cancer cells, synthesis and maintenance of telomeres is carried out by the holoenzyme, telomerase, a ribonucleic protein consisting of a reverse transcriptase (TERT) and RNA template (TERC), which enable the elongation of the telomere repeat sequence, conferring replicative immortality.3–5 Leucocyte telomere length (TL) shortens with age, and associations between short TL and increased risk for numerous age-related diseases have been reported (ie, cardiovascular disease, hypertension, liver disorders, diabetes, atherosclerosis and mortality); consequently, TL is regarded as a surrogate marker for biological ageing.6–10 Additionally, there is increasing evidence suggesting more complex relationships among TL, cellular senescence and human health, with longer TL confering increased risk for several cancer types, including melanoma,11 glioma,12 neuroblastoma,13 lung adenocarcinoma14 and chronic lymphocytic leukaemia.15
Leucocyte TL is influenced by inherited genetic factors.16–19 Twin studies report TL heritability estimates as high as 80%,19 while other family studies estimate a heritability ranging between 34% and 50%.18 Genome-wide association studies (GWAS) have shown that leucocyte TL is influenced by inherited genetic polymorphisms. These studies have identified loci harbouring common genetic variants associated with leucocyte TL, including: ACYP2 (2p16.2), TERC (3p26), TERT (5p15.33), NAF1 (10q24.33), OBFC1 (10q24.33), DCAF4 (14q24.2), CTC1 (17p13.1), ZNF208 (19p12), ZNF676 (19p12) and RTEL1 (20q13.3).16 20–29 These variants have been discovered and replicated in studies of individuals of primarily European ancestry. Considering the strong evidence of population differences in TL, which may be due in part to polygenic adaptation,30 genetic studies of TL in non-European populations are warranted.31 In this study, we undertook S of TL among Bangladeshi individuals to identify new TL-associated variants and confirm the effects of loci reported in prior studies.
Experimental procedures
Study participants
The Health Effects of Arsenic Longitudinal Study (HEALS) is a prospective cohort study in Araihazar, Bangladesh, designed to assess the health effects of arsenic exposure through drinking water. Details of the HEALS have been described previously.32 In brief, 11 746 participants of ages 18–75 years old were recruited between October 2000 and May 2002. An expansion of the HEALS cohort (ACE) by 8287 participants occurred between 2006 and 2008. The Bangladesh Vitamin E and Selenium Trial (BEST) is a 2×2 factorial, double-blind, randomised chemoprevention trial designed to assess the effect of vitamin E and selenium supplementation on non-melanoma skin cancer risk among 7000 adults. BEST participants were recruited from Araihazar, Matlab and other surrounding districts of Bangladesh. Details of the BEST study methods have been described previously.33
DNA extraction and genotyping
Blood collection, DNA extraction, genotyping and quality control have been described previously.34 35 To summarise, in each study, study physicians collected blood from all participants at baseline. Genomic DNA for HEALS samples was extracted from clot blood using the Flexigene DNA kit (Cat #51204) from Qiagen (Valencia, California, USA). For BEST samples, DNA was extracted from whole blood using the QIAamp 96 DNA Blood Kit (Cat #51161) from Qiagen. A total of 5499 DNA samples were genotyped on HumanCytoSNP-12 v2.1 chips with 299 140 SNPs measured. Genotyping quality control was performed using PLINK. Individuals with call rates of <97% (n=13), gender mismatches (n=79) and technical replicate samples or duplicates (n=53) were removed. SNPs that had low call rates, that is (<95%) (n=20), were monomorphic (n=39 798), did not have rs identifiers (n=941) and had hardy-weinberg equilibrium (HWE) P values of <10−10 (n=634), were excluded. This quality control resulted in 5354 individuals and 257 747 genotyped SNPs. We generated imputed genotypes using the 1000 Genomes Project reference panel. We excluded SNPs that had an imputation r2<0.3, were triallelic, had an HWE of P<10−10 and had minor allele frequency (MAF) ≤0.01. HWE testing in an unrelated set of participants confirms that no SNPs used in the analysis have an HWE P value of <10−7.
Measurement of TL using qPCR
We attempted TL measurement for all participants having existing genome-wide SNP data. qPCR was performed on 2203 HEALS samples using two different plate designs (plate designs 1 and 2) on 96-well plates in order to measure each subject’s telomere repeat abundance as well as the abundance of a two-copy reference gene (RPLP0). Reference samples were included on each plate to allow standardisation of each reaction run with respect to interplate variations. For plate design 1, each plate consisted of triplicates of 14 participant DNA samples and six replicates of a reference DNA sample, each measured for both telomere and single copy gene for a total of 96 samples per plate. The 14 possible positions and corresponding primers for each plate using this design are described in online supplementary figure S1. For plate design 2, telomere and single copy gene amplification of each DNA sample were performed on paired plates, with the sample placed at the same position on each of the two plates. Each plate consisted of triplicates of 31 participant DNA samples and triplicates of a reference DNA sample, each measured for either telomere or single copy gene at the same position on paired plates. The 31 possible positions for each plate using this design are described in online supplementary figure S2.
Supplementary file 1
In brief, both plate designs used 30 µL amplification reaction volume of 1× Qiagen Quantitect Sybr Green Master Mix (Qiagen) and 25 ng of template DNA. Both plate designs used the following primer sequences: 5′GGTTTTTGAGGGTGAGGGTGAGGGTGAGGGTGAGGGT3′ (forward), 5′TCCCGACTATCCCTATCCCTATCCCTATCCCTATCCCTA3′ (reverse) for telomere sequence amplification and 5′CAGCAAGTGGGAAGGTGTAATCC3′ (forward), 5′CCCATTCTATCATCAACGGGTACAA3′ (reverse) for 36B4 sequence amplification.
For plate design 1, we used a protocol previously described by Ehrlenbach et al.36 The qPCR reaction was performed under the following conditions: 95°C for 15 min to activate Taq polymerase, 30 cycles at 95°C for 15 s, 54°C for 2 min and 72°C for 1 min, followed by 72°C for 4 min. For plate design 2, we used a protocol previously described by Cawthon.37 The telomere reaction used the following protocol: 95°C for 15 min to activate Taq polymerase, 25 cycles at 95°C for 15 s and 54°C for 2 min, while the RPLP0 (reference) reaction ran at 95°C for 15 min to activate Taq polymerase, 30 cycles at 95°C for 15 mins and 58°C for 1 min.
Threshold cycle (Ct), is the threshold that represents a level above background (noise) fluorescence and is the number of cycles necessary to detect a real signal from the sample. Ct values were averaged across replicates for each sample. The relative TL was calculated as a ratio of telomere repeat copy number to single-gene (RPLP0) copy number, that is, T/S ratio (telomere to single gene reference), according to the following equation:
 (1)
(1)
The coefficients of variation (CV) were calculated for each set of replicates (one for each study sample triplicate and one for each reference sample sextuplicate). The CV was calculated as the SD of the sample replicates divided by the mean of the replicates:
 (2)
(2)
To confirm reproducibility of the measured T/S ratio for plate design 1, we reran 37 samples on separate days, from which we calculated the interplate CV to be 11.7%. An additional sample across 31 plates assessed for reproducibility of plate design 2 showed an interplate CV of 9.8% in the assessment of reproducibility of plate design 2.
Measurement of TL using QuantiGene chemistry on a Luminex platform
The Affymetric-Panomics QuatiGene Plex, a probe-based non-PCR assay, was developed in our lab to measure TL in BEST (n=1825) and ACE (n=1047). This assay uses approximately 50 nanograms of DNA which is hybridised to sequence-specific probes for the telomere repeat sequence specific and the reference gene sequence (ALK)). The abundance of the telomere repeat sequence, relative to the reference gene, is detected using a Luminex instrument. The details of this method have been previously described.38 A major advantage of the Luminex-based method over qPCR is the lack of position effects.39 Additionally, the Luminex method has been validated by Pierce et al 40 in a blinded comparison with Southern blot analysis. Briefly, fluorescent Luminex microbeads designed with capture probes are exploited to capture DNA molecules. Each DNA target sequence has two sets of specific probes: (1) capture extenders and (2) label extenders and blocker probes. The intensities of the fluorescent signals produced from the binding of preamplifiers to amplifiers are read on a Luminex 200 instrument and are proportional to the relative TL expressed as Telomere Quantity Index (TQI). Similar to T/S ratio obtained through qPCR, TQI is a ratio of telomere probe to reference gene probe that directly accounts for plate-to-plate variation in intensity measurement.
Statistical analyses
We used linear mixed-effects models to remove experimental variation in our TL measures; categorical indicator variables representing position and plate were treated as fixed and random effects, respectively, using the lme package in R (see online supplementary figure S3). We ran three mixed-effects models; one for each different qPCR plate design used and one for the Luminex-based method. The residuals from these mixed-effects models were standardised and used as our TL phenotype in the GWAS. To ensure adequate control for population structure (ie, cryptic relatedness), we ran principal component analysis using the 1000 Genomes Project reference populations (n=2504) and unrelated (r<0.05) participants in our Bangladeshi cohort (n=1524) (see online supplementary figure S4). Because of the presence of close relatives in these cohorts (see online supplementary table S1), we use the Genome-wide Complex Trait Analysis (GCTA) software41 for the GWAS using a mixed linear model that adjusts for relatedness and the following fixed covariates: age, sex, batch and cohort.42 For each region identified in the GWAS , we conducted a conditional association analysis, adjusting for the lead SNP, to identify secondary association signals. Observed association signals were compared with summary results from the European Network for Genetic and Genomic Epidemiology (ENGAGE) consortium GWAS of individuals of European ancestry provided by Codd et al 21 to test for replication (https://downloads.lcbru.le.ac.uk/engage).
In order to obtain a SNP-based heritability estimate for TL, we used a restricted maximum likelihood analysis as implemented in GCTA, adjusting for cohort, sex, batch and age. We conducted these analyses first restricting to ‘unrelated’ individuals with coefficients of relationship (r) of 0.05 and below. We then increased this threshold to include more closely related pairs, which increases power but is prone to bias due to shared environment. In addition, we used the method described by Zaitlen et al 43 to estimate the full narrow-sense h2, a method that leverages relatedness for close relatives only by setting r values less than 0.05 to zero. This method captures the effects of rare variants but is also prone to bias due to shared environment.
Results
Characteristics of the 5075 participants included in our analyses are described in online supplementary table S2. Similar to other studies of TL, we observed a significant inverse association between TL and age that is consistent by cohort (HEALS: r=−0.20, P<2×10⁻¹⁶, BEST: r=−0.23, P<2×10⁻¹⁶ and ACE: r=−0.28, P<2×10⁻¹⁶). The results of the GWAS are summarised in figure 1. The quantile–quantile plot shows no evidence of early deviation from the P value distribution under the null hypothesis, suggesting adequate control for population structure (ie, cryptic relatedness) and potential batch effects (genomic inflation factor=0.999) (figure 1A and online supplementary figure S4). Adjustment for body mass index and smoking status did not impact the findings of this GWAS. Among our eight most significant association signals, three reside in regions previously reported to affect leucocyte TL, and each of these three regions contains a known telomere maintenance gene: 3q26 (TERC), 5p15.33 (TERT) and 20p13.3 (RTEL1) (table 1 and figure 1A).
Associations* observed in regions previously reported to affect telomere length(TL) based on a genome-wide association analysis of 6.3 million SNPs (n=5075)

Summary plots of GWAS results. (A) Quantile–quantile (Q–Q) plot of the negative logarithm of the observed (y-axis) and expected (x-axis) P value for each SNP, where the red line represents the null hypothesis of no associations. B) Manhattan plot showing association signals in TERC, TERT and RTEL1 regions. The –log10(P values) are plotted against physical position for 6.3 million SNPs. The red line indicates the genome-wide significance threshold at P=5×10⁻⁸. We used a threshold of P=1×10⁻⁵ to define suggestive signals (blue line). GWAS, genome-wide association study.
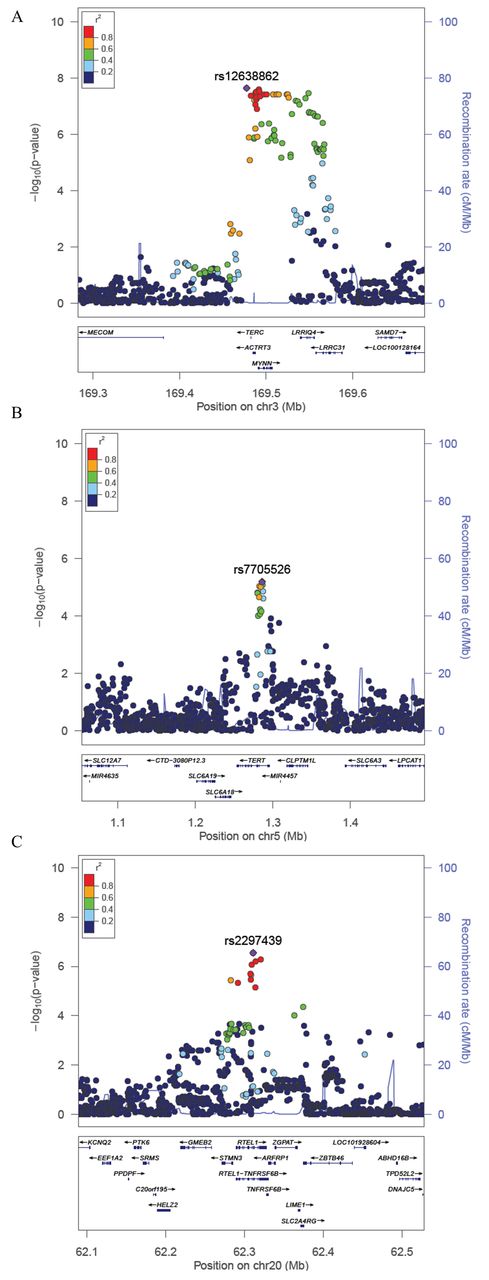
The TERC region (3q26) was the only region containing SNPs passing a genome-wide significance threshold of P<5×10⁻⁸ (table 1). The SNP showing the strongest association was rs12638862 (P=2.2×10⁻⁸), with the minor allele G (MAF=0.24) associated with decreased TL (β=−0.13) (table 1, figure 2A). While this SNP (rs12638862) has not been reported as a lead SNP in prior GWAS of TL, it is in linkage disequilibrium (LD) with previously reported SNPs (r2=0.87, 0.84 and 0.54 for rs10936599, rs3772190, and rs12696304, respectively, based on 1000 Genomes Project Bangladesh (BEB) data). Conditional analysis adjusting for rs12638862 showed no evidence of a secondary association signal in this region (see online supplementary figure S5a), which is consistent with prior findings.21
Regional association plots for loci associated with TL. (A–cC) The –log10(P Value) for each SNP is plotted against the base-pair position along each chromosome (Mb). For each locus, the lead SNP is represented in purple; SNPs are colour coded by level of linkage disequilibrium (r2) to the lead SNP, and the blue lines represent recombination rates (cM/Mb). TL, telomere length.
The SNP in the TERT region showing the strongest association was rs7705526 (P=6.4×10⁻⁶), whose minor allele A (MAF=0.43) was associated with decreased TL (β=−0.09) (table 1, figure 2B). Our lead TERT SNP was the same lead SNP reported by Do et al 22 and was in LD (r2=0.57) with the lead SNP reported in Codd et al 21 (rs2736100). The direction of association was also consistent with prior studies, and conditional analyses adjusted for the top SNP showed no evidence of a secondary association signal (see online supplementary figure S5b).
In the RTEL1 region, our lead SNP was rs2297439 (P=2.8×10⁻⁷); the minor allele G (MAF=0.25) was associated with decreased TL (β=−0.12) (table 1, figure 2C). In contrast to the association in the RTEL1 region previously reported by Codd et al 21 (lead SNP rs755017 in exon 2 of ZBTB46), our lead SNP is located in intron 12 of the RTEL1 gene (>100 kb from rs755017) and is not in LD with rs755017 (r2=0.06 and r2=0.01 based on 1000 Genomes Populations BEB and European (EUR), respectively), suggesting that our lead SNP is tagging a different causal variant in the RTEL1 region (see Discussion and online supplementary figure S6). Furthermore, this SNP was not reported in the summary results provided by Codd et al 21 potentially because it has a low MAF in populations of North and Western European ancestry (MAF=0.07 in Utah Residents with Nothern and Western European ancestry (CEU), Finnish in Finland(FIN), and British in England and Scotland (GBR) 1000 Genomes groups) and may be difficult to accurately impute. In fact, this variant has a low MAF in all 1000 Genomes populations except for those of South Asian ancestry (see online supplementary table S3 and figure S7). Based on the 1000 Genomes BEB population, there are three variants in perfect LD with rs2297439 (r2=1) (rs77552606, rs114703330 and rs75031349) and four additional variants in high LD (r2>0.9) (rs78430218, rs79981841, rs16983884 and rs79981941), all of which also show a low MAF in populations of North and Western European ancestry (see online supplementary table S4). Conditional analyses of this region adjusted for the top SNP showed no evidence of a secondary association signal (see online supplementary figure S5c). The previously reported RTEL1 SNP rs755071 showed little evidence of association with TL in our Bangladeshi population (P=0.92), and nor did SNPs in LD with rs755071 (see online supplementary figure S8). The association we observed between TL and our lead SNP in the RTEL1 locus is consistent by age, sex and cohort.
In addition to TERC, TERT and RTEL1, we observed five additional loci with SNPs passing a P value threshold of 1×10⁻⁵. These include 1q42.1 (rs1151814, P=2.0×10⁻⁶), 6p21.1 (rs9357354, P=1.4×10⁻⁶), 8p12 (rs75283006, P=1.7×10⁻⁵), 13q21.1 (rs9537514, P=4.4×10⁻⁶) and 15p11.15 (rs28790308, P=3.6×10⁻⁶ (table 2 and online supplementary figure S9). Only three of these five SNPs were tested in Codd et al 21 (1q42.1 (rs1151814), 6p21.1 (rs9357354) and 13q21.1 (rs9537514)), but none of these three were replicated in individuals of European ancestry based on the results from the ENGAGE consortium (see online supplementary table S5), although the MAFs for these SNPs are similar in European and South Asian populations.
Suggestive association signals (P<1×10⁻⁵) observed in a genome-wide association study (GWAS) of 6.3 million SNPs, 2000–2009 (n=5075)*
We tested all nine SNPs previously reported to be associated with TL in populations of European ancestry. Aside from replication of the TERT and TERC association signals already described, only rs8105767 in the ZNF208 region was observed to have a nominally significant P value (p=0.003) (see online supplementary table S6). However, the direction of association was consistent with prior studies for all nine SNPs (P=0.002, based on a binomial distribution).21
The SNP-based h2 estimate for TL using data on all subjects (including close relatives) was 27.5% (P=1.2×10⁻¹⁰) (table 3). We were unable to generate a non-zero h2 estimate using only ‘unrelated’ individuals, likely due to the small sample size at that threshold (n=1524, with no pairs having a coefficient of relationship <0.05). When we excluded first cousins and closer related individuals, the h2 estimate was 6%, although it was not significant (P=0.296). In analyses restricting to pairs with r≤0.25 (ie, excluding half sibs, aunts/uncles and closer relatives), the h2 estimate was 26% (P=0.0006). The SNP-based narrow-sense h2 estimate using the method described by Zaitlen et al 43 was 44.2% (P=2.7×10⁻¹⁴). This estimate captures the effects of rare variants but is prone to upward bias due to the effects of shared environment.
SNP-based heritability analysis with varying coefficients of relationship (r) thresholds using genotyped SNPS (~246K)
Discussion
In this paper, we report the first GWAS of TL conducted in a South Asian population. Prior GWAS of TL conducted primarily among individuals of European ancestry have reported significant associations at 10 loci: ACYP2 (2p16.2),21 TERC (3q26.2),20 21 26–29 NAF1 (4q32.2),21 TERT (5p15.33),21 OBFC1 (10q24.3),23 DCAF4 (14q24.2),24 CTC1 (17p13.1),25 ZNF208 (19p12),21 ZNF676 (19p12)25 and RTEL1 (20q13.3).21 Our study, conducted in a homogenous Bangladeshi population, replicated two TL-associated SNPs (in the TERC and TERT regions) and identified a novel association signal in the RTEL1 region, which is independent of the previously identified association signal in this region. Among the seven remaining previously reported loci, all showed associations that were directionally consistent with prior studies, but only one showed a nominally significant (P<0.05) association (rs8105767 (ZNF208) P=0.003). We observed five suggestive association signals that warrant follow-up in future studies, especially rs1151814 near the poly(ADP-ribose)polymerase 1 gene (PARP1), which is preferentially recruited to damaged telomeres by interacting with telomere repeat binding factor 2 (TRF2) and modifying the binding of TRF2 to telomeric DNA.44
While we did not replicate the association for the previously reported SNP in the RTEL1 region, the novel association signal we observe is best represented by rs2297439, which lies in intron 12 of RTEL1. In contrast, the previously reported signal near RTEL1 is best represented by rs755017, which is located ~140 kb downstream of the RTEL1 start site in exon 2 of ZBTB46. In both the BEB andEUR 1000 Genomes populations, the SNPs in rs755017 peak are not in LD with the SNPs in the rs2297439 peak (see online supplementary figure S6). Additionally, the MAF of rs2297439 in our Bangladeshi population (MAF=0.25) is substantially larger than in populations of European ancestry, ranging from 0.24 to 0.39 in the five South Asian 1000 Genomes populations (Gujarati Indian from Houston (GIH), Punjabi from Lahore, Pakistan(PJL), Bengali from Bangladesh (BEB), Sri Lankan Tamil from the UK (STU), and Indian Telugu from the UK (ITU)) to 0.11 in Southern Europe (Toscani in Italy (TSI) and Iberian Population in Spain (IBS)), 0.07 in Northern Europe (CEU+FIN+ GBR) and ≥0.07 in all other 1000 Genomes populations except Puerto Ricans from Puerto Rico (PUR) (MAF=0.12). This SNP was not reported in the ENGAGE consortium GWA study results. It is possible that we are underpowered to detect an association for the SNP in the RTEL1 region reported by Codd et al 21 (rs755017), as the Codd et al study reported a P value of 6.7×10⁻⁹ using a sample size of 37 684.22
Our lead RTEL1 SNP (rs2297439) resides in intron 12 of RTEL1. It also lies within a cis-eQTL (expression quantitative trait loci) affecting expression of STMN3 in transformed fibroblast cells (β=−0.68, P=2.8×10⁻⁹) (GTEx Analysis Release V6p) and is in LD with the lead SNP for this eQTL (r2=0.87). However, this SNP is not reported as a cis-eQTL in any other tissue type. Among the 10 SNPs in high LD (r2>0.8) with rs2297439, six reside in regions associated with enhancer histone marks across multiple tissue types (rs77552606, rs75031349, rs78430218, rs16983884, rs76636901 and rs143190905), and three of these variants (rs78430218, rs75031349 and rs76636901) are also located in regions associated with promoter histone marks in multiple tissues.45 Our lead SNP (rs2297439) is not in strong LD with the nearby variants that have been reported to be association with risk for glioma (rs6010620, r2=0.16) or ulcerative colitis (rs2315008, r2=0.10).
The variants we identified in the TERC (rs12638862) and TERT regions (rs7705526) are well known to be associated with leucocyte TL, and these genes have well-known roles in telomere maintenance. Our lead SNP in TERC has not been reported previously but is in LD with several additional previously reported lead SNPs, including rs10936599 (r2=0.87) and rs3772190 (r2=0.84), but less so with rs16847897 (r2=0.27) (based on BEB 1000 Genomesdata). Our lead SNP in TERT has been reported previously in a Korean cohort.22 Previously reported TERT SNP rs2736100 is in LD with our lead SNP (r2=0.57). Our lead TERC and TERT SNPs are located in intronic regions of TERC and TERT, respectively. Our lead TERC SNP (rs12638862) lies within cis-eQTLs affecting expression of RP11-362K14.6 in brain (P=2.0×10⁻⁷) and transformed fibroblasts (P=5.9×10⁻⁵), LRRC34 in transformed fibroblast (P=7.8×10⁻⁶), nerve (P=2.6×10⁻⁵), subcutaneous adipose (P=2.8×10⁻⁵) and heart (P=4.8×10⁻⁵), MYNN in testis (P=1.8×10⁻⁵) and LRRIQ4 in testis (P=6.9×10⁻⁵). However, our lead TERT SNP (rs7705526) does not appear to be a known cis-eQTL (based on GTEx Analysis Release V6p).
TL has been observed to be highly heritable.17 46–49 In our study population, which includes some close relatives, our SNP-based h2 estimate was 27.5% (P=1.2×10⁻¹⁰). The full narrow-sense h2 estimate was 44% (P=2.74×10⁻¹⁴), using the method described by Zaitlen et al.43 However, both of these estimates are prone to upward bias due to shared environment. While we were unable to estimate the h2 due to measured SNPs among unrelated individuals (due to small sample size), a recent study of unrelated older adults estimated that 28% of the variance of TL can be explained by common SNPs.47 Heritability estimates from prior twin studies are as high as 80% and range from 30% to 50% in sibling studies.46 48 49 A meta-analysis of six family-based studies found a substantial genetic component (h2=0.70, P=2.31×10−111).17 However, family-based estimates could be inflated by shared environment and may capture the effects of ‘trans-generational’ (ie, direct) transmission of telomeres from parent to offspring,50 not just the h2 due to inherited variation in non-telomeric sequence.
One limitation of the present study is using different methods to measure TL across cohorts (qPCR vs Luminex based). While both methods performed in our lab show strong correlations with Southern blot (the gold standard for TL measurement),38 40 the use of multiple methods can introduce heterogeneity into our TL measure. We addressed this limitation by implementing a mixed-effects model to remove experimental variation from both qPCR and Luminex-based measures and standardised the data to produce similar distributions of TL across all batches and methods. Additionally, while both of these methods are high-throughput and cost-efficient for large epidemiological studies, the values obtained are relative measures of average TL, as opposed to absolute measures. An additional limitation is our lack of a replication data set from this population; however, since our results focus primarily on regions well-known to affect TL, replication may not be as critical for our findings. A major strength of this study is the uniqueness and homogeneity of our study population, which provides the first genome-wide study of TL in a South Asian population.
In summary, this GWAS of TL in a South Asian population replicated two association signals observed in prior GWAS of European ancestry populations. The effects of variants in the TERC and TERT regions appear to be consistent across European and South Asian ancestry groups. Ancestry-based differences in allele frequencies allowed us to detect a novel association in the RTEL1 region, which is distinct from the prior association signal reported in this region. Additional research is needed to enhance our understanding of ancestry-based differences in the genetic architecture of TL.
Acknowledgments
The authors would like to sincerely thank all study participants and research staff that have contributed to this research.
References
Footnotes
Contributors Design of telomere length studies within Heals and Best: BLP; design of Heals and Best studies: HA; generation of genetic and molecular data: MGK, SR, MR, JS and MS; collection of data from study participants: MA, MR-Z, AA, TI, GS, MR and MY; quality control for telomere length measures: CZ; SNP data quality control and imputation: CZ and LT; data analysis and interpretation: BLP and DD; drafting the article: DD; critical revision of the article: all authors.
Funding This work was supported by the National Institutes of Health (R01ES020506, U01 HG007601, P42 ES10349, R01 CA107431, R01 CA102484, P30CA014599).
Competing interests None declared.
Ethics approval The institutional review boards of the University of Chicago and Columbia University, and the ethical committee of the Bangladesh Medical Research Council reviewed and approved these projects.
Provenance and peer review Not commissioned; externally peer reviewed.