Article Text

Abstract
Background Heterozygous mutations in CTCF have been reported in patients with distinct clinical features including intellectual disability. However, the precise pathomechanism underlying the phenotype remains to be uncovered, partly because of the diverse function of CTCF. Here we describe extensive clinical and genetic investigation for two patients with a microdeletion encompassing CTCF.
Methods We performed genetic examination including comprehensive investigation of X chromosome inactivation and DNA methylation profiling at imprinted loci and genome-wide.
Results Two patients showed comparable clinical features to those in a previous report, indicating that haploinsufficiency of CTCF was the major determinant of the microdeletion syndrome. Despite the haploinsufficiency of CTCF, X chromosome inactivation was normal. DNA methylation at imprinted loci was normal, but hypermethylation at CTCF binding sites was demonstrated, of which PRKCZ and FGFR2 were identified as candidate genes.
Conclusions This study confirms that haploinsufficiency of CTCF causes distinct clinical features, and that a microdeletion encompassing CTCF could cause a recognisable CTCF deletion syndrome. Perturbed DNA methylation at CTCF binding sites, not at imprinted loci, may underlie the pathomechanism of the syndrome.
- microdeletion
- X chromosome inactivation
- DNA methylation
Statistics from Altmetric.com
Introduction
Mutations in CTCF (CCCTC-binding factor; MIM 604167) were first reported by Gregor et al 1 in individuals with intellectual disability of varying severity, microcephaly and growth retardation. The CTCF gene is located at 16q22.1, and encodes a transcriptional regulator with 11 highly conserved zinc finger domains that bind different DNA target sequences and proteins, with methylation-sensitive binding sites located genome-wide.2 Once bound to DNA, CTCF can function as a transcriptional insulator, repressor or activator, depending on the context of the binding site.3 The imprinted regulation of H19 and insulin-like growth factor 2 (IGF2) expression involves binding of CTCF to the maternally hypomethylated imprinting control region (ICR).4 CTCF is also involved in X chromosome inactivation (XCI), which ensures the equality of X chromosome dosages in male and female mammals by silencing one X chromosome in the female.5 CTCF was shown to be involved in X chromosome counting, the first step of XCI, along with non-coding RNA Jpx, and thus haploinsufficiency of CTCF would result in aberrant XCI.6 Moreover, it is reported that CTCF binding is necessary to maintain the differential methylation of ICR.7 CTCF can affect cytosine methylation both locally, by binding to chromatin boundaries, and distally, through its long-range effects on DNA looping and three-dimensional chromatin architecture.8 9
Thus far, four CTCF mutations (mental retardation, autosomal dominant 21; MRD21; MIM 615502) have been reported: two frameshift mutations, one missense mutation and one gross deletion.1 It is considered that haploinsufficiency of CTCF leads to intellectual disability, the precise pathophysiology of which remains to be clarified.
In this study, we describe two girls with a heterozygous deletion encompassing CTCF. To uncover the underlying pathomechanism, we investigated XCI patterns, DNA methylation levels at multiple imprinted, differentially methylated regions (DMRs), and genome-wide DNA methylation patterns.
Methods
Study subjects and DNA samples
We analysed and reviewed two affected girls referred to us due to an unknown aetiology in their developmental delay. DNA was isolated from peripheral leucocytes according to standard procedures. For DNA methylation analyses, genomic DNA was subjected to bisulfite conversion using the EZ DNA Methylation Kit (Zymo Research, California, USA). This study was approved by the Ethical Committee for the Study of Human Gene Analysis at Nagoya City University Graduate School of Medical Sciences. Written informed consent was obtained from the parents.
Lymphoblastoid cell lines
Epstein-Barr virus-transformed human B lymphoblastoid cell lines (LCLs) were established from mononuclear cells isolated from peripheral blood and were used for RNA-FISH analyses. Cellular material were fixed on coverslips and prepared for RNA-FISH as previously described.10
Array CGH
We performed array comparative genomic hybridisation (CGH)using the Agilent oligonucleotide array-based CGH microarray kit (SurePrint G3 Human CGH Microarray Kit 2×400 K; Agilent Technologies, California, USA) according to the manufacturer’s protocol. Commercial female human genomic DNA was used as the control DNA. Following hybridisation and washing, the microarray slides were scanned using a G2505C microarray scanner (Agilent Technologies). The extracted features were analysed with Agilent CytoGenomics software (V.2.0.6.0; Agilent Technologies) using the SurePrint G3 Human CGH Microarray 4×180K design file (V.hg19). Copy number aberration calls were made with a minimum regional absolute average log2 ratio of 0.25 and a minimum contiguous probe count of 5. To confirm the results of array CGH, FISH was carried out using a FISH probe (16q22.1; RP11-421N4) that includes CTCF.
Androgen receptor gene DNA methylation
We used androgen receptor gene DNA methylation to analyse the XCI.11 Genomic DNA isolated from peripheral leucocytes was digested with the methylation-sensitive restriction endonuclease HpaII, and PCR was performed and analysed on a DNA sequencer (ABI310; Life Technologies, Waltham, Massachusetts, USA) as described previously.12
RNA-fluorescence in situ hybridisation
To investigate X inactivation patterns, we performed a three-colour RNA-FISH to examine XIST, which is only expressed on the inactive X chromosome: ATRX, an X-linked gene that marks the active X chromosome; and UTX, an X-linked gene that escapes X inactivation and is therefore used as a marker of both X chromosomes. Human BAC clones were selected from a genome database and purchased from BACPAC Resources at Children’s Hospital and Research Center (Oakland) as three target regions of FISH probes. The probe U region included the UTX gene (RP11-663F02 and RP11-711L08), the probe X region included XIST (RP11-13M9), and the probe A region included ATRX (RP11-631K10, RP11-42M11 and RP11-699M12). Each BAC clone was cultured and DNA was extracted using the standard alkaline lysis miniprep protocol and tested for correct chromosomal location by metaphase FISH using fixed preparation of normal female cells. About 0.5 µg of DNA from each probe was used for each hybridisation. Probe U, probe X and probe A were labelled using a nick-translation kit (Abbott, Illinois, USA) with SpectrumGreen-dUTP, SpectrumGold-dUTP and SpectrumRed-dUTP (Abbott), respectively, according to the manufacturer’s protocol with slight modifications. RNA-FISH analysis was performed as previously described13 with modifications, with denatured mixed FISH probes applied on undenatured preparations of each subject. RNA-FISH signals on nuclei were observed with a fluorescence microscope (Axioplan 2 imaging; Carl Zeiss, Germany) fitted with filter for three fluorochromes (SpectrumGreen, SpectrumRed and SpectrumGold), and evaluated with Isis fluorescence imaging system (MetaSystems, Germany).
Methylation analysis by MALDI-TOF MS
The DNA methylation status of 29 imprinted DMRs was analysed by matrix-assisted laser desorption/ionization mass spectrometry (MALDI-TOF MS) analysis with a MassARRAY system (Sequenom, San Diego, California, USA) using genomic DNA isolated from peripheral leucocytes as previously described.14 15 Briefly, each bisulfite-converted DMR was amplified by PCR using a primer set that includes a primer for the T7 promoter sequence at the 5ʹ end. In vitro transcription of the PCR product was performed with T7 RNA polymerase, and transcripts subjected to uracil-specific cleavage with RNase A. MALDI-TOF MS analysis of the cleaved fragments produced signal pattern pairs indicative of non-methylated and methylated DNA. EpiTYPER software (Sequenom) analysis of the signals yielded a methylation index (MI) ranging from 0 (no methylation) to 1 (full methylation) for each cleaved fragment, which contained one or more CpG sites. Aberrant methylation of each DMR was defined as the condition in which the difference of average MIs of the fragments between each patient and 24 normal children (12 boys and 12 girls) exceeded 0.15.
Methylation analysis by bisulfite pyrosequencing
The aberrant methylation status of DMRs identified by MALDI-TOF MS was validated by bisulfite pyrosequencing using QIAGEN PyroMark Q24 according to the manufacturer’s instructions (Qiagen, Germany) as previously described.14 15 As with MALDI-TOF MS analysis, aberrant methylation of each DMR was defined as the situation in which the difference of average MIs of CpG sites between each patient and 24 normal children (12 boys and 12 girls) exceeded 0.15.
Genome-wide array-based DNA methylation analysis
The concentration of DNA isolated from peripheral leucocytes was measured with the Quant-iT PicoGreen dsDNA Assay Kit (Life Technologies). Bisulfite reactions were performed using the EpiTect Plus DNA Bisulfite Kit (Qiagen) with an input of 1.5 µg of DNA. After bisulfite conversion, 300 ng of each sample was whole-genome-amplified, enzymatically fragmented and hybridised to the Illumina HumanMethylation450 BeadChip array, which contains probes to determine the DNA methylation levels of >480 000 CpG sites in a quantitative manner. After hybridisation, the BeadChip array was processed for the single-base extension reaction, stained and imaged on an Illumina iScan.
DNA methylation analysis
The methylation level for each of the >480 000 CpG sites was calculated using the GenomeStudio Methylation Module Software V.1.0 as β-value (β-value=intensity of the methylated allele/(intensity of the unmethylated allele+intensity of the methylated allele+100)). Probes with a detection p value of >0.05 or blank β-value were excluded from further analyses. Differences in the β-values (delta-β, Δβ) between target and control samples were interpreted as follows: Δβ≥0.2 and Δβ≤−0.2 were regarded as hypermethylated and hypomethylated, respectively. This is based on the fact that a Δβ detection sensitivity of 0.2 (95% CI) was previously estimated for >90% of 27 000 Infinium I assay probes.16 CpG sites were categorised into three categories according to their distance to the closest CTCF binding sites. The data set for CTCF binding sites was obtained from the ENCODE website (http://hgdownload.cse.ucsc.edu/goldenPath/hg19/encodeDCC/wgEncodeRegTfbsClustered/). When a single CpG site was assigned to multiple gene symbols or gene features, the corresponding β-value was used multiple times. R packages were used for data processing, statistical analysis and graphic visualisation.
Combined bisulfite restriction analysis
Bisulfite-PCR primers were designed using the MEthPrimer website (http://www.urogene.org/cgi-bin/methprimer/methprimer.cgi) for the PRKCZ and FGFR2 loci. The forward and reverse primer sequences, and the genomic interval (hg19) of the amplicon are: 5'-GGTTTTAGGGGGAGTAAATGGT-3', 5'-AAAAAACACAAACATCTCAACCC-3' and chr1:2 063 837–2 064 040 (204 bp) for the PRKCZ locus; and 5'-TTTATATTAGTGGATAAAAGTATGGTG-3', 5'-TTAAAAAACCCAACACAAACCTAAC-3' and chr10:123 355 486–123 355 870 (385 bp) for the FGFR2 locus. The thermal cycling conditions were 35 cycles of 95°C for 30 s, 55°C for 30 s and 72°C for 30 s, with an initial step of 95°C for 5 min and a final step of 72°C for 2 min. Bisulfite-PCR products of genomic DNA isolated from peripheral leucocytes were purified using Agencourt AMPure XP (Beckman Coulter Life Sciences, California, USA), and subjected to restriction enzyme digestion (HpyCH4IV for the PRKCZ locus, and BstUI for the FGFR2 locus).
Gene ontology analysis
Genomic regions identified as hypermethylated were tested for enrichment of gene ontology (GO) terms using the Genomic Regions Enrichment of Annotations Tool V.2.0.2 (http://bejerano.stanford.edu/great/public/html/).17 Parameters were set to ‘Single nearest gene, within 1000.0kb’. Binomial p values were displayed as bar charts. GO term analyses using gene symbols were performed using the Database for Annotation, Visualization and Integrated Discovery (http://david.abcc.ncifcrf.gov).18 As a cut-off for functional categories, we chose a p value of 0.05.
Results
Clinical features
Patient 1
Patient 1 is a 4-year-old Japanese girl with no family history of any relevant diseases. Her parents are non-consanguineous. She has three healthy older brothers. The girl was born by vaginal delivery at 39 gestational weeks without any perinatal abnormalities. At birth, she had a weight of 2515 g (−1.2 SD), length of 47.0 cm (−0.67 SD) and occipitofrontal circumference (OFC) of 31 cm (−1.6 SD). Growth impairment, developmental delay and microcephaly became apparent over time. She was able to hold her head up by 5 months, crawl at 2 years, stand while holding on to things at 3 years and walk while holding on to something at 4 years. At 4 years of age she had no meaningful words, and her Development Quotient Score was 19 (method: Kyoto Scale of Psychological Development19). She had dysmorphic facial features including hypertelorism, epicanthus, short philtrum, bilateral nail dysplasia of fifth fingers and bilateral short fifth fingers (figure 1A,B). Deep tendon reflexes and muscle tonus were normal. Head MRI, plasma amino acids, urine organic acids, blood gas analysis, lactate and pyruvic acid were normal. Conventional G-banded chromosome analysis revealed a normal karyotype of 46,XX.

Characterisation of the patients. (A,B) Patient 1 showed dysmorphic facial features including hypertelorism, epicanthus, short philtrum and thin upper lip. (C,D) Patient 2 showed similar dysmorphic facial features as well as horizontal eyebrows. Both parents gave consent for publication of these images. (E) Diagram showing the extent of deletion in the patients with a heterozygous deletion encompassing CTCF.
Patient 2
Patient 2 is a 6-year-old Japanese girl with no family history of any relevant diseases. Her parents are non-consanguineous. The girl was born by vaginal delivery at 39 gestational weeks without any perinatal abnormalities. At birth, she had a weight of 2490 g (−1.3 SD), length of 45.0 cm (−1.62 SD) and OFC of 31 cm (−1.6 SD). The placental weight was 396 g. Growth impairment and developmental delay became apparent over time. She was able to sit up without support at 1 year and 1 month, walk without support at 1 year and 11 months, and speak meaningful words at 1 year and 9 months. At 6 years of age her IQ score was 63 (method: Tanaka-Binet Test20). She had dysmorphic facial features including hypertelorism, epicanthus, short philtrum, thin upper lip, horizontal eyebrows and tapering fingers (figure 1C,D). She developed epileptic seizures and levetiracetam was started at 4 years. She had growth hormone deficiency and low muscle tone during early childhood, but muscle tone gradually improved. Results of head MRI studies, plasma amino acids, urine organic acids, blood gas analysis, lactate and pyruvic acid were normal. Conventional G-banded chromosome analysis showed a normal karyotype of 46,XX.
The clinical features of the two patients with a deletion of the CTCF gene are summarised in table 1.
Clinical features of patients with a CTCF deletion
Identification of deletions encompassing CTCF
Patient 1 had a 1.1 Mb deletion at 16q22.1 (67.1–68.2 Mb) and patient 2 had a 1.6 Mb deletion at 16q22.1 (67.3–68.9 Mb) (figure 1E). FISH with a probe complementary to sequence in CTCF confirmed the deletion in both patients. These deletions were not identified in their parents, indicating that the mutations arose de novo.
X inactivation pattern
To interrogate a possible association between the deletion of the CTCF gene and skewed XCI, we used an androgen receptor X inactivation assay (figure 2A). Both patients demonstrated random X inactivation with the ratio of XCI being 55:45 and 51:49, respectively. We next performed a three-colour RNA-FISH to examine the transcriptional status of X-linked genes, XIST, ATRX and UTX (figure 2B). XIST and ATRX RNA mark the inactive or active X chromosome, respectively. The majority of LCLs displayed a single nuclear spot of ATRX and XIST transcripts in patient-derived cells as well as control samples. Biallelic expression of XIST was not consistently observed. These results may indicate that a deletion of CTCF did not affect the state of XCI in LCLs derived from the patients.

XCI analysis by androgen receptor X inactivation pattern tracings and three-colour RNA-FISH. (A) The upper tracings represent the undigested DNA (HpaII−) from two patients; the lower tracings represent DNA digested with HpaII prior to PCR (HpaII+). The relative intensity of the two alleles after digestion represents the androgen receptor X inactivation pattern for each individual (expressed as a ratio and normalised to the undigested samples). (B) Diagrams of the three-colour RNA-FISH results. Each signal in interphase cells was counted. Over 85% of cells showed normal patterns. Xist biallelic expression was not observed. XCI, X chromosome inactivation.
Methylation analyses of imprinted DMRs by MALDI-TOF MS and bisulfite pyrosequencing
We screened DNA methylation status of 29 imprinted DMRs using the MALDI-TOF MS analysis, as previously reported.15 Then, we used bisulfite pyrosequencing to validate any aberrant methylation. MALDI-TOF MS analysis identified three DMRs, specifically a gain of methylation in MEST and GNASXL in patient 1, and IGF2-DMR2 in patient 2. However, bisulfite pyrosequencing could not confirm the aberrant methylation, indicating that methylation of imprinted DMRs remained normal in the patients.
Genome-wide DNA methylation changes
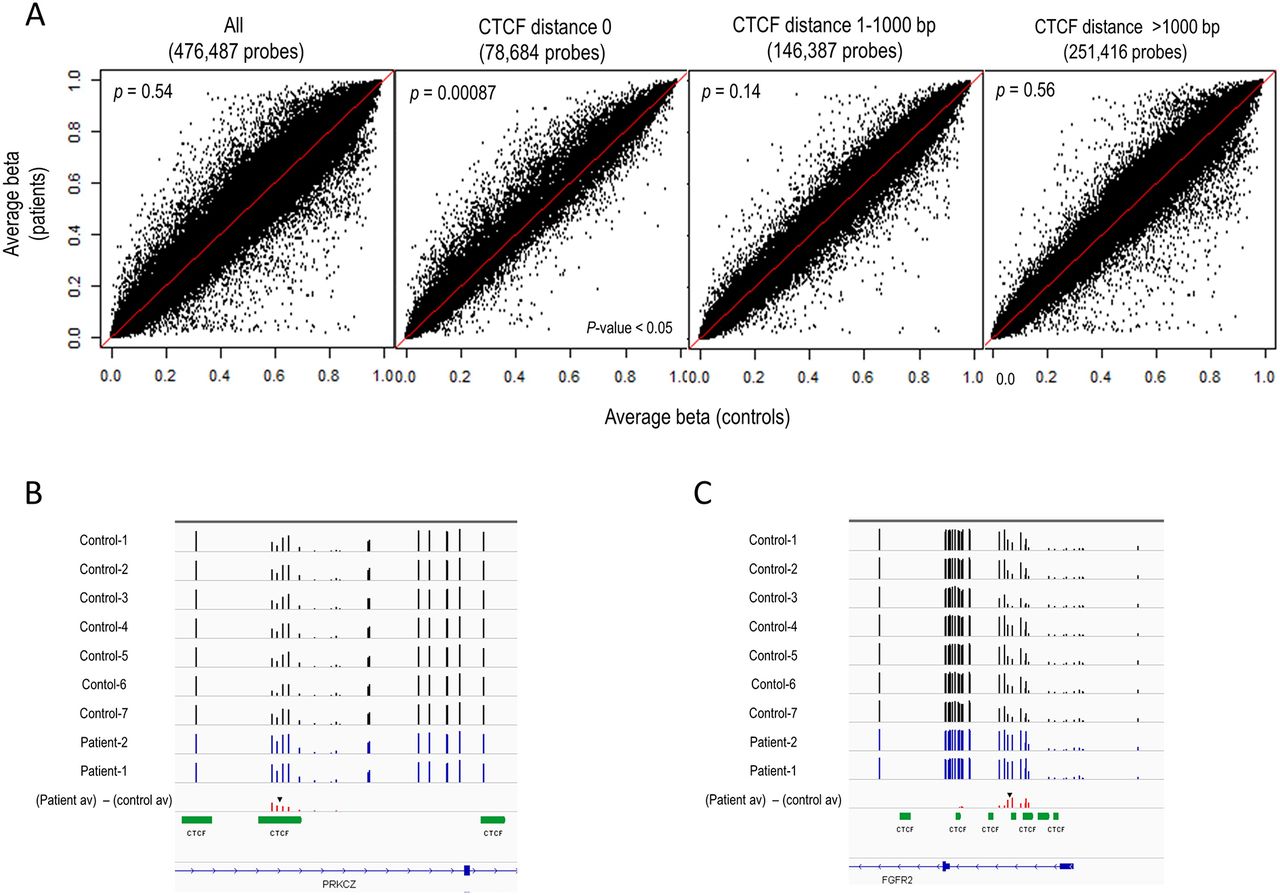
We obtained DNA methylation profiles using Infinium HumanMethylation450 BeadChip arrays. To investigate whether DNA methylation levels differ depending on the distance from CTCF binding sites, we categorised 450K probes into three categories — ‘CTCF distance 0’ (CTCF binding site), ‘CTCF distance 1–1000 bp’ (1–1000 bp from a CTCF binding site) and ‘CTCF distance >1000 bp’ (over 1000 bp from a CTCF binding site) — using CTCF binding site information obtained by the ENCODE project (http://genome.ucsc.edu/ENCODE/downloads.html). The number of CpG sites in ‘CTCF distance 0’, ‘CTCF distance 1–1000 bp’ and ‘CTCF distance >1000 bp’ was 78 684, 146 387 and 251 416, respectively. Scatter plot representation of the average β-values of the two patients compared with that of seven normal female children controls (median age: 10 years, range 6–14) revealed that DNA methylation levels tended to be higher in the patients than controls at the CpG sites within ‘CTCF distance 0’ category, but not at the CpG sites outside of CTCF binding sites (figure 3A). Consistent with the appearance of the scatter plots, Wilcoxon rank sum tests detected a statistically significant difference between the distribution of the average DNA methylation levels between the patients and the controls only in the ‘CTCF distance 0’ category (p=0.00087), but not in the other categories. These results demonstrate that alteration in DNA methylation at CTCF binding sites occurs in patients with a heterozygous deletion of CTCF. The number of the probes that show hypermethylation (Δβ≥0.2) in both patients in the ‘CTCF distance 0’ category was 299. Evaluating our set of 299 hypermethylated probes with regard to GO terms, we found no specific terms. Out of 299 probes, two genes, PRKCZ and FGFR2, were brain-related genes (figure 3B,C). According to the ENCODE data, only 3 out of 69 cell lines showed CTCF ChIP (chromatin immunoprecipitation)-seq peaks at FGFR2 locus, while 51 cell lines showed CTCF ChIP-seq peak at PRKCZ locus. We validated the hypermethylation at CTCF binding sites (figure 3B,C) observed in the patients at the PRKCZ and the FGFR2 loci by the combined bisulfite restriction analysis method (online supplementary figure 1).
Supplementary file 1
DNA methylation differences. (A) DNA methylation differences in patients (y-axis) compared with control samples (x-axis). Scatter plots of the average β-values of the patients and the controls for all probes and each of the three subcategories: ‘CTCF distance 0’, ‘CTCF distance 1–1000 bp’ and ‘CTCF distance >1000 bp’. p Values were shown within each panel. (B) DNA methylation data at PRKCZ locus. (C) DNA methylation data at FGFR2 locus. The approximate position of CpG site(s) assayed by combined bisulfite restriction analysis (see online supplementary figure 1) is shown by the black inverted arrowhead in (B) and (C).
Discussion
We identified two patients with a heterozygous deletion encompassing CTCF. Gregor et al 1 reported that intellectual disability, microcephaly and growth retardation are shared clinical features in patients with a CTCF mutation. In our study, both patients showed comparable features to those in the previous report. Our patients also showed hypertelorism, epicanthus, thin upper lip and abnormalities of fingers, which also appeared in the reported patients, indicating that haploinsufficiency of CTCF may produce a recognisable clinical syndrome.1 It is of note that our patients showed similar phenotypes to those in previously reported patients even though they carried different-sized deletions. Therefore, at least in our patients, CTCF appeared to be a major determinant of the phenotype, and other deleted genes may not have significant dosage-sensitive effects. The previous study theorised the clinical features in the reported patients were due to haploinsufficiency due to mutation, yet it was not clearly proven. Thus, our patients with a deletion encompassing CTCF would serve as an invaluable model to investigate effects of CTCF haploinsufficiency.
In this report, we demonstrated that patients with a heterozygous deletion of CTCF showed normal random XCI pattern. Sun et al 6 suggested that the Jpx:CTCF ratio induces Xist transcription only when a critical threshold is exceeded. The findings of the present study suggest that single allele deletion of CTCF might fail to reach a critical threshold and not alter Xist transcription. Previously, Donohoe et al 21 reported that 20% of Xist + nuclei showed biallelic expression in Oct4-deficient embryonic stem (ES) cells, although Xist biallelic expression was not observed in the Ctcf-knockdown ES cells.21 The pluripotent factor OCT4 directly binds Xite and Tsix, which encode two long non-coding RNAs (lncRNAs) that suppress the silencer lncRNA, Xist, and regulate XCI by triggering X chromosome pairing and counting.22 It is known that Epstein-Barr virus transformation and cell culturing cause epigenetic and even genetic changes.23 24 Therefore, our RNA-FISH results using LCLs may not represent those of untransformed blood cells. However, Epstein-Barr virus-transformed LCLs usually show demethylation and leaky expression of silenced genes.23 24 Thus, strict maintenance of monoallelic expression of XIST and ATRX in LCLs from the patients with a heterozygous deletion of CTCF and from normal controls implies the maintenance of normal XCI in LCLs. It is controversial whether CTCF haploinsufficiency affects XCI in whole tissues or specific parts of tissues including blood cells. Our study indicates that at least a heterozygous deletion of CTCF does not alter XCI in blood cells.
In this study, we revealed that DNA methylation levels in our patients were higher than those of controls at CTCF binding sites, while imprinted DMRs methylation was normal. Kemp et al 25 observed that hemizygous loss of Ctcf destabilised DNA methylation at epigenetically variable CpGs in normal lung tissue of mice, and divergent CpGs from Ctcf +/− lungs were significantly shifted towards cytosine hypermethylation and showed increased variance in methylation. Furthermore, they found significant hypermethylation in Ctcf +/− samples that extended to ~2 kb regions surrounding divergent CpGs.25 The above findings are consistent with our findings, which showed that patients with a heterozygous CTCF deletion showed a higher methylation level genome-wide. The present findings also support Kemp et al’s study that suggested a role of CTCF in maintaining stability of cytosine methylation patterning.25 It is assumed that only small portion of CTCF binding sites were hypermethylated because only 299 probes in 78 684 probes were hypermethylated in both patients. Another group performed ChIP-seq and reported that the peak of CTCF binding sites per gene density was clearly higher in the genomic regions containing downregulated genes than in those with upregulated or similarly expressed genes by ChIP-seq in individuals with CTCF haploinsufficiency.1 Our findings suggest that CTCF haploinsufficiency could induce aberrant methylation at CTCF binding sites, altering gene expression, which could be an underlying pathomechanism of the disorder caused by a CTCF deletion.
The probes in the PRKCZ and FGFR2 genes met the following three conditions: located at CTCF binding sites, hypermethylation (Δβ≥0.2) in both patients and brain-related. It is less likely that FGFR2 affects phenotype in a heterozygous deletion of CTCF because the number of cell lines showing a CTCF ChIP-seq peak at the FGFR2 locus was small.
PRKCZ (protein kinase C, zeta form) is an atypical member of the PKC family. Atypical protein kinase C (aPKC) isoforms ζ and λ interact with polarity complex protein, Par3, and are evolutionarily conserved regulators of cell polarity.26 There are two aPKC genes in the vertebrate genome, Prkcl and Prkcz, which code for three distinct proteins. Prkcl encodes aPKC-λ, and Prkcz codes for aPKC-ζ and the alternatively transcribed PKM-ζ. Parker et al 27 reported that the localisation of these isoforms is spatially distinct in a polarised embryonic hippocampal neuron. Furthermore disruption of aPKC isoforms expression pattern alters neuron polarity and axon specification, suggesting that mutually antagonistic intermolecular competition between aPKC isoforms directs the establishment of neuronal polarity.26 This implies that pathogenesis of a CTCF heterozygous deletion may be driven by silencing PRKCZ, which alters cell polarity.
In conclusion, we identified heterozygous deletions encompassing CTCF and propose CTCF deletion syndrome as a recognisable clinical entity. Perturbed DNA methylation at CTCF binding sites, not at imprinted loci, may underlie the pathomechanism of the syndrome, and PRKCZ would be a candidate gene responsible for the phenotype.
Acknowledgments
The authors thank the patients and their parents for participating in this study.
References
Footnotes
Contributors SS was responsible for the concept and design of the study. IH and SS drafted the main manuscript. IH, RK, KN, HW, KenH, JT, KO, KW, KeniH, HS and KK analysed and interpreted the data. DI, KO, YN, AH, YS, KK and SS contributed clinical data. RK, KN, KW, HS and KK revised the manuscript and made comments on the structure, details and grammar of the article.
Funding This study was partially supported by the Program for an Integrated Database of Clinical and Genomic Information from the Japanese Agency for Medical Research and Development (AMED) (SS).
Competing interests None declared.
Patient consent Parental/guardian consent obtained.
Ethics approval This study was approved by the institutional review board of Nagoya City University Graduate School of Medical Sciences.
Provenance and peer review Not commissioned; externally peer reviewed.