Article Text

Abstract
Genome-wide association studies (GWAS), using single nucleotide polymorphisms (SNPs), have yielded 110 non-human leucocyte antigen genomic regions that are associated with multiple sclerosis (MS). Despite this large number of associations, however, only 28% of MS-heritability can currently be explained. Here we compare the use of multi-SNP-haplotypes to the use of single-SNPs as alternative methods to describe MS genetic risk. SNP-haplotypes (of various lengths from 1 up to 15 contiguous SNPs) were constructed at each of the 110 previously identified, MS-associated, genomic regions. Even after correcting for the larger number of statistical comparisons made when using the haplotype-method, in 32 of the regions, the SNP-haplotype based model was markedly more significant than the single-SNP based model. By contrast, in no region was the single-SNP based model similarly more significant than the SNP-haplotype based model. Moreover, when we included the 932 MS-associated SNP-haplotypes (that we identified from 102 regions) as independent variables into a logistic linear model, the amount of MS-heritability, as assessed by Nagelkerke's R-squared, was 38%, which was considerably better than 29%, which was obtained by using only single-SNPs. This study demonstrates that SNP-haplotypes can be used to fine-map the genetic associations within regions of interest previously identified by single-SNP GWAS. Moreover, the amount of the MS genetic risk explained by the SNP-haplotype associations in the 110 MS-associated genomic regions was considerably greater when using SNP-haplotypes than when using single-SNPs. Also, the use of SNP-haplotypes can lead to the discovery of new regions of interest, which have not been identified by a single-SNP GWAS.
- Clinical genetics
- Multiple sclerosis
- Genome-wide
This is an Open Access article distributed in accordance with the Creative Commons Attribution Non Commercial (CC BY-NC 4.0) license, which permits others to distribute, remix, adapt, build upon this work non-commercially, and license their derivative works on different terms, provided the original work is properly cited and the use is non-commercial. See: http://creativecommons.org/licenses/by-nc/4.0/
Statistics from Altmetric.com
Introduction
Multiple sclerosis (MS) is a complex genetic disorder,1 ,2 susceptibility to which involves the major histocompatibility complex (MHC) on the short arm of chromosome 6.3–8 In addition, on the basis of several large genome-wide associations studies (GWAS), analysing hundreds of thousands of single nucleotide polymorphisms (SNPs), 110 non-MHC risk-variants have now been identified as being MS-associated.9–16 Nevertheless, despite the abundance of these defined genetic associations, there still exists a large amount of the MS genetic risk, which remains unexplained (ie, the so-called heritability gap). Thus, using Nagelkerke's R-squared17 metric to assess the strength of association, one large study reported that these 110 non-MHC risk-variants accounted for 18% of the variance in disease occurrence.16 This estimate only increased to 27% after the MHC was included in the analysis.16 Using an alternative method for assessing the strength of association, these authors estimated that the 110 non-MHC risk-variants only accounted for 20% of the sibling recurrence risk (λS) and that this estimate increased to 28% when the MHC effects were included.16
Such a large discrepancy between the variance explained by GWAS identified SNP-associations and the total expected genetic burden (ie, the missing heritability) is a common finding in many complex genetic disorders.1 ,2 In MS, however, a much better accounting is anticipated.18 ,19 One possible reason for this persistent gap may be the use of single-SNPs rather than longer haplotypes to define disease associations.9–16 Thus, a typical GWAS interrogates approximately 500 000 SNPs in scattered locations throughout the genome and identifies those SNPs, which are significantly associated with the disease. Although some of the SNPs identified in this manner may actually represent the genetic alteration responsible for the disease association, most of these SNPs merely ‘tag’ an allele of a nearby gene (or a haplotype of a genetic region), which is actually the basis of the observed disease relationship. This type of association has been referred to as a ‘synthetic’ association.20 However, because each SNP can tag more than one haplotype, these synthetic associations are often weak, require thousands of patients to uncover, and their SNPs typically have a greater allelic frequency than the underlying susceptibility allele.20 ,21 Thus, in reality, these SNP associations only identify genomic regions of interest for disease association. Therefore, in the present study, we explore whether the use of haplotype methods can reduce the heritability gap compared with single-SNP methods when these are both applied to the previously identified MS-associated genomic regions.15 ,16
Materials and methods
Study participants, genotyping and quality control
The study cohort was assembled as a prospective multicentre, multinational effort and included 18 872 controls and 11 376 cases with MS. The cohort make-up, genotyping and quality control methods have been described in detail previously.15 ,16 The various alleles in the human leucocyte antigen (HLA) region on the short arm of chromosome 6 were imputed for the entire study cohort (by AL) using the HLA imputation with attribute bagging (HIBAG) method for the loci HLA A, B and C and for the loci DRB1 and DQB1.22 In addition, phasing, including the phasing for all five HLA loci as well as that for just the DRB1 and DQB1 loci, was done using a previously published and validated algorithm.23 ,24 Data access was granted by the Wellcome Trust Case Control Consortium.
Statistical methods
Phasing
The SNPs used for phasing covered a span of 1 megabase (mb) of DNA surrounding the SNP that had the most significant disease association in each of the 110 non-MHC regions (identified on GWAS). Phasing was accomplished using an approach similar to that of Clark.25 Thus, both methods identify unequivocal haplotypes in an identical manner. However, unlike Clark, we use a probabilistic approach to phasing, for which the phasing output is independent of the order of data entry.21 In fact, our method provides very stable and consistent phasing estimates over short genomic windows of 2–15 SNPs.21 For reasons of computational efficiency, the previous visual basic algorithm was replaced by an R-project version,26 which was highly concordant (>99%) with that reported earlier.21 In those rare instances where the two algorithms lead to different phasing choices, each of the haplotypes in the two possible combinations were uncommon and the calculated likelihood of each possible combination was approximately equal.
Briefly, haplotypes were phased at sliding windows of 2–15 SNPs in each of the 110 MS regions. Also for reasons of computational efficiency, even-sized windows of more than four SNPs were excluded. For each sliding window, for each individual, all possible pairs of haplotypes are considered. An individual was assigned a haplotype based on a three-pass algorithm. In the first pass, unambiguous individuals (those who were homozygotes or heterozygotes at only a single-SNP within the haplotype) were phased, thereby providing an initial set of identified haplotypes. In the second pass, each of the remaining individuals was phased if their genotype could be produced only by a single haplotype combination, which included either one or two of the previously identified haplotypes. Individuals who had more than one such possible haplotype combination were not phased at this stage. The complete set of haplotypes from individuals who were phased the first and second passes was then used to calculate the allele frequencies for all identified haplotypes. In the third pass, remaining individuals were phased based on the relative likelihood of each possible combination of two haplotypes, which in turn was based on the allele frequencies determined following the second pass. For the purpose of calculating these likelihoods, potential haplotypes (not identified in the first or second passes) were assigned an allele frequency equal to a tenth of the smallest observed allele frequency for an identified haplotype.
The choice of a maximum length of 15 SNPs for constructing the SNP-haplotypes was made purely for reasons of computational efficiency as the phasing speed of the algorithm becomes markedly prolonged with longer haplotype lengths.
Association testing
Disease association tests were undertaken for each of the SNP-haplotypes (of differing lengths), which were constructed at each SNP position over the 1 mb span of DNA, for each of the 110 regions identified earlier in the published GWAS.15 ,16 Association tests, using Fisher's exact methods, were conducted for each SNP-haplotype according to three different genetic models. These were the dominant, recessive and genotype models (see online supplementary table S1).
Comparisons of single-SNPs to multi-SNP-haplotypes using adjusted p values
We calculated the disease association for every single-SNP (haplotype size=1) and for every multi-SNP-haplotype (haplotype size=2–15) in each of the 110 regions. In each region, the top single-SNP ‘hit’ (most statistically significant variant) was compared with the top multi-SNP-haplotype ‘hit’. The multi-SNP-haplotype p values were Bonferroni-corrected for the total number of haplotypes tested in the region, while the single-SNP p values were corrected for the total number of single SNPs tested in the region. Regions in which the two analysis methods (single-SNPs vs multi-SNP-haplotypes) yielded adjusted p values that differed by more than two or three orders of magnitude (ie, more that 100-fold or 1000-fold more significant), were considered to favour the method that resulted in the greatest adjusted statistical significance (figure 1).
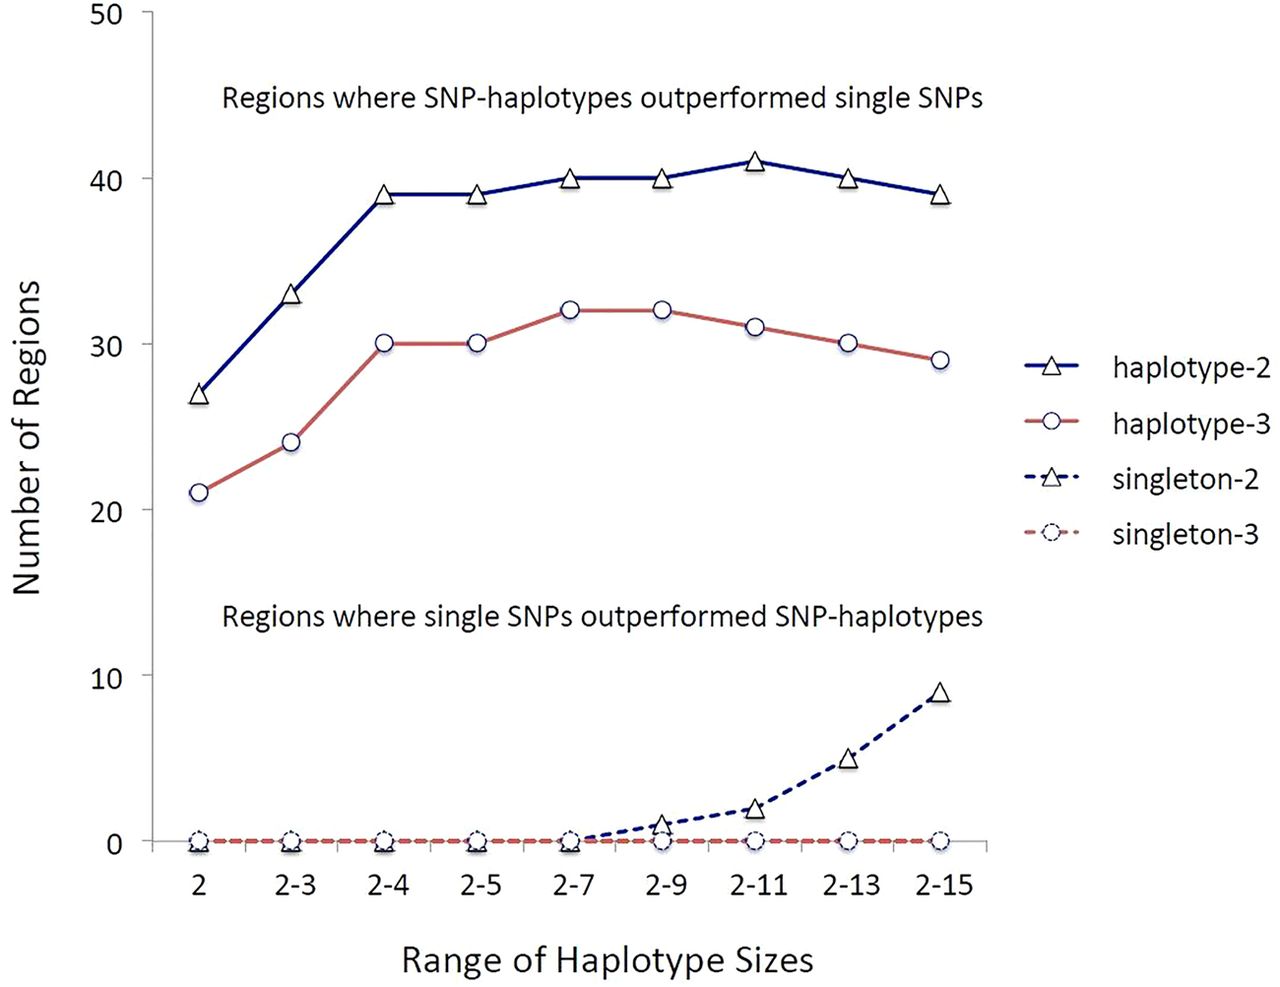
The strength of the multiple sclerosis (MS)-associations comparing single-nucleotide polymorphisms (SNPs) to multi-SNP-haplotypes in the 110 MS-associated regions identified by genome-wide association studies (GWAS) (1718). The designations haplotype-2 and haplotype-3 refer to those circumstances in which the ‘top’ haplotype-association was more significant (adjusted) than the ‘top’ single-SNP-association by two or three orders of magnitude, respectively. Similarly, the designations singleton-2 and singleton-3 refer to circumstances in which the ‘top’ single-SNP-association was more significant than the ‘top’ haplotype-association by two or three orders of magnitude, respectively. The y-axis represents the total number of regions in which these particular circumstances occurred. The x-axis indicates the range of multi-SNP-haplotype sizes considered. In all cases SNP-haplotypes outperformed single-SNPs. Because the sets of larger haplotype sizes had a much larger number of identified haplotypes than the sets of smaller haplotype size, these sets were subjected to a much more stringent Bonferroni correction. As a result, these larger sets didn't perform as well compared with single-SNPs as those sets, which included haplotypes of nine SNPs or less.
Determining heritability
For the purposes of this data analysis, cases and controls were split randomly into two halves. Disease-associated SNP-haplotypes were identified in the training set (split A), and cross-validated using these same haplotypes to assess heritability in the test set (split B).
The p values for the OR for disease association were calculated for each haplotype at every SNP-position in the region and adjusted by the false discovery rate (FDR) method of Benjamini and Hochberg27 for the total number of comparisons in the region. The first ‘hit’ was defined as the most significantly associated SNP-haplotype (of any length up to 15 SNPs, including length=1; ie, a single-SNP). If no SNP-haplotype was less than the FDR maximum (set at 0.05), the region was excluded from further analysis. Also, all SNP-haplotypes that possessed SNPs, which overlapped (in position) with any SNP in this first ‘hit’ haplotype were excluded from further analysis. If the p value for the most significant remaining SNP-haplotypes was below the FDR maximum, then a second ‘hit’ was identified as the most significant haplotype and again all haplotypes with overlapping SNPs were excluded from further analysis. This process was repeated either until all remaining SNP-haplotypes exceeded the FDR maximum for the region or until the number of associated SNP-haplotypes identified in a region exceeded 10. For comparison purposes, we also repeated the same process using only single-SNPs (haplotype length=1) in each of the 110 regions.
Weights were assigned to each associated haplotype such that heterozygous carriers were assigned a risk score equal to the natural log of the OR of the (1 vs 0) genotype model (see online supplementary table S1) at that location. By contrast, homozygote carriers were assigned a risk score equal to the natural log of the OR of the (2 vs 0) genotype model (see online supplementary table S1) at that location (if such a model was available).
Disease-associated haplotypes using SNP-haplotypes of any length (up to 15 SNPs, including single-SNPs) and those using exclusively single-SNPs were considered separately. For both methods of defining haplotype-length, those SNP-haplotypes, which were identified as being disease-associated by the above procedure, were analysed collectively for their contribution to the heritability of MS by their inclusion as independent variables, in a logistic linear model where the dependent variable was the presence or absence of MS.
For the HLA region of chromosome 6, SNP-haplotypes were not used in this linear model despite the fact that these haplotypes had very specific allelic associations in this genomic region (see online supplementary material). Indeed, the SNP-haplotype associations in this region of the genome are quite instructive with regards to the importance of haplotype identification to the understanding of genetic susceptibility for MS (see online supplementary material). Moreover, the lessons derived from this particular region (where many of the relevant alleles are already well known) are likely to be especially applicable to other regions (which are less well defined). As just one example of this, the HLA haplotype of DRB1*1501/DQB1*0602, which is strongly linked to the (a1) SNP-haplotype (see online supplementary material), has long been associated with a marked (and dose-dependent) increase in disease risk. However, when this same HLA haplotype occurs coupled to either the (a27) or the (a36) SNP-haplotype, the result seems to be, if anything, protective rather than risky. By contrast, in those rare individuals, who had the (a1) SNP-haplotype, but not the DRB1*1501/DQB1*0602 haplotype, the increase in disease risk is indistinguishable from that of other (a1) carriers (see online supplementary material). Taken together, these observations suggest that the increased disease risk is not due to either of these alleles but, rather, to something else carried on the (a1) SNP-haplotype (see online supplementary material). Other distinctive SNP-haplotype-genotype associations are also considered in the online supplementary material.
Nevertheless, because the actual disease associations for alleles in the HLA region are better understood than in the other genomic regions, and because alleles of the six classical HLA genes can be imputed using the HIBAG method,22 the actual disease-associated alleles, together with their interactions with DRB1*1501, were used for the purpose of this analysis (see online supplementary material). However, only those reported associations and interactions that were confirmed in the current data set for HLA alleles of the A, B, C, DRB1 and DQB1 loci were included in this analysis (see online supplementary material).
Nagelkerke's R-squared was used as the measure to judge the success of the classification for the 110 genomic regions and HLA loci, separately and combined.
Results
Multi-SNP haplotypes consistently outperformed the single-SNPs, even after we Bonferroni-adjusted the significance levels based on the greater number of multi-SNP-haplotype tests conducted compared with those for single-SNPs. Thus, in 32 regions multi-SNP-haplotypes outperformed single-SNPs by three orders of magnitude or more and in no region did single-SNPs similarly outperform multi-SNP-haplotypes of any length (figure 1). Similarly, if outperformance is considered to be a difference by only two orders of magnitude, the multi-SNP-haplotypes still consistently outperformed single-SNPs (figure 1). Nevertheless, because there were many more identified haplotypes at longer compared with shorter SNP-haplotype lengths, those sets, which included these longer SNP-haplotypes, were subjected to a much more stringent Bonferroni correction and, as a result, sets including more than nine SNPs sometimes didn't perform as well compared with single-SNPs (figure 1).
An example of the kind of improvements that can be made by the use of multi-SNP-haplotypes, and as shown in table 1, the previously identified top single-SNP ‘hit’15 in a region on the long arm of chromosome 6 was for SNP (rs11154801_A). Possessing one or more copies of this SNP (compared with having no copies) had an OR for disease association of 1.2 with a p value of 2×10⁻¹⁸. Nevertheless, the most significant ‘hit’ overall for the region was a seven-SNP haplotype (table 1), which did not include the SNP (rs11154801_A). This particular multi-SNP-haplotype had an OR for disease association of 8.9 with a p value of 5×10−44. The most significant single-SNP within this haplotype was (rs1475069_C), which had an OR of 1.2 and a p value of 3×10⁻¹⁶. This particular single-SNP was the fourth most significant disease-associated SNP in the region, it was also significant at a genome-wide level, and it is located 317 kilobases (kb) away from the top single-SNP ‘hit’ (rs11154801_A). Moreover, the most significant identified SNP-haplotype, which included the risk SNP (rs11154801_A), had a length of 3, an OR of 1.2 and an uncorrected p value of 8×10⁻¹⁹. Finally, the three SNP-haplotype including (rs11154801_A) and the seven SNP-haplotype including (rs1475069_C) were significantly disassociated from each other by Fisher's exact test. Thus, these two disease-associated SNP-haplotypes are clearly identifying distinct genetic associations within the same genomic region.
Chromosome 6 (long arm) associations*
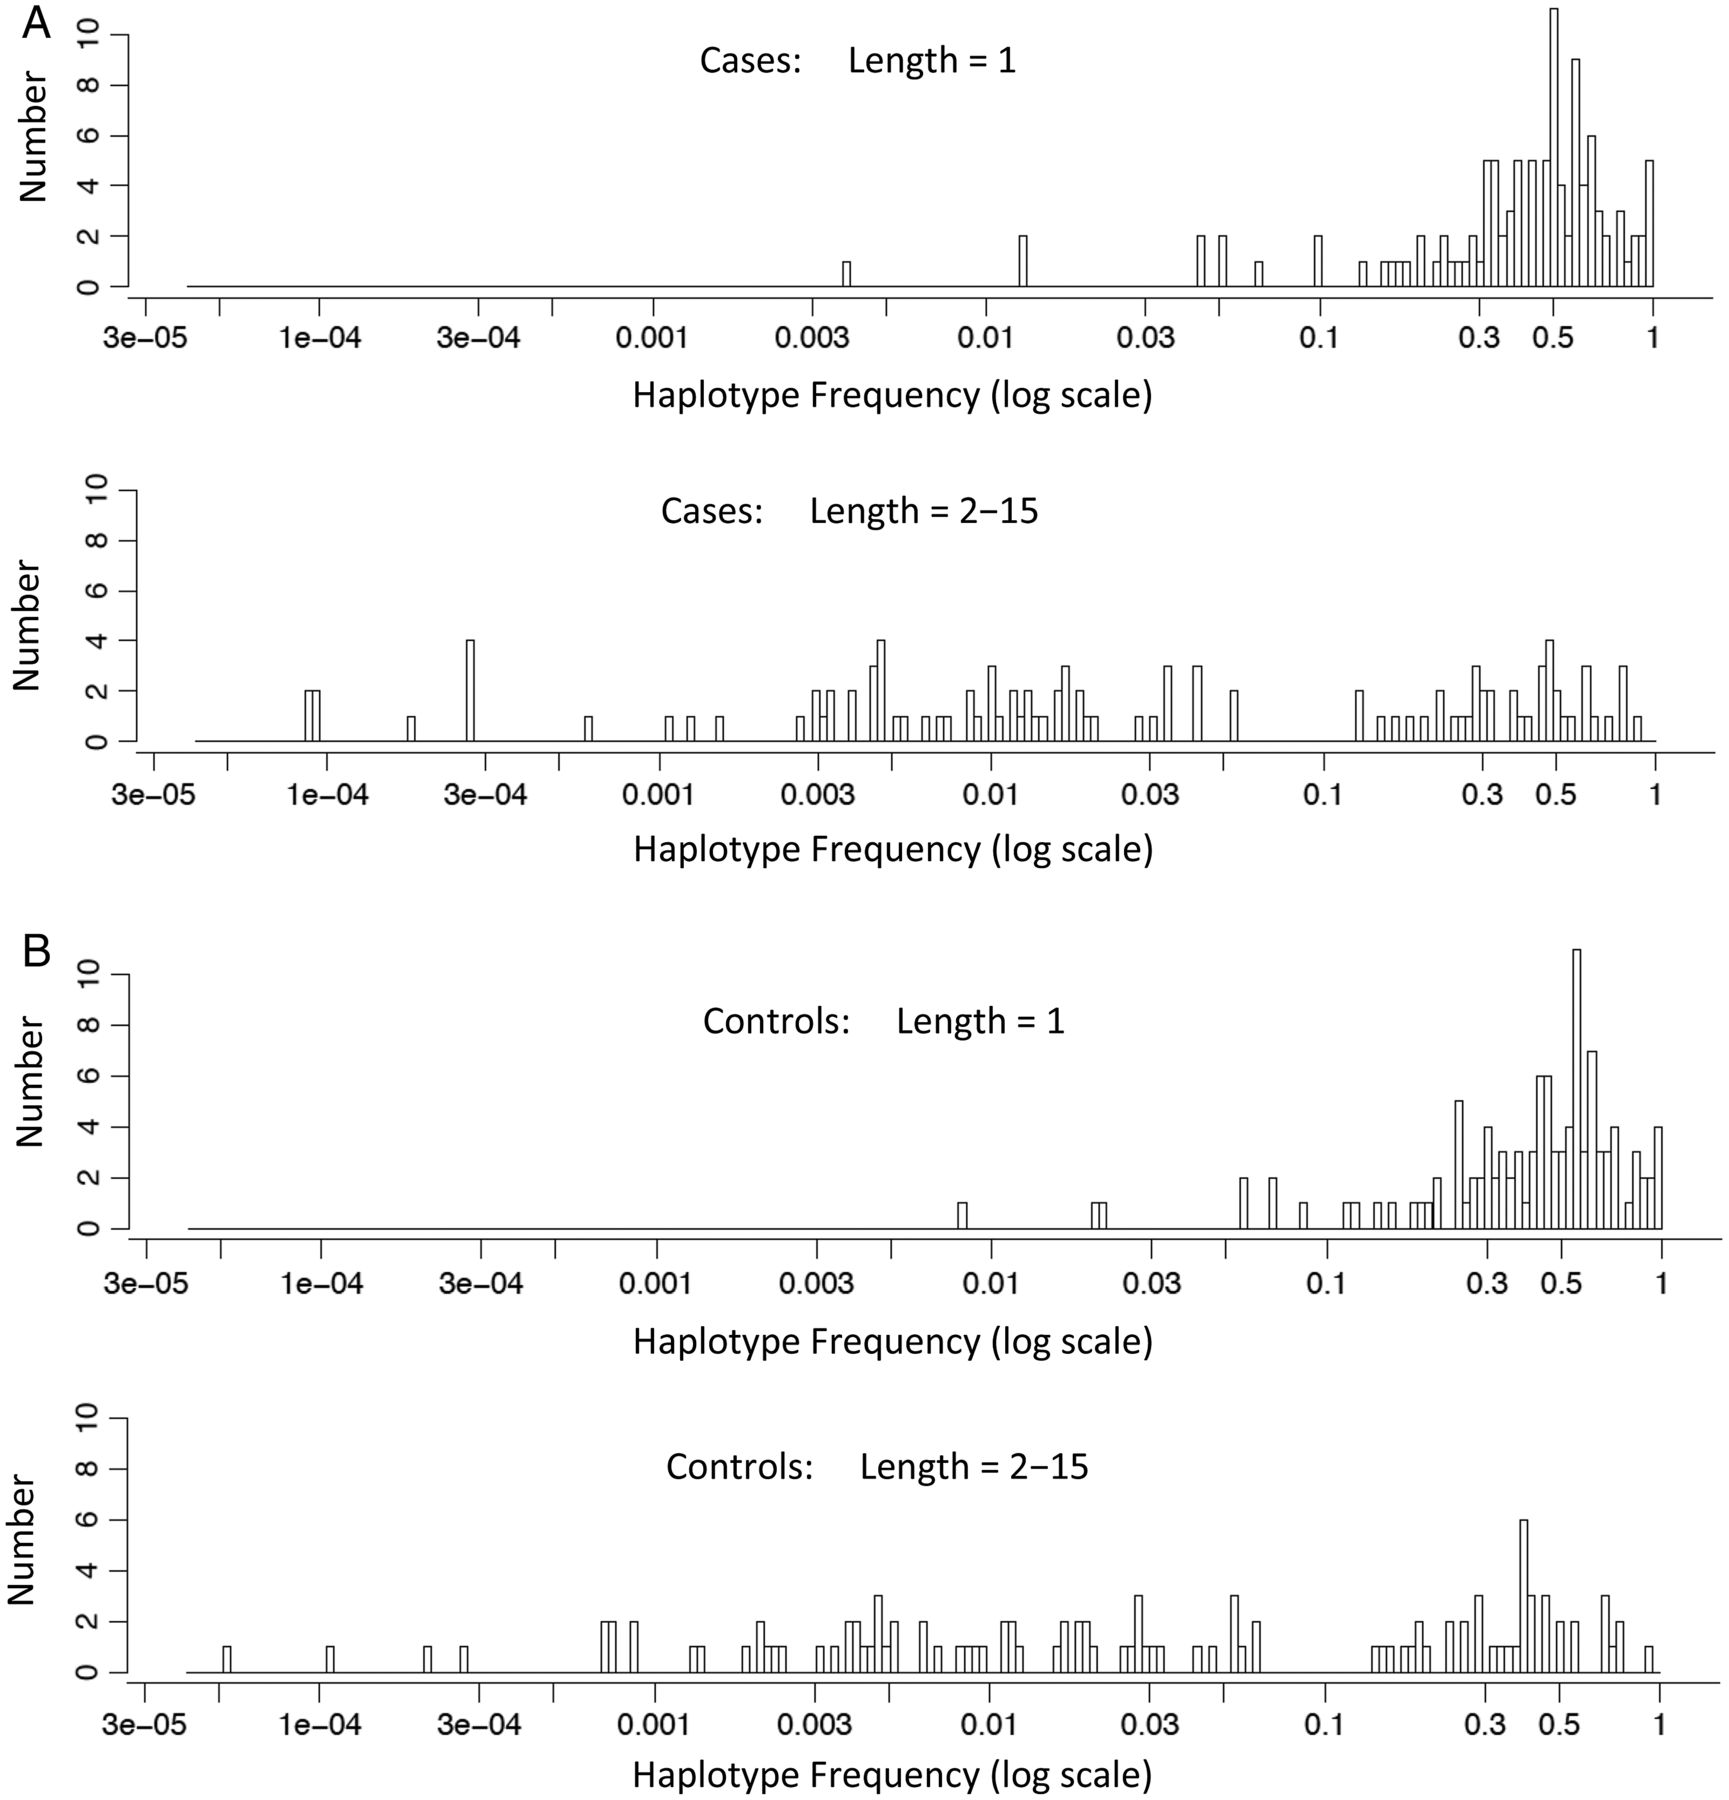
By definition, the greater number of alleles in multi-SNP-haplotypes compared with single-SNPs requires that the range of allelic frequencies for the top ‘hits’ in the different regions, in general, is shifted to lower haplotype frequencies for the multi-SNP-haplotypes compared with single-SNPs. This expected pattern of more low-frequency multi-SNP-haplotypes compared with single-SNPs is evident in the data (figure 2).

The haplotype frequencies of the top ‘hits’ in cases and controls are shown on the x-axis (log-scale) in panels (A) and (B), respectively. In each panel, the frequencies are shown for single-nucleotide polymorphisms (SNPs) (SNP-haplotype length=1) and for multi-SNP-haplotypes (SNP-haplotype lengths=2–15). On the y-axis is shown the number (count) of different haplotypes that were present at the different mean haplotype frequencies.
In our analysis for determining the heritability, we identified 932 SNP-haplotypes of varying sizes from 102 regions as being MS-associated (see online supplementary table S1). The average probability that our algorithm correctly identified a person's SNP-haplotype combination (based on the haplotype frequencies taken from the set of known diplotypes—see Methods) was 98%. Of these 932 MS-associated haplotypes, 66 (7%) were single-SNPs and the remainder consisted of multi-SNP-haplotypes of varying sizes (figure 3). From this set, using the SNP-haplotypes of nine SNPs or fewer identified in the 110 non-MHC regions yielded a Nagelkerke's R-squared of 0.412 in the training set (split A). When HLA was included in the model, this increased to R2=0.482. Using the same set of SNP haplotypes identified in the training set (split A) for the test set (split B), these numbers decreased to 0.289 and 0.377, respectively (table 1). By contrast, when exclusively using single-SNPs in the 110 non-MHC regions, the generalised linear model yielded a Nagelkerke's R-squared of 0.255 on the training set (split A) and when HLA was included in the model, this increased to R2=0.344. In line with what was previously reported,16 and similar to the circumstance for multi-SNP-haplotypes presented above, these numbers decreased to 0.185 and 0.291, respectively (table 1), when the same linear model was run on the test set (split B). A reanalysis, which included only the DRB1*1501 status as a representation for the entire HLA region, did not alter the nature of these relationships.

Histogram of the different haplotype sizes for the 932 multiple sclerosis (MS)-associated single-nucleotide polymorphism (SNP)-haplotypes identified at the 110 non-major histocompatibility complex MS-associated genomic regions (see online supplementary table S1). On the y-axis is the per cent of the total haplotypes represented by each haplotype size. On the x-axis is the number of SNPs included in each identified SNP-haplotype (ie, the haplotype size).
Discussion
This study demonstrates, unequivocally, that SNP-haplotypes can be used to fine-map the genetic associations within regions of interest previously identified by single-SNP GWAS. Even after adjusting the significance levels for the larger number of statistical comparisons made when using the SNP-haplotype method, in 32 of 102 regions, the disease associations detected by multi-SNP-haplotypes were at least 1000-fold more significant than those detected by single-SNPs (figure 1). By contrast, in no region was the single-SNP based model similarly more significant than the SNP-haplotype based model (figure 1). Moreover, as the example provided by table 1 indicates, the nature of the disease associations identified, can be markedly altered, even within a previously defined genomic region. Finally, the amount of the heritability of MS explained by the associations in these 110 genomic regions was markedly improved using SNP-haplotype methods compared with only single-SNPs (table 2).
Nagelkerke's R-squared (R2) values for the different data splits
Several factors might affect the heritability estimated such as population stratification, the linkage disequilibrium (LD) structure, the allelic frequency, and the coding/non-coding status of the variants and each of these require consideration. With regards to population stratification, the potential impact is mitigated in two ways. First, we confined our analysis to only those genomic regions, which had been previously (and consistently) identified by GWAS, after correction for population stratification effects, as having an established association signal present (1718). Second, population stratification in these regions will impact single-SNPs and SNP-haplotypes equally and should not, therefore, affect our comparison of single-SNPs to SNP-haplotypes. Nevertheless, in any genome-wide study, which seeks to identify novel regions of association signal using SNP-haplotype methods, a correction for population stratification is imperative. These studies are currently underway and, in them, we intend to use two different adjustment methods. In the first, we will use a subset of the Wellcome Trust Case Control Consortium population, in which the controls and the cases are derived from the same population. In the second, we will undertake a principal components analysis to identify the relevant population factors and then use these factors in a linear modal to adjust for population stratification effects.
With regards to LD, again, this structure will be the same for SNPs and SNP-haplotypes and should not, therefore, affect our comparison of single-SNPs to SNP-haplotypes. Also, alleles at single-SNPs are more frequent than alleles for SNP-haplotypes (figure 2), and therefore are more likely to give higher heritability estimates. Consequently, the fact that we found higher heritability estimates with SNP-haplotypes, despite their relative rarity, actually strengthens our finding that SNP-haplotypes perform better than single-SNPs. Finally, SNP-haplotypes with window-sizes of 2–15 SNPs cover regions of DNA of approximately 20–300 kb and generally include (within their span) the exons from one or more genes. By contrast, most single-SNPs come from intronic or non-coding regions (eg, see online supplementary material). Indeed, this particular distinction is probably what accounts for the better performance of SNP-haplotypes compared with single-SNPs that we report here (see online supplementary material).
In the recent International Multiple Sclerosis Genetics Consortium study,16 credible sets of SNPs (rather than single-SNPs) were proposed for a handful of regions (four regions with two to four SNPs are shown in table 3 from that publication) and it is possible that an analysis using sets of single-SNPs in a region might perform better than an analysis using just a single-SNP. It is, therefore, important to note that our method did, in fact, allow for such sets of single SNPs to contribute to heritability. Thus, our method looked at a window-size of 1 mb in each region and it allowed sets of up to 10 single-SNPs to be chosen (ie, included in the analysis) per region. In addition, our method allowed for the identification of shorter haplotypes, a method that permits the ‘clustering’ of related haplotypes that carry a similar disease risk. Also, as noted earlier, our method is limited by computational limitations to considering haplotypes of 15 SNPs or less in length. Despite this, however, our method can be modified easily to cover larger or smaller portions of the genome, for example, by simply using a SNP-set that spans a greater or lesser genomic distance. We have not yet explored this possibility.
Chromosome 13 associations*
Nevertheless, despite the improvements provided by our SNP-haplotype method, a considerable amount (over 60%) of the heritability of MS still remains to be explained. As noted earlier, at a theoretical level, we expect much better accounting. Thus, no more than 8.5% (and probably much less) of the general populations in the northern hemisphere can possibly be genetically susceptible to getting MS and, very likely, the large majority of patients with MS fall into this susceptible group.18 ,19 There are, at least, four potential reasons why the heritability of MS remains elusive.
First, it is expected that, in the future, there will be more genomic regions identified as being disease associated based on single-SNP GWAS analyses. Therefore, inclusion of these regions in this analysis may improve matters. However, because these additional regions, generally, will have been identified with increasingly weaker associations, they will likely contribute relatively little to the overall accounting of the heritability of MS. Second, it is apparent from the HLA region on chromosome 6 that alleles of certain sets are tightly linked to very specific SNP-haplotypes and, moreover, there can be several disease-associated haplotypes at a single locus (see online supplementary material). This situation leads to many apparent (or real) interactions, which take place between different alleles at one locus and between alleles at different loci (see online supplementary material). If this pattern of complexity in the HLA region is repeated at many or all of the 110 different loci identified so far, then the multi-SNP haplotype method presented here (in which we didn't explore either the possibility of multiple disease-associated haplotypes at a single locus or the possibility of such interactions), even though a substantial improvement over single-SNP methods, may still be an inadequate representation of the genetic susceptibility in these genomic regions. Third, and related to the second point, it may be that only certain combinations of susceptibility haplotypes from different genomic regions actually lead to genetic susceptibility for developing MS.
Finally, it may be that some low-frequency haplotypes are strongly MS-associated but because of the expected reduction in the observed OR that occurs with synthetic associations,20 ,21 the most significant single-SNP in a region may not achieve genome-wide significance and, thus, important disease associations may be missed. For example, of the 110 non-MHC regions that reached genome-wide significance, only one was located on chromosome 13.16 Nevertheless, in one particular region on this chromosome, 49 mb removed from the region previously identified,16 the most significant ‘hit’ within a 1 mb span surrounding the SNP rs3116605_G was for a four-SNP-haplotype, which included this SNP (table 3). This particular multi-SNP-haplotype had an OR of 10.5 for disease association with a p value of 3×10−43. Moreover, this finding was clearly replicated in both of the random splits of the data (table 3). If other such strong associations exist in other unidentified parts of the genome it may be necessary to reconsider how genomic regions of interest are identified for complex genetic diseases. Perhaps it would be better to screen the entire genome by a multi-SNP-haplotype analysis rather than by using a single-SNP GWAS. Alternatively, because of the computational difficulties involved, perhaps the whole genome could still be screened using short-length multi-SNP-haplotypes at a threshold such that approximately 500–1000 regions of greatest interest are identified. Subsequently, then, these regions of greatest interest could be subjected to a multi-SNP-haplotype analysis presented here, which would make the overall computations much more tractable.
Previously, we compared our SNP-haplotype phasing method21 to another such method, SHAPEIT-2,28 which itself combines the phasing methods of SHAPEIT29 and IMPUTE-2.30 When using SNP-information, which spanned a total distance of 2 mb, the outputs from SHAPEIT-228 and our method21 were characterised by alternating peaks and valleys of concordance, which varied between 75% and over 99% depending upon the region being phased. Even within the regions of high concordance, however, some phasing discrepancies between methods did occur. In every such case, the SNP-haplotype method predicted combinations that were more probable than the SHAPEIT-2 predictions (often by several orders of magnitude), even when the haplotype frequencies were estimated from the SHAPEIT-2 output.21 In addition, in the regions of poor correspondence between the two methods, SHAPEIT-2 had a similarly low correspondence with itself when the start of the phasing for the 2 mb region was shifted by 25 SNPs.21
At a theoretical level, it might be argued that using very small window sizes of two or three SNPs ignores important phasing information from flanking data. It is for this reason SHAPEIT-2 and similar algorithms specifically incorporate this flanking information28–30 and, in fact, LD has sometimes been reported at distances of 500 kb or more. For example, in the HLA region of the genome, the (a2) and (a6) SNP-haplotypes exhibit an extended LD, which stretches for 2.7 mb, and which, in each case, is significantly associated with disease (see online supplementary material). Indeed, such an extended LD implies a strong positive selection pressure for the haplotype carrying this particular suite of alleles. Nevertheless, the internal inconsistency of SHAPEIT-2 outweighs any such theoretical advantage of using larger window sizes.21 Importantly also, excluding window sizes of two and three SNPs did not alter our results and, in many cases, these short haplotype sizes were sufficient to explain the disease risk, which was also explained by longer haplotypes (of which the shorter segments were, almost always, subsets with the same phasing). Consequently, the inclusion of smaller window sizes in the analysis is important, especially given the relative computational ease of running phasing and performing association tests on small compared with large window sizes.
Naturally, the fact the SHAPEIT-2 phasing over 2 mb windows (a size generally accepted to be suitably large for this phasing method) is inconsistent with itself when the phasing is started 25 SNPs later, doesn't prove that our method is accurate. However, because this inconsistency (for SHAPEIT-2) was prevalent throughout the 2 mb region21 and was not confined to the edges, it cannot be dismissed as merely an ‘edge effect’. Moreover, in those short genomic regions where SHAPEIT-2 was highly consistent with itself (ie, more than 99% concordant), our method was also concordant (>99%) with SHAPEIT-2. Thus, in these ‘high-concordance’ regions, the two methods independently confirm the accuracy of the phasing by each method. The phasing methods only disagreed in regions where SHAPEIT-2 also disagreed with itself.21 Moreover, in contrast to SHAPEIT-2, our probabilistic method provided very stable and consistent phasing estimates over short genomic windows of 2–15 SNPs throughout the entire 2 mb phasing window.21
Again, this doesn't prove that our method is accurate in these ‘low-concordance’ regions; rather it only proves that SHAPEIT-2 is inaccurate in these regions. Indeed, it is nearly impossible to compare any phasing method with the ‘actual’ phasing. Even whole genome sequencing methods cannot yield accurately phased genotypes of more than 1000 base pairs.31 Furthermore, the currently accepted industry standard in phased data uses the methods of SHAPEIT-2 to establish the ‘correct’ phasing and, consequently, cannot serve as an appropriate gold standard by which to compare the accuracy of any alternative phasing method. In these circumstances, one is forced to choose a phasing method based on other considerations.
For all of these reasons, therefore, we chose to use our phasing method applied to short haplotypes of 2–15 SNPs for our analysis. Regardless, however, it is important to recognise that the decision about which phasing method to use makes no difference to the results of the haplotype analysis presented here. Any errors introduced by incorrect phasing (either by our method or by SHAPEIT-2) will only serve to blur the association signal and will lead to findings of no association when, in fact, an association exists (ie, to a false negative result). By contrast, when a significant association is found, the accuracy of the phasing method used becomes irrelevant.
In summary, the use of phased SNP-haplotypes is clearly superior to the use of single-SNPs in the detection of genetic associations in MS and is also likely to be for other complex genetic disorders. Nevertheless, even using this SNP-haplotype method, a substantial amount of the heritability remains to be explained. There are several possible reasons for this unexplained variance in disease expression and each of these possibilities will need to be systematically investigated in the future.
References
Supplementary materials
Supplementary Data
This web only file has been produced by the BMJ Publishing Group from an electronic file supplied by the author(s) and has not been edited for content.
- Data supplement 1 - Online supplement
- Data supplement 2 - Online tableS1
Footnotes
Contributors DSG: conceived of the analysis, analysed the data, wrote the manuscript; PK: conceived of the analysis, analysed the data, critically read the manuscript; P-AG: critically read the manuscript; AL: critically read the manuscript.
Competing interests None declared.
Patient consent Obtained.
Ethics approval University of California, San Francisco.
Provenance and peer review Not commissioned; externally peer reviewed.
Data sharing statement The data is provided in an online supplementary table.
PHASING ALGORITHM The R version of the phasing algorithm used for this study is freely available either on the UCSF website (www.msgenes.ucsf.edu) or upon request from the authors.