Article Text

Abstract
Background Rett syndrome (RTT), a neurodevelopmental disorder that primarily affects girls, is characterised by a period of apparently normal development until 6–18 months of age when motor and communication abilities regress. More than 95% of individuals with RTT have mutations in methyl-CpG-binding protein 2 (MECP2), whose protein product modulates gene transcription. Surprisingly, although the disorder is caused by mutations in a single gene, disease severity in affected individuals can be quite variable. To explore the source of this phenotypic variability, we propose that specific MECP2 mutations lead to different degrees of disease severity.
Methods Using a database of 1052 participants assessed over 4940 unique visits, the largest cohort of both typical and atypical RTT patients studied to date, we examined the relationship between MECP2 mutation status and various phenotypic measures over time.
Results In general agreement with previous studies, we found that particular mutations, such as p.Arg133Cys, p.Arg294X, p.Arg306Cys, 3° truncations and other point mutations, were relatively less severe in both typical and atypical RTT. In contrast, p.Arg106Trp, p.Arg168X, p.Arg255X, p.Arg270X, splice sites, deletions, insertions and deletions were significantly more severe. We also demonstrated that, for most mutation types, clinical severity increases with age. Furthermore, of the clinical features of RTT, ambulation, hand use and age at onset of stereotypies are strongly linked to overall disease severity.
Conclusions We have confirmed that MECP2 mutation type is a strong predictor of disease severity. These data also indicate that clinical severity continues to become progressively worse regardless of initial severity. These findings will allow clinicians and families to anticipate and prepare better for the needs of individuals with RTT.
- genotype-phenotype
- MeCP2
- Rett syndrome
- RTT
Statistics from Altmetric.com
Introduction
Rett syndrome (RTT; OMIM entry #312750) is an X-linked neurodevelopmental disorder affecting 1.09 per 10 000 females by the age of 121 and can be clinically divided into typical and atypical forms. Typical RTT is characterised by apparently normal development until 6–18 months when acquired hand and language skills are lost and gait abnormalities and hand stereotypies begin to manifest.2 Other symptoms include respiratory dysfunction, impaired sleep, autonomic symptoms, growth retardation, small hands and feet, and a diminished pain response.2 A diagnosis of atypical RTT is given to individuals who exhibit several features of RTT, but do not exhibit all the essential clinical criteria of typical RTT. Atypical RTT represents the least and most severe forms of RTT and includes three named forms: preserved speech variant, early seizure variant and congenital variant. The preserved speech variant was described by Zappella3 and includes mildly affected individuals who can walk, talk and draw. 4 In contrast, individuals with the congenital variant never acquire the ability to speak and have difficulty sitting.5 Thus, RTT represents a wide range of clinical presentations.
Despite this phenotypic variability, greater than 95% of those with typical RTT and approximately 75% of cases with atypical RTT have a mutation in a single gene: methyl-CpG-binding protein 2 (MECP2).6 ,7 MeCP2 binds to methylated cytosines in DNA to either activate or repress transcription8 and contains three functional domains: (1) a methyl-binding domain (MBD) on the N-terminus allowing binding to DNA,9 (2) a nuclear localisation sequence allowing trafficking of MeCP2 to the nucleus10 and (3) a transcriptional repression domain (TRD), which modulates gene transcription. At present, 1013 distinct MECP2 mutations have been documented, resulting in 738 unique amino acid changes spread throughout these three functional domains (RettBASE: IRSF MECP2 Variation Database, http://mecp2.chw.edu.au).
Given the phenotypic variability observed in RTT, we and others have hypothesised that the degree of clinical severity is secondary to the type of MECP2 mutation. Several groups have reported genotype–phenotype correlations in RTT, and there has been consensus in recognising that p.Arg133Cys, p.Arg294X, p.Arg306Cys and 3′ truncations are less severe6 ,11–16 and that p.Thr158Met, p.Arg168X, p.Arg255X, p.Arg270X and large deletions are more severe.6 ,11 ,14 ,15 On the whole, large-scale analyses of other MECP2 mutation types and symptomatology have been challenging due to small participant sample sizes, variable diagnostic criteria and the cross-sectional nature of the phenotypic data. Additionally, atypical RTT has received relatively little attention due to small participant cohorts.
In the current study, we sought to overcome some of these challenges by analysing the largest cohort of individuals with RTT to date, divided into typical and atypical presentations, at several time points. We studied 1052 genotyped participants who were examined at 4940 different visits at tertiary care hospitals by experienced physicians all using the exact same diagnostic criteria. We found novel genotype–phenotype associations for both typical and atypical RTT, demonstrate that clinical severity increases with age for most mutation types and show that ambulation, hand use and age at onset of stereotypies are strongly associated with overall disease severity.
Methods
Study participants
We recruited 1052 participants who were genotyped and examined over 4940 separate visits. About one-fourth of these individuals were previously analysed and presented in a prior publication.6 Participants were examined at either the University of Alabama at Birmingham, Baylor College of Medicine, Greenwood Genetic Center, or Boston Children's Hospital or at travel site visits attended by the same clinicians. A clinical severity score (CSS) was calculated at each visit using the following 13 criteria: age of onset of regression, somatic growth, head growth, independent sitting, ambulation (independent or assisted), hand use, scoliosis, language, non-verbal communication, respiratory dysfunction, autonomic symptoms, onset of stereotypies and seizures, as previously described.6 ,17 ,18 Of the 1052 participants, 963 met the clinical criteria for either typical or atypical RTT.
Data management and statistics
Data were tabulated in Microsoft Excel, analysed in SAS and graphed in Origin 8.5.0. Clustered Poisson regression was used to estimate the association between the CSS, or the individual components of the CSS, and types of MECP2 mutations. A Poisson model was deemed appropriate given the ordinal nature of the CSS; the clustered nature of the model was necessary to account for the inclusion of multiple measurements per participant. Using this model, the CSS and its individual components could be compared between subclasses both overall and within age groups. Additionally, for each subclass, the association between the CSS versus age, and separately, time was estimated. As in previous reports, corrections for multiple comparisons were not made when comparing the CSS.11 ,19 A Tukey–Kramer multiple comparisons correction was applied when comparing the individual components of the CSS. For all tests, significant differences with a p<0.05 are reported. Data are presented as average±SD.
Results
Characteristics of study participants
Our dataset included 1052 participants seen at the University of Alabama at Birmingham, Baylor College of Medicine, Greenwood Genetic Center, and Children's Hospital Boston, or the respective travel site visits, of whom 815 (77%) had a diagnosis of typical RTT. Of those with typical RTT, average age of diagnosis was 4.1±4.5 years and average age of study enrolment was 9.9±8.9 years. Clinical progress was documented for these 815 participants over 4016 separate visits to the physician. Using their MECP2 mutation status, we separated the participants with typical RTT into 16 mutation groups: the eight most common point mutations (p.Arg106Trp, p.Arg133Cys, p.Thr158Met, p.Arg168X, p.Arg255X, p.Arg270X, p.Arg294X and p.Arg306Cys), 3′ truncations, deletions (including single nucleotides or short sequences), exon 1 mutations, insertions, large deletions, other point mutations, splice sites and no mutation. Approximately 96% (786/815) of typical RTT cases had a MECP2 mutation, with 58% (473/815) of these being one of the eight most common point mutations. Less than 1% of participants were categorised into two different mutation groups (7/815 with typical RTT); these participants were excluded from the analysis.
Atypical RTT was diagnosed in 14% (148/1052) of this patient population, having an average age of diagnosis at 5.8±6.2 years. These participants were enrolled in our study on average at 9.1±7.9 years of age and examined at 646 separate clinical visits. Participants meeting a diagnosis of atypical RTT were categorised into 15 MECP2 mutation groups: the eight most common point mutations (p.Arg106Trp, p.Arg133Cys, p.Thr158Met, p.Arg168X, p.Arg255X, p.Arg270X, p.Arg294X and p.Arg306Cys), 3′ truncations, deletions, exon 1 mutations, insertions, large deletions, other point mutations and no mutation. As compared with typical RTT, more participants with atypical RTT had no MECP2 mutation (24%). Less than 1% of participants with atypical RTT were classified into two mutation groups (1/148) or were male (1/148).
CSSs in typical RTT
We developed and have used for more than 10 years a clinical severity scale based on previously published reports,6 ,17 ,18 assessing onset of regression, growth, motor skills, communication skills, respiratory dysfunction, autonomic symptoms and epilepsy for study participants across multiple clinic visits. Using this scale, many genotype–phenotype associations in typical RTT were observed. On the whole, mutation subclasses could be bisected into less severe MECP2 mutations and more severe MECP2 mutations. Table 1 lists the average CSS for all MECP2 mutation groups, and all significant differences between MECP2 mutation groups are presented in the matrix in figure 1A (p<0.05 in green cells). Mutations in p.Arg133Cys, p.Arg294X, p.Arg306Cys, exon 1, 3′ truncations and other point mutations were associated with a lower CSS (table 1 and figure 1A). In contrast, p.Arg106Trp, p.Arg168X, p.Arg255X, p.Arg270X, splice sites, large deletions, insertions and deletions had higher scores (table 1 and figure 1A). Both p.Thr158Met and the no mutations group were characterised by an intermediate disease severity. Less severe mutations on average were diagnosed later at about the age of 5 (table 1; see p.Arg133Cys, p.Arg294X, p.Arg306Cys, exon 1, 3′ truncations and other point mutations), while more severe mutations were diagnosed earlier, usually by age 3 (table 1; see p.Arg168X, p.Arg255X, insertions and deletions).
Characteristics of study participants with typical and atypical RTT

Clinical severity score is dependent on methyl-CpG-binding protein 2 (MECP2) mutation status in participants with typical Rett syndrome. (A) Matrix of p-values for comparisons of all MECP2 mutation groups. All significant differences (p<0.05) are in green, and non-significant differences are in red. (B, C) Clinical severity scores subdivided by age for each mutation type. The five age groups are 0–4, 5–8, 9–15, 16–20 and >20 years.
CSS across age in typical RTT
Participants were grouped according to age (0–4 years, 5–8 years, 9–15 years, 16–20 years and >20 years), and the associations between and within these age groups were assessed. As depicted in figure 1B, the eight most common point mutations were subdivided into two broad groups: a less severe group, including p.Arg133Cys, p.Arg294X and p.Arg306Cys, and a more severe group, including p.Arg106Trp, p.Thr158Met, p.Arg168X, p.Arg255X and p.Arg270X. At 0–4 years of age, p.Arg133Cys, p.Arg294X and p.Arg306Cys had an average CSS of 16.8 as compared with p.Arg106Trp, p.Thr158Met, p.Arg168X, p.Arg255X and p.Arg270X, which had an average CSS of 22.9. This demonstrates that less/more severe mutations begin with a less/more severe phenotype early in development. Among those >20 years of age, the average CSS increased in p.Arg133Cys, p.Arg294X and p.Arg306Cys to 21.8, which is approximately the clinical severity of the more severe mutations at age 0–4 years of age. p.Arg106Trp, p.Thr158Met, p.Arg168X, p.Arg255X and p.Arg270X on average increased to a score of 26.6 in individuals >20 years of age. Additionally, 3′ truncations mirrored the age-related changes of less severe point mutations, including p.Arg133Cys, p.Arg294X and p.Arg306Cys, while large deletions and deletions were most similar to the severe point mutations (figure 1C).
We also found a significant positive association between CSS and age in individual mutation groups. Among those with 3′ truncation (p<0.0001), p.Arg133Cys (p<0.01), p.Thr158Met (p<0.05), p.Arg168X (p<0.001), p.Arg255X (p<0.0001), p.Arg270X (p<0.05), p.Arg306Cys (p<0.001), deletion (p<0.01), large deletions (p<0.05) and splice sites (p<0.05) mutations, CSS increased across age groups (figure 1B,C). However, we found no significant association between age and p.Arg106Trp, p.Arg294X, insertions, other point mutations and no mutations (p>0.05; figure 1B,C).
Given that individual participants were examined over multiple visits, we also examined changes in clinical severity over time. 3′ truncation (p<0.01), p.Arg133Cys (p<0.01), p.Thr158Met (p<0.05), p.Arg168X (p<0.05), p.Arg255X (p<0.01), p.Arg270X (p<0.001), p.Arg306Cys (p<0.01) and deletion (p<0.01) all significantly increased in clinical severity over time (figure 1B,C). However, p.Arg106Trp, p.Arg294X, exon 1, insertions, large deletions, other point mutations, splice sites and no mutations did not significantly increase over time.
Clinical features in typical RTT
Our assessment of CSS revealed significant differences, which were dependent on MECP2 mutation type. To determine whether these differences were due to one or more specific clinical features, we quantified the 13 individual components of our CSS, including age of onset, ambulation, autonomic symptoms, seizures, hand use, head growth, independent sitting, language, non-verbal communication, onset of stereotypies, respiratory dysfunction, scoliosis and somatic growth. To study these individual components, the ordinal ratings were averaged. As tabularised in figure 2 with a super-imposed heat map, significant differences exist between mutation groups for individual features (all significant differences are listed in online supplementary table S1). For each column depicting a clinical feature, the cell is colour coded with the least severely affected group depicted in blue and the most severely affected group depicted in red. Age of onset is relatively later in individuals with p.Arg133Cys and no mutation, and earlier in individuals with p.Arg168X, p.Arg255X, deletions and large deletions (figure 2 and online supplementary table S1). Similarly, hand use is more preserved in cases with 3′ truncations, p.Arg133Cys, p.Arg294X and p.Arg306Cys as compared with p.Arg168X, p.Arg270X and large deletions (figure 2 and online supplementary table S1). Individuals with p.Arg306Cys had significantly fewer autonomic symptoms versus p.Arg168X and p.Arg255X (figure 2 and online supplementary table S1). Seizures were less frequent in p.Arg306Cys cases as compared with p.Arg255X and p.Arg294X (figure 2 and online supplementary table S1).
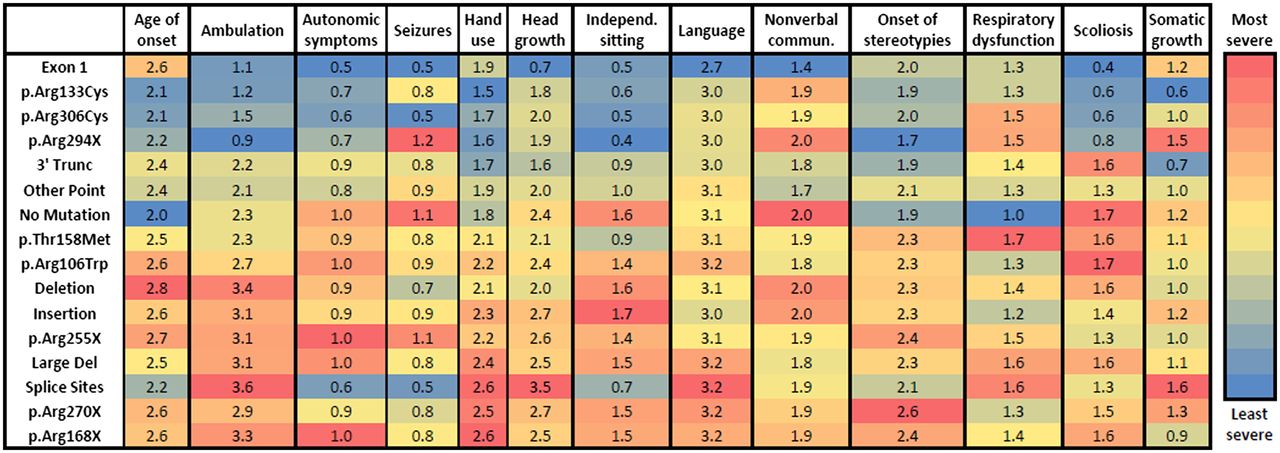
Clinical features for typical Rett syndrome. Blue is least severe and red is most severe. Scales are normalised for each clinical measure. Values represent the average score. All statistically significant differences are listed in online supplementary table S1.
Of all the symptoms, ambulation paralleled the overall CSS the closest. Ambulation was more conserved in 3′ truncations, p.Arg133Cys, p.Arg294X and p.Arg306Cys as compared with those with p.Arg168X, p.Arg255X and large deletions (figure 2 and online supplementary table S1). Head growth decelerated least in individuals with p.Arg294X and 3′ truncations, and most in individuals with p.Arg270X (figure 2 and online supplementary table S1). Independent sitting was more likely conserved in individuals with p.Arg294X and p.Arg306Cys (figure 2 and online supplementary table S1). p.Arg133Cys, p.Arg294X, p.Arg306Cys and 3′ truncations had a later onset of stereotypies, especially compared with p.Thr158Met, p.Arg168X, p.Arg255X and p.Arg270X (figure 2 and online supplementary table S1). Scoliosis was least severe in individuals with p.Arg306Cys and most severe in individuals with p.Thr158Met, 3′ truncations and large deletions (figure 2 and online supplementary table S1). Body mass index was highest in the 3′ truncation (0.7±1.1) group and lowest in p.Arg294X (figure 2 and online supplementary table S1). No statistical differences were observed between the various mutations groups in language skills, non-verbal communication and respiratory dysfunction.
CSSs in atypical RTT
We studied 148 participants seen over 646 visits with a diagnosis of atypical RTT and found significant associations between MECP2 mutation status and phenotypic manifestation. Approximately 76% (113/148) of individuals had a MECP2 mutation, with 38% (56/148) of these occurring in one of the eight most common point mutations. Similar to typical RTT, p.Arg133Cys, p.Arg294X, p.Arg306Cys and 3′ truncations were relatively less severe as compared with p.Arg106Trp, p.Arg168X, p.Arg255X, p.Arg270X, insertions, large deletions and no mutations (average CSS in table 1 and p values in figure 3). On the whole, relative to typical RTT, the less severe mutations were even less severe in atypical RTT, and the more severe mutations were more severe in atypical RTT (table 1). p.Thr158Met, deletions and other point mutations represented an intermediate disease severity group for atypical RTT.

Clinical severity score is dependent on methyl-CpG-binding protein 2 (MECP2) mutation status in participants with atypical Rett syndrome. Matrix of p-values for comparisons of all MECP2 mutation groups. All significant differences (p<0.05) are in green, and non-significant differences are in red.
Clinical features in atypical RTT
We investigated each of the components of the clinical severity scale to determine whether individual features were associated with a more or less severe clinical rating. Individuals with less severe MECP2 mutations and atypical RTT had better hand use than individuals with more severe mutations. Hand use was more preserved in p.Arg133Cys, p.Arg306Cys and 3′ truncations as compared with p.Arg168X, p.Arg270X and large deletions (figure 4 and online supplementary table S2). Autonomic symptoms were fewest in 3′ truncations and most in p.Arg168X and p.Arg270X (figure 4 and online supplementary table S2). Less severe mutations including p.Arg133Cys and p.Arg294X had a later onset of stereotypies than p.Arg270X and no mutations (figure 4 and online supplementary table S2). However, p.Arg106Trp, despite being a more severe mutation, had a later onset of stereotypies.

Clinical features for atypical Rett syndrome. Blue is least severe and red is most severe. Scales are normalised for each clinical measure. Values represent the average score. All statistically significant differences are listed in online supplementary table S2.
Unlike typical RTT, language skills and non-verbal communication correlated with disease severity in atypical RTT. Language skills were more conserved in p.Arg106Trp, p.Arg133Cys, p.Arg306Cys and 3′ truncations as compared with p.Arg168X, p.Arg255X, p.Arg270X, no mutations and large deletions (figure 4 and online supplementary table S2). Non-verbal communication was significantly less affected in individuals with 3′ truncations versus p.Arg255X and no mutations (figure 4 and online supplementary table S2).
Discussion
We studied typical and atypical RTT using the largest cohort to date and identified several novel and clinically significant associations between MECP2 mutation type and phenotypic outcomes. Our data demonstrate that MECP2 mutation type is strongly associated with phenotype in both typical and atypical RTT. Moreover, children with the less severe mutations usually begin with a relatively low clinical severity and are diagnosed later, while the opposite is true for children with more severe mutations. Importantly, we demonstrate that for most mutation types, clinical severity worsens as age increases. In both typical and atypical RTT, hand use and age at onset of stereotypies were most closely associated with overall disease severity. However, in typical RTT, ambulation and independent sitting also were associated with disease severity, while language skills were associated with disease severity in atypical RTT. We also found that growth, motor and communication dysfunction significantly contributes to clinical severity. While these data highlight the differences between MECP2 mutation types, individual participants with RTT may not follow the ‘average’ disease course we present. Nonetheless, these findings may still be used as a predictive tool for healthcare providers and families alike.
Our investigation into atypical RTT is the first of its kind and reveals many novel genotype–phenotype correlations. On the whole, mutations that were less severe in typical RTT had even lower severity in atypical RTT, while mutations that were more severe in typical RTT had greater severity in atypical RTT. Thus, atypical RTT represents the upper and lower ends of the phenotypic severity of typical RTT. As in typical RTT, p.Arg133Cys, p.Arg294X, p.Arg306Cys and 3′ truncations were relatively less severe, while p.Arg106Trp, p.Arg168X, p.Arg255X, p.Arg270X, insertions, large deletions and no mutations were severe in atypical RTT. Our analyses of atypical RTT also suggested that ambulation was more severely affected in individuals with severe mutations, but we lacked statistical power to find significant associations.
Our data corroborate several recent reports that have identified key associations between MECP2 mutation type and phenotype.6 ,11–16 20–22 Importantly, the majority of these reports have been in agreement in correlating disease severity to particular mutations. For example, p.Arg133Cys,6 ,11–14 p.Arg294X,6 ,11 ,15 p.Arg306Cys11 ,14 ,16 and 3′ truncations6 ,11 have all been identified as less severe mutations with lower clinical severities as measured by a variety of clinical severity scales. Our data confirm all of these prior findings, and also add other point mutations to this group. We also identified p.Arg106Trp, p.Arg168X, p.Arg255X, p.Arg270X, splice sites, large deletions, insertions and deletions as being mutations associated with a more severe disease course in typical RTT. p.Arg168X,6 p.Arg255X,11 ,14 p.Arg270X11 ,15 and large deletions6 had previously been implicated as more severe mutations, and our dataset confirms this. While previous reports have concluded that p.Thr158Met is a more severe mutation,11 ,14 we demonstrated that as in the no mutations group, p.Thr158Met is characterised by a disease course of intermediate severity. The latter finding is in line with a study demonstrating that the severity of p.Thr158Met and p.Arg168X is a function of the degree of X-chromosome inactivation (XCI) skewing.23
While there are strengths of the current study, including (1) the largest participant cohort studied to date, (2) repeated examination of multiple participants, (3) clinical assessment by six experienced physicians and (4) use of a standardised clinical rubric, we did not investigate XCI status. XCI has been hypothesised to contribute to the phenotypic variability seen in RTT23 ,24 but does not solely explain the wide range in clinical severity.25 It has also been hypothesised that XCI may skew phenotypes from typical to atypical RTT, although an analysis of XCI skewing in typical and atypical RTT participants found equal levels in both groups.24 The link between XCI and RTT phenotypes is complicated by the methodology of assessment for XCI; typically, skewing of XCI is measured in circulating leucocytes. However, Gibson et al26 demonstrated that in a minority of cases skewing of XCI can differ between different brain regions. For example, in an individual RTT brain, X-chromosome skewing changed from 50:50% in occipital cortex to 24:76% in temporal cortex.26 This demonstrates that skewing of XCI in the blood may not be a precise indicator of skewing in the brain, given that XCI skewing can vary between different regions in an individual brain.
Although using a standardised clinical rubric to calculate clinical severity provided us with internal consistency, we did not compare CSSs across various scoring systems. For example, Colvin et al27 used the Pineda, Kerr and WeeFIM scales, and the CSS employed here to calculate clinical severity. Our scale contains somatic growth, scoliosis, non-verbal communication and autonomic symptoms, features that are not included in the Pineda scale.18 The Kerr scale contains additional features, including mood, sleep disturbances and muscle tone, which are not included in our scale.28 Our scoring system most closely follows the Percy scale, which also includes feeding and crawling. Additionally, our scoring system includes ‘age of onset’ and ‘onset of stereotypies’, measures that do not change through development, and therefore may have led to an underestimation of age-related changes in our longitudinal analyses. However, we do provide individual analyses of each of the 13 components of our clinical severity scale for both typical and atypical RTT.
Despite our large subject sample, our statistical power was limited for introducing corrections for multiple comparisons as in previous studies.6 ,11 ,14 ,16 This represents a limitation particularly for the analyses of atypical RTT. Therefore, many of our genotype–phenotype correlations involving specific mutations or the atypical RTT group will need confirmation in a larger sample.
The importance of determining associations between MECP2 mutation type and clinical severity is at least threefold: (1) genotype–phenotype associations may reveal important molecular insight into MeCP2 protein function, (2) understanding the relationships between mutation types and clinical severity in general will enable healthcare providers to counsel individuals more robustly regarding disease prognosis and (3) determining the average severity and variance among mutations will allow researchers conducting clinical trials to adjust their inclusion criteria and outcomes based on relative severity. From a molecular biology perspective, it is clear that MeCP2 localises to the nucleus where it functions as a transcriptional regulator and binds to CpG islands in DNA. To do so, MeCP2 contains three functional domains: (1) a MBD, (2) a nuclear localisation signal (NLS) and (3) a TRD. Here we find that p.Arg106Trp, which is located in the MBD,10 leads to a relatively severe phenotype in typical and atypical RTT. This may be secondary to deficient binding to methylated DNA, leading to aberrant transcriptional control. p.Arg168X, p.Arg255X and p.Arg270X are all truncating mutations lacking the NLS, which is located between amino acids 255–271.10 Therefore, these mutations may lead to a more severe phenotype because of the inability of MeCP2 to localise to the nucleus. In contrast, p.Arg133Cys is a point mutation that may allow some MeCP2 functionality to remain intact as evidenced by the milder clinical severity. In support of this, a recent report demonstrated that while MeCP2 with p.Arg133Cys cannot bind 5-hydroxymethylcytosine to facilitate transcription, it can still bind to 5-methylcytosine to repress transcription.29 The p.Arg306Cys mutation both (1) inhibits the binding of nuclear receptor co-repressor (NCoR), a transcriptional repressor, to MeCP2, and (2) prevents activity-dependent phosphorylation of T308, which increases transcription.30 While these interactions play an important role in transcriptional regulation, the relatively milder clinical severity of patients with p.Arg306Cys suggests that these are not the only mechanisms regulating MeCP2 function.
Perhaps most importantly, our hope is that this analysis of 815 participants with typical RTT and 148 participants with atypical RTT will serve as a tool for guidance and care of affected individuals. By exploring the unique symptomatology for individual mutations in both typical and atypical RTT, we have been able to discern genotype–phenotype connections. And while individual participants with RTT may not follow the predicted clinical course, these data nevertheless should serve as general guidance for clinicians and families.
Acknowledgments
Dr Mary Lou Oster-Granite, Health Scientist Administrator at NICHD, provided invaluable guidance, support and encouragement for this Rare Disease initiative.
References
Supplementary materials
Supplementary Data
This web only file has been produced by the BMJ Publishing Group from an electronic file supplied by the author(s) and has not been edited for content.
Files in this Data Supplement:
- Data supplement 1 - Online tables
Footnotes
-
Contributors VAC, JLN and MLO analysed the data and drafted and revised the paper. RBP, KVS and GMcG did the statistical testing, wrote the methodology and revised the paper. JBL, KJM, SAS, DCT, DGG, WEK, AKP and JLN were involved in data collection and drafting and revising of the paper. MLO and JLN are co-corresponding authors and are the guarantors.
-
Funding Supported by National Institutes of Health (NIH) U54 grant HD061222; the Office of Rare Diseases Research (ORDR) at the National Center for Advancing Translational Science (NCATS); Intellectual and Developmental Disabilities Research Centers grant HD38985; and the Civitan International Research Center. The Rett Syndrome Natural History Study (U54 HD061222) is part of the NIH Rare Disease Clinical Research Network, supported through collaboration between ORDR/NCATS and the Eunice Kennedy Shriver National Institute of Child Health and Human Development. This work was also supported by a Basic Research Grant (#2916) from the International Rett Syndrome Foundation to MLO, and a Civitan Emerging Scholar Award to VAC.
-
Competing interests None.
-
Ethics approval University of Alabama at Birmingham.
-
Provenance and peer review Not commissioned; externally peer reviewed.