Article Text

Abstract
Background Papillary thyroid carcinoma (PTC) demonstrates high heritability and a low somatic mutation burden relative to other cancers. Therefore, the genetic risk predisposing to PTC is likely due to a combination of low penetrance variants. A recent genome-wide association study revealed the association of PTC with a missense variant, rs6793295, at 3q26 in a gene called Leucine Repeat Rich Containing 34 (LRRC34).
Methods We report the mechanisms of PTC risk at 3q26 using a combination of overexpression, mass spectroscopy, knockdown, transcriptome profiling, migration assays and genetic analysis.
Results We observed differential binding of wild-type and missense LRRC34 to RANBP1. Overexpression of missense LRRC34 reduced RanGTP levels and increased apoptosis. We also identified a second linkage disequilibrium (LD) block upstream of LRRC34 containing regulatory variants with allele-specific expression. Transcriptome profiling of LRRC34 knockdown cells showed changes in genes involved with cellular movement. LRRC34 knockdown reduced the migration of thyroid cancer cell lines. Lastly, we assessed the relative contribution of PTC risk from each locus using haplotype analysis.
Conclusions Our study demonstrates two separate mechanisms, one in G protein signalling and the other in transcriptional control, dictating PTC risk at 3q26 using both biochemical and genetic techniques.
- papillary thyroid carcinoma
- LRRC34
- RANBP1
- 3q26
- GWAS
Statistics from Altmetric.com
Introduction
Thyroid cancer is the most common malignancy of the endocrine system. It is the 12th most common cancer in the USA and it is estimated that 52 070 individuals in the USA will be diagnosed with thyroid cancer in 2019.1 Non-medullary thyroid cancer (NMTC) comprises the vast majority of thyroid cancers and arises from thyroid cells of follicular origin. Papillary thyroid carcinoma (PTC) is the most common histological subtype and represents approximately 80% of all NMTC cases.2 The overall standard incidence ratio of PTC is increasing worldwide in contrast to most other cancers. This increase is almost entirely attributable to PTC, especially microPTC, and is believed to stem, at least in part, from improved imaging and diagnostic techniques.3
It has been demonstrated that the overall heritability of thyroid cancer is high compared with other cancers.4–7 Classic linkage studies in familial papillary thyroid cancer have revealed a small number of culpable loci; however, heritable germline pathogenic variants have been largely absent from familial and sporadic cases.8–19 Therefore, we hypothesised that the genetic risk predisposing to thyroid cancer is due to complex genetic factors and a combination of low penetrance alleles. In the past 10 years, we have collaborated with deCODE to perform three genome-wide association studies (GWASs) of differentiated thyroid cancer in individuals of European descent and uncovered 10 loci that show genome-wide significance.20–22 The most recent meta-analysis revealed the association of NMTC with genetic variants at 1q42, 3q26, 5q22, 10q24 and 15q22. Among these five new loci, four are intronic or intergenic. However, our study uncovered association at 3q26 belonging to a missense variant, rs6793295, in the Leucine Rich Repeat Containing 34 (LRRC34) gene.
LRRC34 belongs to a ribonuclease inhibitor subfamily of leucine-rich repeat (LRR) proteins. LRRC34 RNA and protein expression is decreased in thyroid carcinoma23 and its subcellular localisation is cytoplasmic, occuring in the cytoskeleton, plasma membrane and cytokinetic bridges.24 LRRC34 is predicted to be involved in protein–protein interactions and nucleotide triphosphate binding.25 A structurally related protein, RanGAP1, controls CRM1-related nuclear export and recycling of Ran–GTP complexes.26
The purpose of our work is to understand how LRRC34 variants contribute to the genetic risk of thyroid cancer and characterise the network of genes through which it functions. Overall, our findings underscore protein–protein interaction and transcriptional control of LRRC34 in the genetic risk for PTC predisposition.
Methods
Cell lines
TPC1, BCPAP and HEK 293T cell lines were incubated in Dulbecco’s Modified Eagle Medium (DMEM) supplemented with 10% fetal bovine serum (FBS) (Thermo Fisher), 1× antibiotic-antimycotic (Thermo Fisher) and 1× Plasmocin prophylactic (InvivoGen) at 37°C in humidified air with 5% CO2. The cell lines were obtained from Rebecca Schweppe (University of Colorado Cancer Center, Denver, CO).
Generation of plasmid constructs
LRRC34 regulatory variants were PCR amplified from genomic DNA and cloned into XhoI and EcoRV sites of the pGL4.10-E4TATA vector. LRRC34 was cloned from genomic DNA in a multiplex PCR reaction into EcoRI and HindIII sites of the pCMV10 vector. Both missense variants were induced using the GENEART Site-Directed Mutagenesis System (Thermo Fisher). RANBP1 was cloned from genomic DNA using a PCR reaction into HindIII and XhoI sites of the pCMV6 vector. All cloning was performed using InFusion HD (Clontech) enzyme.
Co-Immunoprecipitation and mass spectroscopy
Cells were transiently transfected with reporter plasmids using Lipofectamine 2000 (Thermo Fisher). For co-immunoprecipitation, 1.5 mg of protein input was precleared with agarose mIgG beads (Sigma) for 1 hour, then incubated with magnetic-FLAG (M2) beads (Sigma) for 4 hours at 4°C. Beads were washed four times in 1× tris-buffered saline (TBS) with Halt protease/phosphatase inhibitor (Thermo Fisher) and twice with phosphate-buffered saline (PBS). Proteins were boiled and eluted in 2× Laemmli buffer (Bio-Rad) and supplemented with 2-mercaptoethanol. Eluates were run on a Western blot as described below. For mass spectroscopy, samples were digested with trypsin and run on an Orbitrap Fusion Tribrid Mass Spectrometer using a 3-hour gradient.
Western blotting
Cells were lysed in NP-40 buffer with 1× Halt protease/phosphatase inhibitor (Thermo Fisher) and equal amounts of protein were loaded on a 4–20% TGX Stain-Free precast SDS-PAGE gel with Unstained or All Blue Protein Standards (Bio-Rad). Gels were activated under UV light using a ChemiDoc (Bio-Rad), then transferred to low-fluorescence polyvinylidene fluoride membranes using RTA transfer kit (Bio-Rad) and Trans-Blot Turbo system (Bio-Rad). Total protein was visualised under UV light using a ChemiDoc (Bio-Rad). Blots were blocked in 5% milk in tris-buffered saline with Tween 20 (TBS-T) at room temperature for 1 hour, probed with primary antibody (Ran Cell Signaling 1:500, RanGTP (AR-12), FLAG (M2) Sigma, MYC-HRP (9E10) Santa Cruz, GAPDH-HRP (0411) Santa Cruz) at 4°C overnight, washed in TBS-T, incubated in secondary antibody at room temperature for 1 hour (anti-mIgG-HRP Sigma or anti-rIgG-HRP Cell Signaling), washed in TBS-T, then subjected to Clarity ECL (Bio-Rad). Chemiluminescence was visualised using a ChemiDoc (Bio-Rad). Blots were reprobed after they were washed in TBS-T, then quenched in 15% H2O2 in PBS at room temperature for 15 min.
Microscopy
Cells were seeded on coverslips pretreated with 0.1 mg/mL poly-d-lysine. After 24 hours, cells were fixed in 4% paraformaldehyde and permeabilised in 0.25% Triton X-100. Cells were then blocked in 10% donkey serum and incubated with primary antibodies (LRRC34 Novus, FLAG (M2) Sigma or alpha tubulin (DM1A) Abcam) in 5% donkey serum at 4°C overnight. Cells were incubated in secondary antibody at room temperature for 1 hour in the dark (anti-mIgG Alexa Fluor 647 Thermo Fisher or anti-rIgG Alexa Fluor 488 Thermo Fisher). Coverslips were mounted with 1 drop of Diamond ProLong Antifade with 4’,6-diamidino-2-phenylindole (Thermo Fisher) and cured overnight at room temperature. Cells were then imaged on an FV3000 confocal laser scanning microscope (Olympus).
Flow cytometry
Cells were washed twice with PBS and then resuspended in 1× Annexin V binding buffer (BD Biosciences). Cell suspensions were passed through a 100 µm cell strainer into polystyrene tubes and either left cells unstained or stained with FITC–Annexin V, propidium iodide or both. Cells were left incubating on shaker in darkness for 15 min and analysed on LSR II flow cytometer (BD Biosciences).
Luciferase reporter assay
For the luciferase reporter assay, cells were transiently transfected with reporter plasmids using Lipofectamine 2000 (Thermo Fisher). Each well was transfected with a luciferase reporter plasmid and Renilla plasmid pRL-TK (Promega) as an internal control for each well. Cells were lysed 24 hours after transfection with 100 µL passive lysis buffer (Promega). A 20 µL aliquot of cell lysate was assayed for luciferase activity using the GloMax 96 Microplate Luminometer (Promega).
Linkage disequilibrium (LD) and haplotype analyses
LD analysis was performed using the genotype data of 503 samples from 1000 Genomes Project (phase III), European population. Haploview V.4.2 software was applied and haplotype blocks were generated using the CI method. Haplotypes of the five selected variants were generated by using the genotyping and computer imputation data from the European descendants in an Ohio cohort of the recent GWAS.22 The SHAPEIT V.2 program was used to estimate the haplotype frequencies in 1359 PTC cases and 1605 controls. P values and OR are provided using Fisher’s exact test to compare each haplotype with the rest of the haplotypes.
Statistical analysis
Calculation of per cent splicing inclusion was determined using Image Lab V.6.0.1 (Bio-Rad). All graphical data are represented by mean±SEM and all p values reported are calculating from a two-sided Student’s t-test. Gene canonical pathway analysis using LRRC34 knockdown was performed using Ingenuity Pathway Analysis software (Qiagen). For the gene expression array analysis, a filtering method based on percentage of arrays above noise cut-off was applied to filter out low-expression genes. A linear model was employed to detect differentially-expressed genes between conditions. A variance smoothing method with moderated t-statistic was employed. The significance level was adjusted by controlling the mean number of false positives. Statistical software SAS V.9.4 and R were used for analysis.
PCR and quantitative real-time PCR assay
PCR of LRRC34 splice isoforms and GAPDH was performed using AmpliTaq Gold (Thermo Fisher) under standard PCR conditions. Quantitative real-time PCR assay was performed in three technical replicates on an ABI Prism 7900 HT Sequence Detection System (Thermo Fisher). For RNA expression analysis, RNA was extracted using RNeasy (Qiagen) then treated with DNase I (Thermo Fisher). One microgram RNA was used for cDNA synthesis using High-Capacity cDNA Reverse Transcription Kit (Thermo Fisher). All primer sets used were detected by Fast SYBR Green Master Mix kit (Thermo Fisher) using standard conditions followed by a dissociation stage. For a list of primer pairs, see online supplementary table S3.
Supplemental material
siRNA treatment and microarray hybridisation
A non-targeting siRNA pool (Dharmacon) or siRNA pool against LRRC34 (Dharmacon) was transfected into the cells using Lipofectamine RNAiMAX (Thermo Fisher). After 72 hours, cells were harvested and total RNA was extracted using an RNeasy kit (Qiagen), then treated with DNase I (Thermo Fisher). The integrity of the RNA samples was assessed by BioAnalyzer (Agilent Technologies). Clariom D Human arrays (Thermo Fisher) were used to assess gene expression. In total, 100 ng RNA was used to generate the single-stranded cDNA samples for hybridisation. Then, cDNA was enzymatically fragmented and biotinylated using the WT Terminal Labeling kit (Thermo Fisher). The cDNA samples were hybridised to the array at 45°C for 16 hours. The arrays were washed and scanned with the Affymetrix GeneChip Scanner 3000 7G system (Thermo Fisher Scientific) using Affymetrix GeneChip Command Console software. Signal intensities were processed by the robust multiarray average method using Affymetrix Expression Console software.
Migration assay
Cells were transfected with a non-targeting siRNA pool or siRNA against LRRC34 as described above. Fifty-four hours after transfection, cells were seeded in 8 µm MilliCell chambers (Millipore) for a migration assay in DMEM containing 1% FBS surrounded by DMEM containing 10% FBS. MilliCell chambers were washed in ddH2O, then fixed and stained in Crystal Violet staining solution (0.05% Crystal Violet in 10% formaldehyde). MilliCell chambers were then washed in ddH2O and wiped both from the top and bottom of the membrane with a Q-tip. Crystal Violet was eluted using methanol and measured in a SpectraMax M2 spectrometer (Molecular Devices) at 570 nm.
Results
LRRC34 is differentially alternatively spliced
The most significant GWAS variant at 3q26 from our combined meta-analysis in PTC is rs6793295.22 This missense variant lies within an alternatively-spliced exon (online supplementary figure S1A). Therefore, we sought to understand what levels of LRRC34 alternative splicing were present in thyroid tissue and whether rs6793295 displayed any allele-specific alternative splicing pattern. By RT-PCR, there was very little alternative splicing of LRRC34, especially in thyroid tissue as compared with other tissues such as kidney and heart (online supplementary figure S1B). We then performed RT-PCR of matched-normal thyroid and tumour tissue from 16 patients with PTC (online supplementary figure S1C). We observed a small but significant increase in exon 7 inclusion in tumour over matched-normal tissue (online supplementary figure S1D). In addition, we observed no allele-specific alternative splicing pattern (online supplementary figure S1E). Overall, we conclude that the incremental changes in alternative splicing of LRRC34 are not a significant feature in PTC due to the low magnitude of isoform switching.
LD analysis reveals a second missense variant in LD with rs6793295
In order to assess the functional significance of rs6793295 and identify other functional variants in this region, we performed LD analysis. Our analysis revealed an additional missense variant, rs10936600, in exon 8 of LRRC34 in high LD (D′=1.0; r2=0.89) with rs6793295 (figure 1A). In our previously-published GWAS, both markers were strongly correlated with PTC and difficult to distinguish statistically; therefore, we decided to focus on both missense variants together for functional validation. In silico predictions indicated that together, these amino acid substitutions (S246G; S286I) were deleterious to the folding of LRRC34. Specifically S286I, which lies in the middle of several LRR domains (figure 1B), was not well tolerated according to both SIFT (0.044) and PolyPhen (0.999).27 28 As LRRC34 is predicted to be involved in mediating protein–protein interaction, we hypothesised that missense variants in LRRC34 would change the protein function through cellular localisation or affinity for its binding partners.
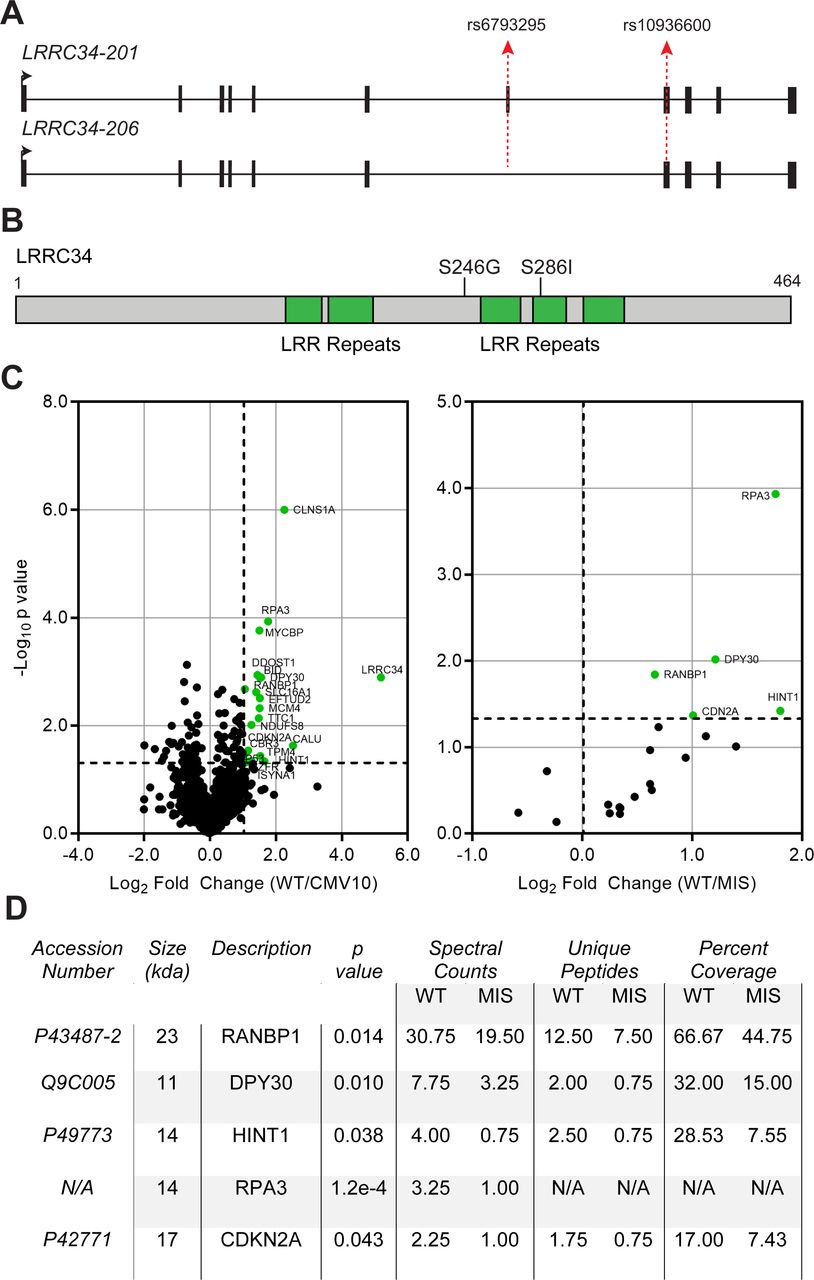
Mass spectrometry identifies differential binding between wild-type and missense LRRC34. (A) Schematic of protein-coding LRRC34 transcripts. Exons are depicted as black boxes and introns as a solid line. Transcription start site and direction is indicated by a solid black arrow. The positions of the missense variants rs6793295 and rs10936600 are depicted by dotted red arrows. (B) Linear schematic of LRRC34 protein sequence with leucine-rich repeat (LRR) domains (green) and missense mutations (line). (C) Volcano plots from mass spectrometry of LRRC34 co-immunoprecipitation. The x-axes represent fold-change value and y-axes are −log10 p values. Absolute twofold change and p value=0.05 is used as the threshold cut-off and are represented by black dotted lines. Significant proteins are labelled as green dots. (D) Table of statistically-significant targets that are bound differentially between wild-type (WT) and missense (MIS) LRRC34.
LRRC34 is localised to the cytoplasm
In pluripotent stem cells, LRRC34 is localised to the nucleolus.22 However, in U2-OS, A-431 and HEK 293 cells, it is reported as being localised to cytoplasm.24 To reconcile this discrepancy, we performed immunofluorescence staining on a PTC-derived cell line, TPC1, using HEK 293T cells as a positive control. In concordance with data from the Protein Atlas, we observed staining of LRRC34 in the cytoplasm. Further, we observed co-localisation of LRRC34 with α-tubulin, a marker for microtubules (online supplementary figure S2A). To understand if the missense variants in LRRC34 might have an impact on its subcellular localisation, we cloned LRRC34 into a 3xFLAG vector (wild-type LRRC34) and then induced both missense variants (S249G; L286I) together (missense LRRC34). Ectopically-expressed LRRC34 was localised to the cytoplasm along the cellular membrane in HEK 293T cells (online supplementary figure S2B). However, we did not observe differential localisation between the wild-type and missense LRRC34, indicating that LRRC34 missense mutations do not have an impact on the localisation of this protein.
LRRC34 missense variants impair protein–protein interaction
To test what effects missense variants exert on LRRC34 binding partners, we expressed either wild-type or missense LRRC34 constructs along with an empty vector negative control in HEK 293T cells (online supplementary figure S3A). We first verified equivalent levels of overexpression between both wild-type and missense LRRC34 (online supplementary figure S2B), then subjected the lysates to FLAG co-immunoprecipitation and mass spectroscopy. We discovered 20 proteins in complex with LRRC34 (figure 1C left, online supplementary table S1). Importantly, we found five proteins that were bound differentially between wild-type and missense LRRC34: RANBP1, DPY30, HINT1, RPA3 and CDKN2A (figure 1C right, D). Given the predictions of LRRC34 function from its structure, we focused on RANBP1 because this molecule also binds to RANGAP1 and it was our most abundant target next to LRRC34 itself (figure 1D, online supplementary table S1).
To confirm the findings of our mass spectroscopy screen, we designed an overexpression construct for RANBP1 (figure 2A). We co-transfected either empty vectors (C), wild-type (W) or missense (M) 3xFLAG-LRRC34 with 2xMYC-RANBP1 constructs in HEK 293T cells. We then performed a FLAG co-immunoprecipitation in the same manner as was done for the mass spectroscopy to confirm the interaction between RANBP1 and LRRC34 (figure 2B). Specifically, we observed that missense LRRC34 co-immunoprecipitated less RANBP1 than wild-type LRRC34 (figure 2C). These findings are in concordance with the mass spectroscopy data (figure 1D, online supplementary table S1) and suggest that this differential binding could have an effect on GTP signalling in the cell.
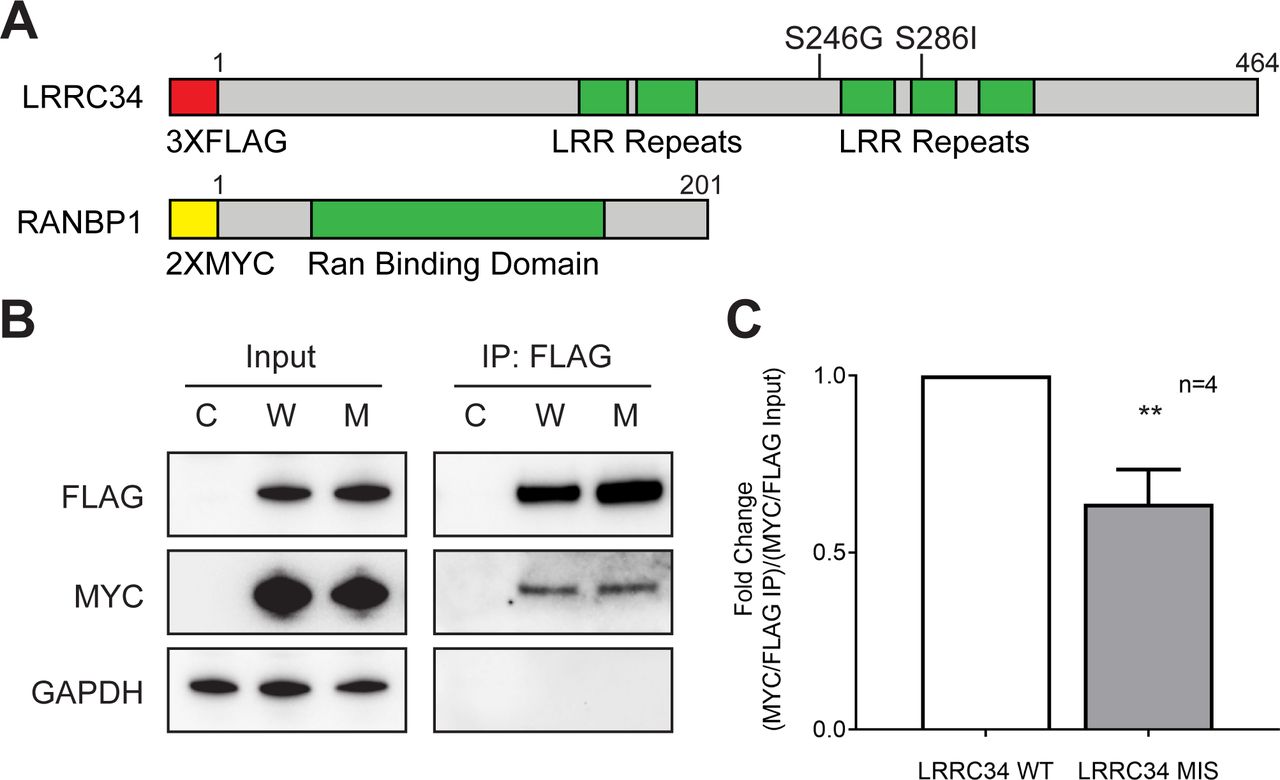
RANBP1 has reduced affinity for missense LRRC34. (A) Linear schematic of LRRC34 and RANBP1 exogenous protein constructs with epitope tags (red or yellow), functional domains (green) and indicated missense mutations. (B) Representative Western blot of input and co-immunoprecipitation of CMV10 and CMV6 empty vectors (C), 3XFLAG-LRRC34 WT and 2XMYC-RANBP1 (W), or 3XFLAG-LRRC34 MIS and 2XMYC-RANBP1 (M). (C) Quantitation of FLAG co-immunoprecipitation as determined by ratio of immunoprecipitated 3XFLAG-LRRC34 divided by co-immunoprecipitated 2XMYC-RANBP1 normalised to the ratio of 3XFLAG-LRRC34 and 2XMYC-RANBP1 expression from input.
LRRC34 missense variants reduce RanGTP levels and induce apoptosis
As RANBP1 helps catalyse RanGTP, we hypothesised that a loss of binding to RANBP1 by missense LRRC34 might affect overall RanGTP levels. We overexpressed either an empty vector (C), wild-type (W) or missense (M) LRRC34 in HEK 293T cells. We performed a Western blot of cell lysates and immunoblotted using an antibody that specifically recognises the GTP-bound form of Ran (figure 3A) or total Ran (figure 3C). We observed a significant decrease in the amount of RanGTP on missense LRRC34 (LRRC34 MIS) overexpression compared with our negative control (CMV10; figure 3B). Importantly, this change in RanGTP levels was not accompanied by a change in total Ran levels between any of our overexpression conditions (figure 3D).

Missense LRRC34 reduces the expression of RanGTP and induces apoptosis. (A) Western blot of RanGTP expression from HEK 293T cells expressing either CMV10 empty vector (C), wild-type LRRC34 (W) or missense LRRC34 (M). Below each immunoblot is a representative section of the stain-free image of the total protein from 25 to 100 kDa. (B) Quantification of relative RanGTP levels were normalised to the total protein present in each lane of the stain-free image. (C) Western blot of total Ran expression from HEK 293T expressing either CMV10 empty vector (C), wild-type LRRC34 (W) or missense LRRC34 (M). Below each immunoblot is a representative section of the stain-free image of the total protein from 25 to 100 kDa. (D) Quantification of relative total Ran levels were normalised to the total protein present in each lane of the stain-free image. All results are shown as mean±SEM, n=4. **p<0.01 (two-tailed t-test). Flow cytometry histograms from HEK 293T cells transfected with (E) CMV10 empty vector (CMV10), (F) 3XFLAG-LRRC34 (LRRC34 WT) or (G) 3XFLAG-LRRC34 S249G; L286I (LRRC34 MIS) for 48 hours. Cells were stained with propidium iodide (PI) and FITC–Annexin V. (H) Quantitation of the percentage of cells in late apoptosis (Q2). Results are shown as mean±SEM, n=4. **p<0.01; ***p<0.001 (two-tailed t-test).
We then subjected LRRC34-overexpressing cells to flow cytometry and examined the proportion of cells undergoing apoptosis (figure 3E–G). We observed a small but significant increase in the proportion of cells undergoing late apoptosis (PI+/Annexin V+) in cells expressing wild-type LRRC34 (LRRC34 WT) compared to the empty vector (CMV10; figure 3H). This phenotype was exacerbated significantly on expression of missense LRRC34 (LRRC34 MIS; figure 3H).
LRRC34 upstream variants show allele-specific transcriptional activity
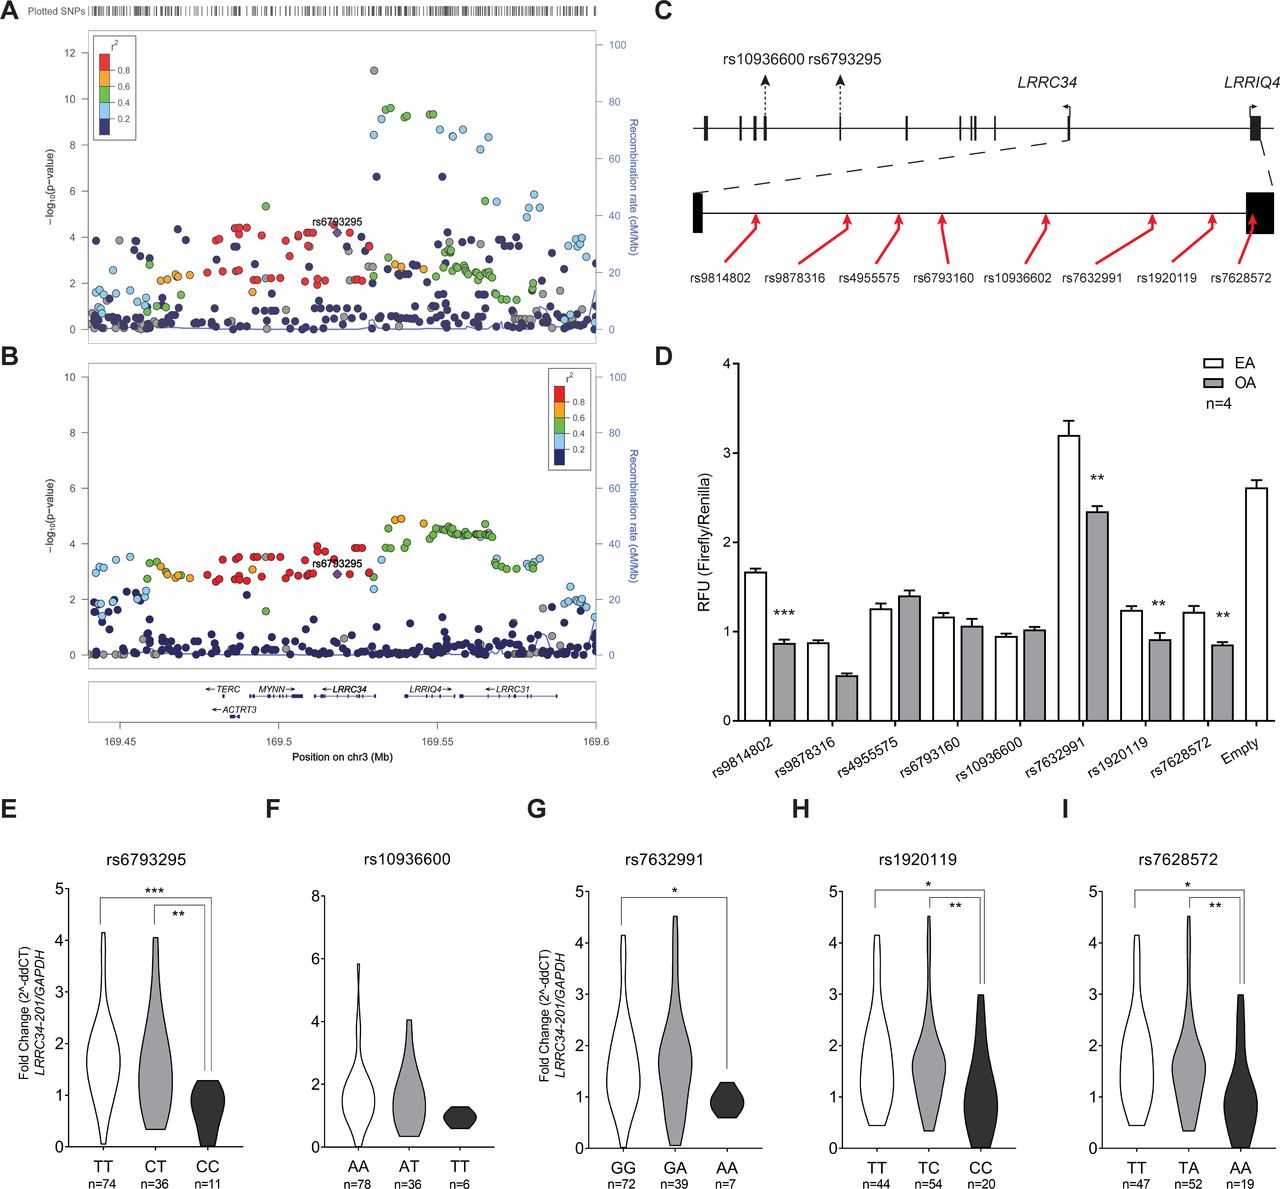
The region upstream of LRRC34 shows several variants with significant allele-specific expression in normal thyroid tissue according to the GTEx Consortium (figure 4A). Likewise, our genetic association analysis in an Ohio PTC cohort uncovered a population-specific PTC locus that is genetically distinct from the missense variant, rs6793295 (figure 4B). To evaluate the allele-specific activity of variants in this LD block, we inserted eight variants from this region into a luciferase vector (figure 4C). We transfected these constructs into TPC1 (figure 4D), as well as HEK 293T and BCPAP cells (online supplementary figure S4A, B). The only variant that showed significant allele-specific expression differences in all three cell types was rs7632291. Specifically, the other allele (OA), or rs7632991 [A], showed approximately a 33% reduction in relative fluorescence units compared with the effect allele (EA) [G] between the three cell lines.

LRRC34 upstream variants show allele-specific expression. (A) Graph of negative log10-transformed p values for Expression Quantitative Trait Loci (cis-eQTL) in thyroid tissue at the 3q26 locus. (B) Graph of negative log10-transformed GWAS p values from the Ohio PTC cohort at the 3q26 locus. (C) Schematic of the position of variants used in dual luciferase assay (red arrow) relative to the open reading frames for LRRIQ4 and LRRC34. (D) Results of dual luciferase assay in TPC1 cells of upstream LRRC34 variants. Results are shown as mean±SEM of one experiment with four technical replicates. For each variant, the left allele is the effect allele (EA) and the right is the other allele (OA). Asterisks indicate that experiment was repeated four times with similar results. Allele-specific expression of LRRC34-201 in unaffected thyroid tissue between genotypes for (E) rs6793295, (F) rs10936600, (G) rs7632991, (H) rs1920119 and (I) rs7628572. **p<0.01; ***p<0.001 (two-tailed t-test).
In addition, we performed qRT-PCR for LRRC34 on unaffected thyroid tissue samples of an Ohio cohort of patients with PTC (n=122), which were also genotyped for missense and regulatory variants: rs6793295, rs10936600, rs7632991, rs1920119 and rs7628572. We report that for both missense (rs6793295 (figure 4E)) and regulatory variants (rs7632991 (figure 4E), rs1920119 (figure 4H) and rs7628572 (figure 4I)), the risk allele was associated with significantly higher expression of LRRC34. We did not observe any pattern of allele-specific expression for rs10936602 (figure 4F). These data were consistent with those reported by the GTEx Consortium.
Minor regulatory variants abolish PTC risk from missense variants
In order to determine the relative contribution of each locus at 3q26 to PTC risk, we performed phasing of our Ohio PTC cohort (table 1). For our analysis, we chose variants on the basis of their mechanism and therefore included both missense variants (rs6793295 and rs10936600) as well as regulatory variants that demonstrated allele-specific expression in at least two cell lines (rs7632991, rs7658592 and rs1920119). Of the seven haplotypes, we observed three that were statistically significant (table 1). Haplotypes 1 and 7 are the major haplotypes, demonstrating a risk and protective effect, respectively. Interestingly, haplotype 3 bears EAs for the missense variants, but the OA for the rs7632991 regulatory variant, with an overall OR of 0.72. Thus, our haplotype, expression and luciferase data suggest that the protective effect of the OA at rs7632991 might negate or mitigate the risk of bearing both missense variants by downregulating the expression of LRRC34.
Haplotype analysis of LRRC34 in PTC cases vs controls
siRNA knockdown of LRRC34 results in suppression of genes involved in cell motility
We determined that lower expression of LRRC34 is associated with the protective allele [A] at rs7632991 and also the protective missense allele [C] at rs6793295. In order to characterise the effect of reduced LRRC34 expression, we treated BCPAP cells with non-targeting siRNA or siRNA against LRRC34 followed by transcriptome-wide analysis of changes in gene expression. Ingenuity Pathway Analysis of our transcriptome data found that the most significant disease network was cancer (figure 5A), and top biological functions were cellular movement and cell cycle (figure 5B). We found that many of the top 10 differentially-downregulated genes on LRRC34 knockdown were genes involved in cell movement, including BMP2, CXLC5, LCN2 and PTGS2 (online supplementary figure S5, online supplementary table S2). We confirmed the differential expression of molecules involved in cell motility in BCPAP cells by qPCR (figure 5D) and found concordance between our microarray and qPCR data. In addition, we performed LRRC34 knockdown in TPC1 cells and observed that most targets had the same significant changes in gene expression (online supplementary figure S6A).

siRNA knockdown of LRRC34 reduces migration of BCPAP cells. Ingenuity Pathway Analysis depicting the top (A) ‘Disease and Disorders’ and (B) ‘Molecular and Cellular Functions’ affected on LRRC34 knockdown. (C) Expression of the candidate genes involved in cellular movement candidate from siRNA knockdown of LRRC34 is plotted with a heat-map colour scale using relative expression fold changes (fold change >2.0, p<0.0001, n=4). (D) Quantitative real-time PCR validations for 15 targets in BCPAP cells treated with siNS or siLRRC34. (E) Representative bright-field micrographs of migrated cells in BCPAP cells. (F) Average fold change in migration siLRRC34-treated cells relative to siNS in BCPAP cells. Results are shown as mean±SEM, n=4. ****p<0.0001; ***p<0.001; **p<0.01; *p<0.05 (two-tailed t-test).
Knockdown of LRRC34 reduces cell migration
To query whether siRNA-mediated knockdown of LRRC34 had any effect on cell migration, we performed a transwell migration assay. We transfected BCPAP and TPC1 cells with non-targeting siRNA or siRNA against LRRC34, then fixed and stained cells, and quantitated the relative number of migrated versus non-migrated cells (figure 5E, online supplementary figure S6B). In BCPAP cells, we saw a reduction in the fold change of migrated cells with LRRC34 siRNA knockdown as compared with the non-targeting control siRNA (figure 5F). In TPC1 cells, we observed a similar reduction in the percentage of migrated cells in LRRC34 knockdown cells as compared with control siRNA (online supplementary figure S6C).
Discussion
In the present study, we have characterised LRRC34 variants in the predisposition to PTC. We showed that the first missense variant identified through GWAS analysis, rs6793295, is in LD with a second missense variant, rs10936600. Furthermore, the wild-type alleles from these loci represent a risk PTC risk haplotype with an OR of 1.23. These findings allowed us to hypothesise that the missense alleles for these variants are protective against PTC, and might stem from the differential activity or binding partners for the two protein isoforms. We performed co-immunoprecipitation followed by mass spectroscopy of wild-type and missense LRRC34 isoforms and uncovered many previously unreported binding partners for LRRC34, but importantly we observed differential binding of RANBP1 to LRRC34 wild-type and missense isoforms using both mass spectroscopy and co-immunoprecipitation.
RANBP1 interacts with Ran through its RAN binding domain. It forms a complex with CRM1, RanGTP and RanGAP to allow GTP hydrolysis and nuclear export of CRM1-bound cargo. In addition to nuclear transport, RanGTP signalling plays an important role in mitotic spindle assembly.29 30 During apoptosis, changes in RanGTP levels impact microtubule dynamics and spindle assembly through TPX2.31 It was previously observed that treatment of cells with the topoisomerase II inhibitor, etoposide, led to the redistribution of Ran and a reduction in GTP levels.32 Altogether, these data suggest that an important step in apoptotic signalling is breakdown in nuclear trafficking and concomitant reduction in RanGTP. Consistent with these findings, we observed that missense LRRC34 bound less to RANBP1 and its overexpression significantly reduced RanGTP levels. One hypothesis for reduced RanGTP levels associated with the missense variants in LRRC34 is that LRRC34 normally competes with RANGAP1 for the binding of RANBP1. Since missense LRRC34 has reduced affinity for RANBP1, RANBP1 and RANGAP1 together drive greater hydrolysis of RanGTP to RanGDP. This may cause a disruption in nuclear trafficking and allow apoptosis to proceed.
Our transcriptome-wide analysis demonstrated the processes that were affected by LRRC34 knockdown were cell motility and cell cycle; however, some molecules showed states of activation or repression that were inconsistent with the state of downstream molecules. For instance, many of the molecules that were among the most significantly downregulated on LRRC34 knockdown, including LCN2 and CXCL5, are upregulated in PTC tumours.23 However, our genetic association data show that the other alleles in the regulatory region upstream of LRRC34 make up a protective haplotype and our biochemical data demonstrate that these other alleles result in lower transcriptional output, reducing the migration of thyroid cancer cells. Interestingly, gnomAD reports that there is a truncating mutation in exon 9 of LRRC34 (p.Ser300Ter) with a heterozygous carrier frequency of 7.2% in Africans, which is nearly absent in Caucasians (0.0001%). The incidence of PTC among individuals of African descent is low compared with Caucasians; therefore, it is interesting to speculate that a common loss-of-function mutation in LRRC34 may be responsible for mitigating the risk of PTC in Africans.33 34
Coding variants represent the strongest association between genotype and phenotype. However, coding variants, rare or common, can show variable penetrance.35 One hypothesis for the wide range of phenotypic expression from a single genotype is that non-coding variants modify the levels of gene expression and therefore the penetrance of the coding variant. Recently, the Lappalainen group reported that cis-regulatory variants have epistatic effects on the penetrance of pathogenic coding variants on a genome-wide level.36 In addition to the two missense variants, rs6793295 and rs10936600, we discovered a third upstream regulatory variant, rs7632991. While the former variants are in perfect LD, this regulatory variant lies within a separate LD block and therefore represents a separate association with PTC risk. Our data show that lowered expression of LRRC34 from the minor allele at rs7632991 mitigates the increased genetic risk of PTC from the missense alleles. Therefore, we hypothesise that the upstream regulatory variants contribute to the variable penetrance of missense variants in LRRC34.
Overall, our study provides functional validation of the recently reported GWAS locus at 3q26 in the predisposition to PTC. Our genetic and biochemical data support two distinct mechanisms for the role of LRRC34 in thyroid carcinoma, one in G protein signalling and the other in transcriptional control. As one of several low penetrance genes implicated in thyroid cancer, further studies to refine and characterise additional risk loci will enable a comprehensive understanding of the germline genetics of thyroid cancer.
Acknowledgments
We would like to kindly thank Dr Patrizia Lavia from the IBPM Institute of Molecular Biology and Pathology for the RanGTP (AR-12) antibody. We would like to thank Rebecca Schweppe from the Univerisity of Colorado for the cell lines. We would also like thank the Ohio State University Comprehensive Cancer Center Biospecimen Services, Genomics, Microscopy and Proteomics Shared Resources for their assistance with data acquisition.
References
Supplementary materials
Supplementary Data
This web only file has been produced by the BMJ Publishing Group from an electronic file supplied by the author(s) and has not been edited for content.
Footnotes
Contributors AdlC and HH proposed the project. DFCJ designed and performed most of the experiments. SL performed the LD and haplotype analysis. MSS performed the qPCR validation of microarray data. LKG isolated the tissues for genotyping and expression analysis. IVH performed genotyping of variants. LY performed microarray analysis. PLB provided the tissue samples. AdlC, HH and DFCJ wrote the manuscript. All authors read and approved of the final manuscript.
Funding This work was supported by National Cancer Institute grants P30CA16058 and P50CA168505.
Competing interests None declared.
Patient consent for publication Not required.
Provenance and peer review Not commissioned; externally peer reviewed.
Data availability statement Data are available in a public, open access repository.