Article Text

Abstract
Background Parkinson’s disease (PD) is a neurodegenerative disorder with complex genetic architecture. Besides rare mutations in high-risk genes related to monogenic familial forms of PD, multiple variants associated with sporadic PD were discovered via association studies.
Methods We studied the whole-exome sequencing data of 340 PD cases and 146 ethnically matched controls from the Parkinson’s Progression Markers Initiative (PPMI) and performed burden analysis for different rare variant classes. Disease prediction models were built based on clinical, non-clinical and genetic features, including both common and rare variants, and two machine learning methods.
Results We observed a significant exome-wide burden of singleton loss-of-function variants (corrected p=0.037). Overall, no exome-wide burden of rare amino acid changing variants was detected. Finally, we built a disease prediction model combining singleton loss-of-function variants, a polygenic risk score based on common variants, and family history of PD as features and reached an area under the curve of 0.703 (95% CI 0.698 to 0.708). By incorporating a rare variant feature, our model increased the performance of the state-of-the-art classification model for the PPMI dataset, which reached an area under the curve of 0.639 based on common variants alone.
Conclusion The main finding of this study is to highlight the contribution of singleton loss-of-function variants to the complex genetics of PD and that disease risk prediction models combining singleton and common variants can improve models built solely on common variants.
- Parkinson-s disease
- genetics
- complex traits
This is an open access article distributed in accordance with the Creative Commons Attribution Non Commercial (CC BY-NC 4.0) license, which permits others to distribute, remix, adapt, build upon this work non-commercially, and license their derivative works on different terms, provided the original work is properly cited, appropriate credit is given, any changes made indicated, and the use is non-commercial. See: http://creativecommons.org/licenses/by-nc/4.0/.
Statistics from Altmetric.com
Introduction
Parkinson’s disease (PD) is a neurodegenerative disorder that is linked to several genetic and environmental factors. Several risk variants and genes were identified by genetic studies and predictive disease risk models were built based on identified associations with common variants.1 2 Large-scale meta-analyses have identified several genes that are associated with PD.3–5 As common variants alone cannot explain the entire heritability of complex diseases, other causes such as DNA methylation levels,6 rare, ultra-rare or singleton variants could contribute to the genetic risk,7 8 for example, singleton variants have been studied earlier in the context of schizophrenia.9–11
In order to identify the disease associated genes, an array of burden tests12 13 have been developed to aggregate the signals from rare or common variants. Even after aggregating variants at the level of genes, there is still a limited power to attain genome-wide statistical significance and still larger sample sizes to uncover novel disease associations are required. To increase statistical power, variants can be aggregated at a higher level instead, such as gene-sets and pathways, or for different variant types. For instance, it has been previously shown that in schizophrenia, there is an excess of genome-wide ultra-rare variants9 in cases versus controls and also in specific genes.14 In line with this observation, in sudden unexpected death in epilepsy,15 there is a genome-wide excess of rare disruptive variants. In this study, we investigated whole-exome sequencing (WES) data available from the Parkinson’s Progression Markers Initiative (PPMI) consortium16 and performed exome-wide burden analysis by aggregating rare and singleton variants.
Previous studies have built predictive genetic risk models based on the genetic data from PPMI to differentiate PD cases from healthy controls17–19 and to subclassify PD phenotypes.17 The PPMI WES data have been so far employed as a replication dataset to show a significant burden in a group of 54 lysosomal genes in PD18 and to test the burden of rare loss-of-function (LoF) variants in 27 candidate genes.7 Further, it was used to describe the frequency of LoF variants in TRAP1.20 However, an unbiased exome-wide study based on the PPMI data to test the burden of rare variants in PD was still missing.21 A previous study showed the potential role of rare variants in PD by conducting burden analyses.22 In our study, we performed burden analyses at exome-wide level and show an increased burden of singleton LoF variants in cases versus controls. Our findings implicate the role of LoF variants at a genome-wide level and highlight the heterogeneous nature of PD. On the basis of polygenic risk score (PRS), rare singleton LoF variant counts and the family history of PD, we trained seven PD risk prediction models by combining rare and common variant associations.
Methods
Subjects
The PPMI study is an effort to identify biomarkers of PD progression17 in sporadic cases. Detailed information about this initiative and the data can be found on their website (http://www.ppmi-info.org).
WES was performed on whole-blood extracted DNA samples collected according to the PPMI Research Biomarkers Laboratory Manual using Illumina Nextera Rapid Capture Expanded Exome Kit that targets 201 121 exons, untranslated regions and miRNAs, and covers 95.3% of RefSeq exome from the human NCBI37/hg19 reference genome. Exome-enriched libraries were sequenced on the Illumina HiSeq 2500 sequencing platform using 2×100 bp paired-end read cycles. Briefly, the variants were called following the Genome Analysis Toolkit (GATK)23 best practices.
Whole-genome sequencing (WGS) data for all individuals were downloaded in VCF format from the PPMI webpage. As described in the PPMI documentation, WGS was performed by Macrogen on whole-blood extracted DNA samples. Samples were prepared according to the Illumina TruSeq PCR Free DNA sample Preparation Guide. The libraries were sequenced using Illumina HiSeq X Ten Sequencer. Paired-end read sequences were initially aligned to the GRCh37-hs37d5 genome using the GATK pipeline (V.3.5).23 Haplotype caller in the GATK pipeline was used to call variants including single-nucleotide variants (SNVs) and small In/Dels and to generate genome VCFs. Low-quality SNPs, In/Dels and high depth variants were then filtered using SelectVariants and VariantFiltration modules of the GATK pipeline and made available in VCF format.
In addition, all individuals were genotyped with the NeuroX chip.1 The initial PPMI exome dataset comprised 404 PD and 183 healthy controls, which were further quality filtered and stratified as described below.
Sample quality control
Number of alternate alleles, number of heterozygotes, Ti:Tv ratio, number of singletons and call rate served as data quality parameters. They were calculated by the PLINK/SEQ (https//atgu.mgh.harvard.edu/plinkseq) i-stats command. Any sample with >3 SD from the mean in any of the aforementioned metrics was excluded from the analysis. To ensure that the call rate difference is minimal between cases and controls, we performed a Wilcoxon rank-sum test. To perform population stratification on the WES samples, we selected the variants that were common between HapMap (V.3.3)23 and the filtered PPMI dataset. The variants were further filtered to be (1) only bi-allelic SNVs, (2) with a call rate >98% and (3) not in LD.
The filtered variants were finally checked for cryptic relatedness and deviations from reported sex. Population stratification was performed via EIGENSTRAT.24 Cryptic relatedness check was performed via PLINK25 and KING.26 We checked up to third-degree relatedness and one sample of the identified related pairs for the final analyses were randomly chosen for further analysis. We merged our data with the 1000 genomes data and performed population stratification employing EIGENSTRAT with default parameters. Except for a few outliers, all samples clustered with the European samples in the 1000 genomes data (online supplementary figure 1). In order to determine the outlier from the EIGENSTRAT analysis, a sigma value of 3 was applied as a cut-off (which excludes all the samples with >3 SD based on the first 10 principal components (PCs)). In addition, we excluded the samples >3 SD based on the first and second PCs from the EIGENSTRAT analysis.
Supplemental material
Variant quality control
The PPMI variants were prefiltered for high-quality variants according to the variant quality score recalibration approach as part of GATK best practices by the authors of the original study. In order to be more stringent, we applied additional filters: (1) for SNVs: variants were filtered for QD <2.0, FS >60.0, MQ <40.0, MQRankSum <−12.5, ReadPosRankSum <−8.0, DP <10.0, GQ_MEAN <20.0, VQSLOD <0, ABHet >0.75 or <0.25, and Hardy-Weinberg Phred scale p value of >20. (2) For insertions and deletions: parameters for variant filtration were QD <2.0, FS >200.0, ReadPosRankSum <−20.0, DP <10.0 and GQ_MEAN <20.0. Filtering based on individual genotype quality and read depth was performed by converting the variant genotypes with a read depth of <10 and GQ of <20 to missing. Finally, only variants with a call rate of >0.9 were kept for further analyses. Quality control statistics are given in online supplementary table 1.
Supplemental material
Variant annotation
Multiallelic variants were decomposed with variant tests27 and left normalised by bcftools.28 Variants were annotated by ANNOVAR29 version 2016 June 17 using the RefSeq gene annotation, the dbNSFP V.3.030 prediction and conservation scores as well as genome-wide CADD31 scores. Exonic and splice site variants were selected according to RefSeq annotations. Rare variants were defined as variants with minor allele frequency <0.005 in the European population of any of the four population databases: 1000 genomes,32 ExAC (release 0.3, Non-Finnish Europeans (NFE))33 and the Exome Variant Server (http://evs.gs.washington.edu/EVS). Singleton variants were defined as the variants present in only one sample in the entire PPMI dataset (allele count equals 1). In order to check the allele frequency distribution of singleton LoF variants in the common population, we plotted their allele frequencies in population databases (online supplementary figures 12–17). The distributions show that all LoF singletons in the PPMI dataset are also ultra-rare variants in the common population supporting the singleton status within the PPMI dataset. This is similar to a previous study performed in schizophrenia.10 We divided the rare and singleton exonic and splicing variants into four different variant classes (in total eight different classes): (1) LoF variants defined as premature stop codon, stop loss, splice site variants (within 2 nt of RefGene defined splice sites) and frameshift insertions/deletions; (2) missense variants (NONSYN) excluding exonic missense overlapping splice sites; (3) CADD20 includes missense variants with a CADD phred score ≥20; (4) synonymous variants (SYN) that are not overlapping with splice sites as a control variant set, as they are assumed to be functionally neutral.
Validation of singleton variants using WGS data
To validate the singleton variant calls from the original WES dataset with a second independent experimental method, we used the WGS data available from the PPMI website. The WGS data were downloaded in VCF format. All singleton variants identified in the WES data were checked for consistent calls in the WGS data.
Burden analyses of rare and singleton variants
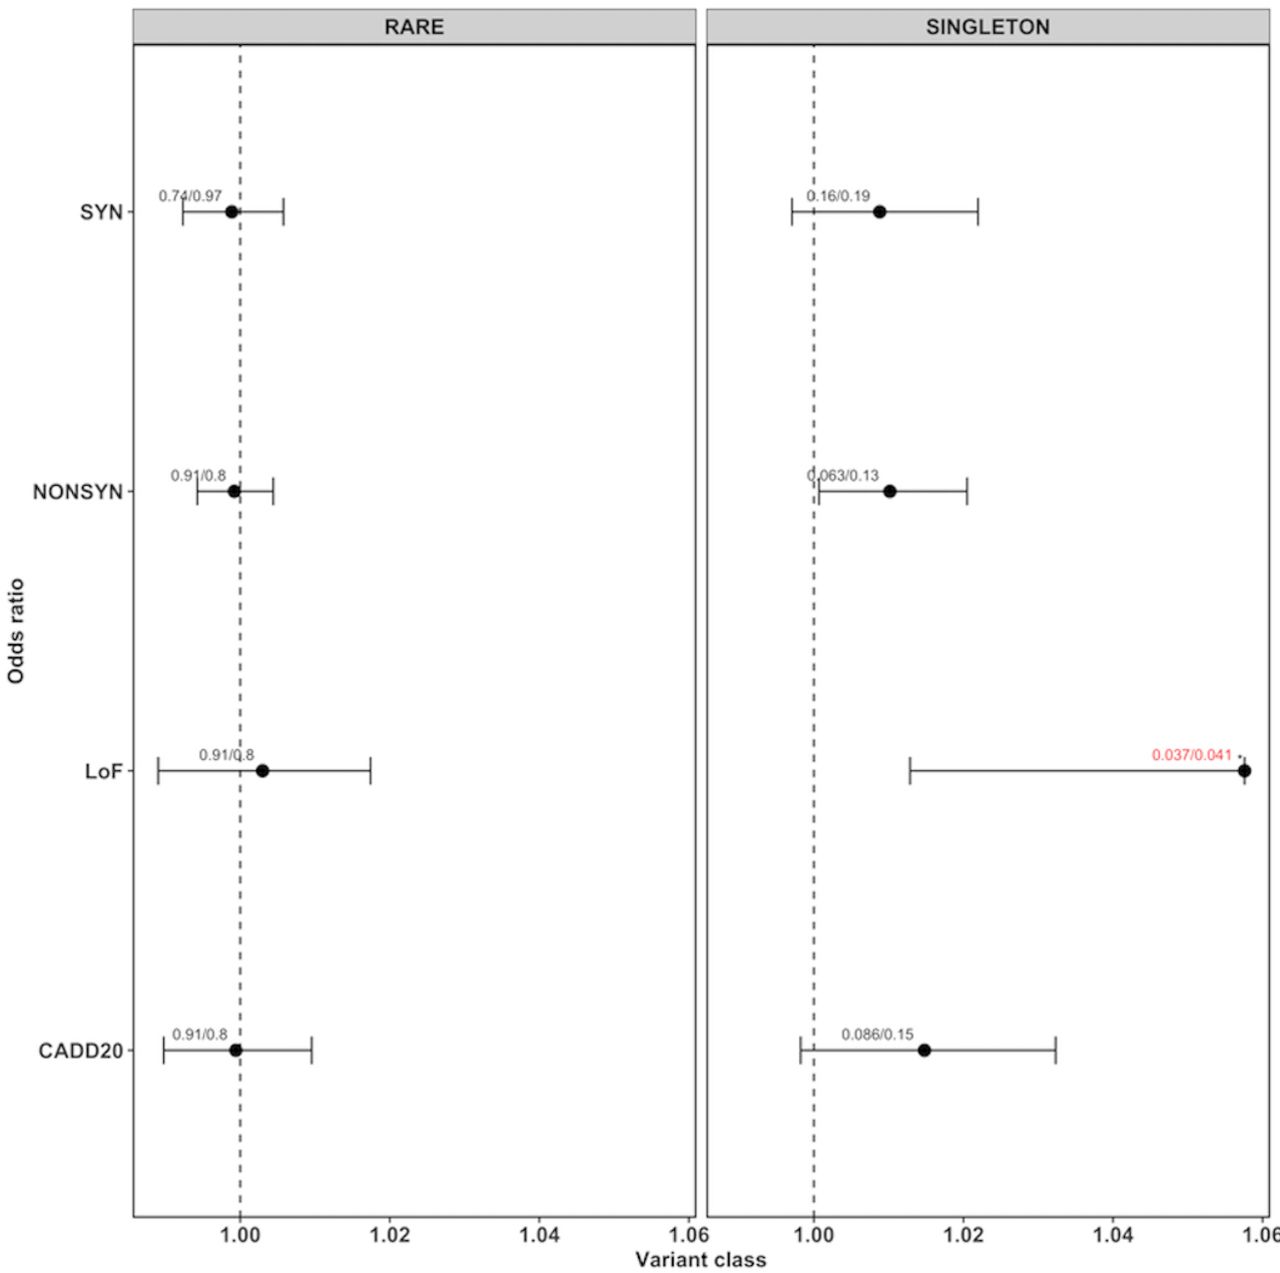
We checked whether rare and singleton variant classes were over-represented in PD cases versus controls. We generated an individual burden score for each sample by counting the number of variants in each variant class. We compared the individual burden score of cases and controls by two different approaches: First, for each variant class, we constructed a generalised linear model by correcting for total number of qualifying variants called in that sample using gender and the first 10 eigenvectors from the EIGENSTRAT analysis as covariates, and calculated a p value (pglm). Since coverage or sample size bias can lead to an increased number of rare or singleton variants, we performed additionally a permutation analysis generating 10 000 sample label permutations. For each permutation, we computed the two-sided Wilcoxon rank-sum test34 35 to calculate a permutation p value. Then, the permutation p values were compared with the original p value to generate an empirical p value (pemp) by using the formula: (r+1)/(n+1) (r=number of times the permutation p value is smaller than the original p value, n=number of permutations). We chose the Wilcoxon rank-sum test because it accounts for differences in sample sizes and the presence of any outlier samples.36 R V.3.4.2 was employed to calculate all p values. We performed the multiple testing adjustment using the fdr method implemented in the function p.adjust in R. For rare and singleton variants (figure 1), they were adjusted for three variant classes (NONSYN, CADD20 and LoF). We did not consider the SYN variants as they were assumed to be neutral. Whereas for LoF sub-variant type analysis (figure 2), we adjusted for five LoF variant types (frameshift.insertion, frameshift.deletion, splicing, stopgain and stoploss).

ORs for rare and singleton variants for different variant classes. Each dot represents the OR generated by the generalised linear model (glm) given with their 95% CIs (as horizontal lines, for loss of function only the left part of the interval). The values on top of each point represent the corrected p value from the glm model (pglm) and the empirical p value (pemp) from the Wilcoxon rank-sum test, separated by ‘/’. If both the corrected p values were below 0.05, they are highlighted in red with an ‘*’ on top.

ORs for singleton loss-of-function (LoF) variants for different variant types. Each dot represents the OR generated by the generalised linear model (glm) given with their 95% CIs (as horizontal lines, for LoF only the left part of the interval). The values on top of each point represents the corrected p value from the glm model (pglm) and the empirical p value (pemp) from the Wilcoxon rank-sum test, separated by ‘/’. If both the corrected p values were below 0.05, they are highlighted in red with an ‘*’ on top.
In order to ensure that there were no deviations from the expected p values due to low quality of data, we generated QQ plots by qqplot() in R V.3.6.1 for both rare and singleton variants across different functional groups (online supplementary figures 2–11). The p values were generated using the score method available as part of rvtests package. We used the same parameters as for the burden analysis as covariates for this analysis (total number of qualifying variants called per sample, gender and the first 10 eigenvectors from the EIGENSTRAT analysis).
Construction of genetic features for disease risk models
Similar to previous PD risk models,1 we used a PD-specific PRS which is generated based on common variants. To calculate the PRS per sample, summary statistics of 43 SNPs that were found previously to be genome-wide significantly associated with PD3 were selected (online supplementary table 2). PRSice 37 with default parameters was used to calculate the PRS for each sample using the available NeuroX genotype data from PPMI. As a new genetic feature, we used the count of singleton LoF variants per individual as an additional prediction variable.
Evaluation of prediction features
A list of clinical and non-clinical PD-specific variables available for the PPMI study can be found in online supplementary tables 3 and 4. To evaluate the predictive ability of the clinical, non-clinical and genetic features (see above) for PD risk, we employed one-way ANOVA for continuous features and the χ2 test for categorical variables. One-way ANOVA compares the means from two independent (unrelated) groups by using the F-distribution. A significant p value (study threshold was set to 0.05) indicates that the means of two groups are unequal. The F-statistics and p values obtained from ANOVA/χ2 test are given in online supplementary table 3.
Classification models
After the selection of input features, we built seven disease risk prediction models using sex as covariate for all models: (1) based on PRS, (2) based on singleton LoF score (number of singletons per sample), (3) based on family history of PD, (4) based on singleton LoF score and PRS, (5) based on family history of PD and singleton LoF score, (6) based on family history of PD and PRS, and (7) based on singleton LoF score, PRS and family history of PD.
Two state-of-the-art machine learning approaches, namely logistic regression and random forest, were chosen to construct the prediction models. All the machine learning analyses were performed using Ada (https://ada.parkinson.lu), a novel data exploration and analytic platform developed at the Luxembourg Centre for Systems Biomedicine. For advanced statistical analysis and machine learning, Ada employs the Spark ML library (https://spark.apache.org) including a variety of classification, regression, clustering and feature selection routines. For the classification models, we used the default parameters provided by Spark ML library: L2 regularisation, fitting the intercept, maximum 100 iterations, and tolerance of 10E−6 for the logistic regression model and with depth 3—maximum 32 bins, 20 trees, without subsampling of training data for the random forest model. For each iteration, we split the sets randomly with a training:test ratio of 0.9 and fed the training part to the classifiers. We repeated this process 1000 times and reported the mean test area under the curve (AUC) as a target evaluation metric. AUC is always given with a 95% CI.
Results
Population stratification and quality control
After filtering based on ethnicity, cryptic relatedness and quality parameters, the final PPMI dataset comprised 340 PD and 146 control samples. As it can be seen from online supplementary figure 1, cases and controls clustered both with the European samples of the 1000 g data except for a few outliers. This observation is in line with the previous observations from another study based on PPMI data which was performed on genotype array data.19 The quality metrics are given in online supplementary table 1. The Ti:Tv ratio of exonic and splice-site variants is >3, indicating good quality. Average call rates of 0.993 and 0.994 were observed in controls and cases, respectively. No significant difference in the call rate was observed between cases and controls (Wilcoxon rank-sum test p=0.242). We checked the singleton variants from the WES against the recently available WGS data from the same samples. We found 94.27% concordance between both independent sequencing runs from the same samples.
Excess of rare singleton LoF variants
We could not detect exome-wide burden when performing burden analysis for all rare variants (figure 1, online supplementary table 5). However, we found a significant burden of singleton LoF variants (corrected pemp=0.034, corrected pglm=0.037, OR 1.058, 95% CI 1.013 to 1.106) in cases compared with controls. Whereas, no significant difference was found for neutral SYN variants (corrected pemp=0.191, corrected pglm=0.161, OR 1.009, 95% CI 0.997 to 1.022) or any other variant class. In order to evaluate which variant subtypes of singleton LoF variants are driving the signal, we tested each subtype independently. In figure 2 and online supplementary table 6, it can be seen that the majority of the burden signal is coming from frameshift deletions (corrected pemp=0.014, corrected pglm=0.014, OR 1.191, 95% CI 1.060 to 1.344) and stopgain variants (corrected pemp=0.035, corrected pglm=0.05, OR 1.141, 95% CI 1.023 to 1.279). The number of case and control samples with qualifying variants per gene for NONSYN, SYN and LoF variants are given in online supplementary table 7. In online supplementary table 8, we give per sample the number of qualifying variants for the different variant classes. No obvious deviations from the expected p values were found for single variants ruling out the possibility of observed results due to low sample/variant quality as shown by the QQ plots (online supplementary figures 2–9). On average, we found nine singleton LoF variants per sample in cases versus eight in the controls. The distributions and boxplots of different singleton variant types in cases versus controls is shown in online supplementary figures 10–24.
Disease model and prediction performance
For the disease risk prediction model, we tested 12 clinical, 3 non-clinical and 2 genetic features, the PRS and the singleton count from the LoF analysis. An overview on the features and their predictive power is given in online supplementary table 3. Nine clinical, one non-clinical (PD family history) and the two genetic features (PRS and singleton LOF count) were found to be significant for the prediction of disease. Predictivity of the common genetic background was supported by the statistically significant difference between the distribution of PRS in cases and controls (p=2.829e−05) (figure 3) using the Wilcoxon rank-sum test.

Distribution of polygenic risk score (PRS) in the Parkinson’s Progression Markers Initiative dataset. There is a significant shift in PRS in the cases compared with the controls.
Due to the fact that the clinical scores are designed to distinguish the PD cases from healthy controls, the usage of clinical features for the classification problem we aim to address makes the prediction task rather trivial. This is shown here by the fact that most of the clinical features are highly predictive (online supplementary table 3) by themselves. For instance, the clinical scores of University of Pennsylvania Smell Identification Test (UPSIT) and Unified Parkinson’s disease rating scale (UPDRS), which describe certain aspects of PD phenotypes, separate nearly perfectly PD cases and controls into two distinct groups as can be seen in figure 4. In our experiments, the prediction models based on these two PD-specific clinical scores reached an AUC >0.95 (results not reported here). In addition, by performing the ANOVA/χ2 test, we demonstrated that a majority of the clinical features have very low p values and thus possess high predictive power (online supplementary table 3). Age and sex showed minimum predictive power given by the independence tests’ p values (age=0.3472, gender=0.7193).

UPDRS score vs the UPSIT score of the samples from the Parkinson’s Progression Markers Initiative dataset. Cases and controls are separated into two distinct groups.
Therefore, we aimed to train our PD risk prediction models on non-clinical and genetic features alone. For the final risk prediction model, we used the PRS, the singleton LoF variant count per sample and the PD family history together with sex as covariate. The PRS, the singleton LoF count and the PD family history showed the most significant predictive power out of the non-clinical features we considered (online supplementary table 3) and were tested in all possible combinations (figure 4). By combining all three features, PRS, singleton LoF count and PD family history, we reached an AUC of 0.703 (95% CI 0.698 to 0.708). The performance of models with two or single features were substantially lower, but it is remarkable that the singleton LOF variants (AUC=0.587, 95% CI 0.582 to 0592) have already more prediction power compared with the family history alone (AUC=0.56, 95% CI 0.556 to 0.564) showing that they contribute to the overall risk prediction.
Our predictor that is built on the combination of common (PRS) and rare variants, the singleton LoF count predicts PD disease state with an AUC of 0.653 (95% CI 0.647 to 0.659). It performs in line with the state-of-the-art classification model for the PPMI dataset built on the basis of PRS1 with an AUC=0.639 (95% CI 0.589 to 0.688), which also uses a logistic regression method. By using solely the PRS (with sex as covariate) to our logistic regression, we are reaching an AUC=0.616 (95% CI 0.611 to 0.621) which is comparable with the previous study.1 The difference in performance could be due to different utilisation of SNPs, samples and methods to generate the PRS. Finally, by adding the family history of PD to the common and rare variants, the AUC increased to 0.703 (95% CI 0.698 to 0.708). Using three non-clinical features including rare variant counts improves the performance by 10% compared with the prediction based only on common variants.
Discussion
Even 200 years after the first description of PD by James Parkinson, its diagnosis is still a challenge and since the underlying mechanisms and its complex genetic architecture are not fully understood, no curative treatment is available. By studying the whole-exome sequencing data of 340 PD cases and 146 controls of the PPMI cohort, we have found a polygenic exome-wide burden of singleton LoF variants that increases risk for PD. From our estimations, on average nine genes with of singleton LoF variants contribute to the signal detected in this paper compared with on average eight in controls. Singleton calls were validated using independently acquired WGS data from the same samples. Since we did not have access to the WGS raw data, we could not check if all high-quality LoF singleton calls in the WES data had enough or comparable coverage in the WGS data, such that we expect to have an even higher rate of concordance between both technologies. The high concordance rate of more than 94% can therefore be seen as a lower bound for concordance.
The identification of individual genes that show a genome-wide significance is often difficult primarily due to the small sample sizes and the accompanied multiple testing problem, also valid for this study. However, our results indicate the additive contribution of singleton LoF variants of an individual to the aetiology/pathogenesis of PD. We have corrected for various confounding factors by applying generalised linear models and additionally by performing sample label permutations, minimising potential bias. Moreover, and further strengthening our findings, we see a significant burden in PD of singleton LoF variants but not in functionally neutral synonymous variants. The major signal within the singleton LoF variants came from the frameshift deletions and stopgain variants. Based on the evidence from the current study, we speculate that the genetic risk for sporadic PD is not confined to certain genes but instead is distributed across multiple genes supporting the assumed polygenic inheritance and complex genetic architecture of PD.
Based on these findings, we trained seven disease risk prediction models based on binomial logistic regression and random forest using combinations of one non-clinical and two genetic features as input: the singleton LoF variants count, the PRS based on common risk variants and the family history of PD. Our logistic regression model performs better than the state-of-the-art PD risk classification model for the PPMI data set for non-clinical features only.1 2 Also, we showed that the predictive models built on the features based on a combination of rare and common variants perform better compared with the models built on common variants alone. The previous study1 also presented an UPSIT-score-only model with a very high performance (AUC=0.901 (95% CI 0.874 to 0.928)). By adding the demographic features and PRS, they attained an AUC=0.923 (95% CI 0.9 to 0.946). Even though it is a significant increase as shown in the study based on DeLong’s test for correlated ROC curves (|z|=3.027, p=0.002), in relative terms the PRS could increase the AUC only marginally and thus, the prediction is almost fully dominated, as expected, by the UPSIT score. We wanted to avoid this situation and perform a more challenging prediction without including any clinical scores as discussed above.
Besides the logistic regression, we trained a second machine learning classifier, a random forest. As presented in figure 5, the logistic regression performs here better than the random forest, due to the fact that our classifiers were fed with only very few variables, which makes the task too simple for the random forest. Unlike logistic regression, which has almost identical performance on the training and test sets, the random forest overfit the training data (data not shown). This would even worsen for random forests with larger depths (hence the shallow setting).

Performance of different models for the prediction of Parkinson’s disease (PD) risk. The area under the curve (AUC) values (with 95% CIs) of seven models and two prediction models for the Parkinson’s Progression Markers Initiative dataset. Two predictors, logistic regression and random forest, were applied. PD family history, family history of PD up to first degree; PRS, polygenic risk score; Sex, reported gender; Singleton, singleton loss-of-function count per sample. The higher the mean AUC, the better the model. The reported AUC is a mean over 1000 repetitions on test sets randomly drawn with a 0.9 training–test split.
In PD research, a general consensus is that, in very broad terms, PD is triggered by a combination of genetic and environmental factors, which is underlined by the fact that there is no single gene or variant that explains the majority of inheritance in our sporadic PD cohort. On the other hand, acquiring clinical scores is time consuming, cost-expensive and laborious. Therefore, by limiting to genetics and a small set of non-clinical features, we make potential diagnostic applications of risk models more practical, cost-effective and scalable. To the best of our knowledge, this study makes for the first time use of available whole-exome sequencing data to define genetic features in combination with non-clinical data to improve risk prediction in PD.
Despite the fact that there is a burden of singleton LoF variants in PD cases, our study should be considered preliminary and needs replication in larger PD cohorts. Identification of variants associated with PD along with the integration of PD-specific pathway information that is represented in resources such as PD map38 could lead to a higher diagnostic accuracy of PD, and there is an imperative need to decipher the contribution of rare and common variants to further dissect the aetiology of PD. The major limitation of the current study is the limited sample size. When studying rare and singleton variants, larger samples sizes are needed to confirm certain genes or variants that are associated with the disorder. Excess of singleton variants can also occur due to quality issues. We think, although we avoided this issue with stringent quality control, a replication study is required in order to substantiate these findings. Another limitation of our study and of WES studies in general is that we could only perform burden analyses of coding variants and adjacent intronic regions for splice variants. However, there might be additional factors such as non-coding variants which could also contribute to the progression of PD. Clearly, this could be only tested when whole-genome sequencing data would be available. The limitation of our risk prediction model is that by employing a small sample set for both training and testing, the resulting model is more vulnerable to chance fluctuations than a larger dataset or using independent samples. We expect that with an increasing number of sequenced and genotyped PD samples with deeply phenotyped clinical data, more accurate predictive models can be constructed and the contribution of rare variants in generating these models will improve significantly.
We could show that singleton LoF variants contribute to the complex genetics of PD and that disease risk prediction models combining singleton and common variants improve risk models based solely on common variants. In the future, more refined strategies to include rare variants in the construction of PRS is warranted. It is our hope that we can extend this work and further develop our strategy in order to build an accurate diagnostic tool that can be employed in the clinical setting. The PRS and the risk model could also be applied to stratify the patients for a personalised medical treatment.
Acknowledgments
The authors are grateful to Dr Lars Geffers, LCSB, Luxembourg for excellent project management and discussions. Data used in the preparation of this article were obtained from the Parkinson’s Progression Markers Initiative (PPMI) database (www.ppmi-info.org/data). For up-to-date information on the study, visit the PPMI website (www.ppmi-info.org). Parts of the computational work in this study was performed on the high-performance cluster of the University of Luxembourg (https://hpc.uni.lu). An early version of this work was published as part of the doctoral thesis of DRB at the University of Luxembourg (https://orbilu.uni.lu/handle/10993/35577).
References
Supplementary materials
Supplementary Data
This web only file has been produced by the BMJ Publishing Group from an electronic file supplied by the author(s) and has not been edited for content.
Footnotes
DRB and PB are joint first authors.
Contributors DRB and PM conceived the study. DRB analysed the data. PB performed machine learning. All authors interpreted the results and wrote the manuscript.
Funding This work was supported by grants from the Luxembourg National Research Fund (FNR) within the National Centre for Excellence in Research on Parkinson’s disease (NCER-PD to PB, RK, PM) and PEARL program (FNR/P13/6682797 to RK), the EU Joint Program-Neurodegenerative Diseases (JPND; COURAGE-PD to RK, DRB, PM), the German Research Council (DFG; KR2119/8-1 to RK) and by the European Union’s Horizon2020 research and innovation program under grant agreement no. 692320 (WIDESPREAD; CENTRE-PD to RK and PM).
Competing interests RK received speaker’s honoraria and travel grants from Medtronic. DRB works for MeGeno S.A. Luxembourg.
Patient consent for publication Not required.
Provenance and peer review Not commissioned; externally peer reviewed.
Data availability statement Data are available in a public, open access repository. Data used in the preparation of this article were obtained from the Parkinson’s Progression Markers Initiative (PPMI) database (www.ppmi-info.org/data). For up-to-date information on the study, visit the PPMI website (www.ppmi-info.org).